The MACD Works/ Charts inside.
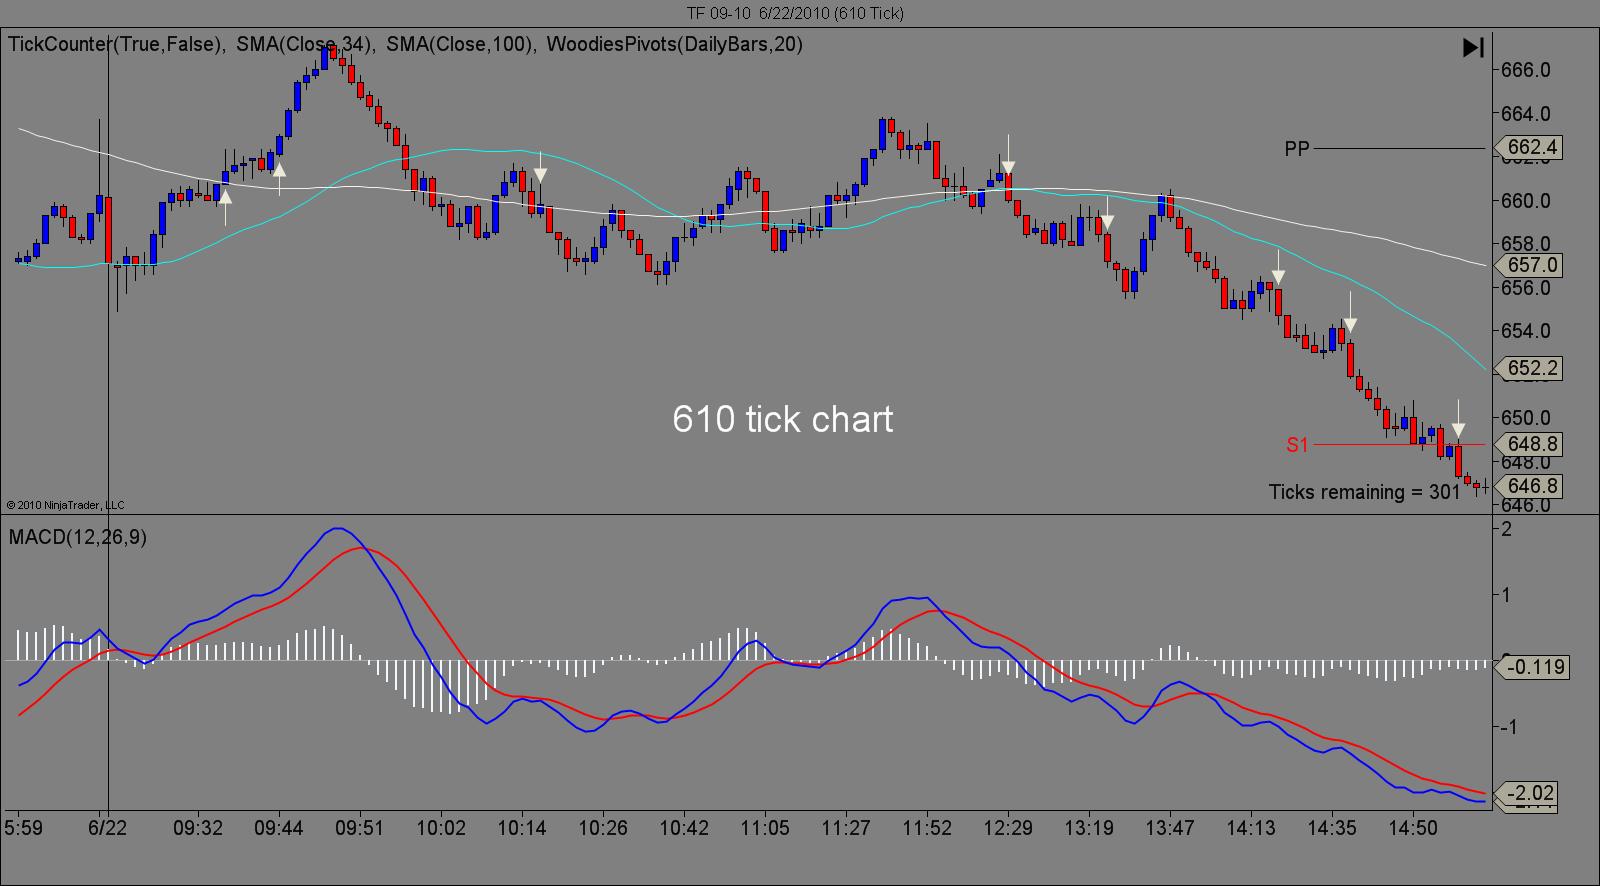
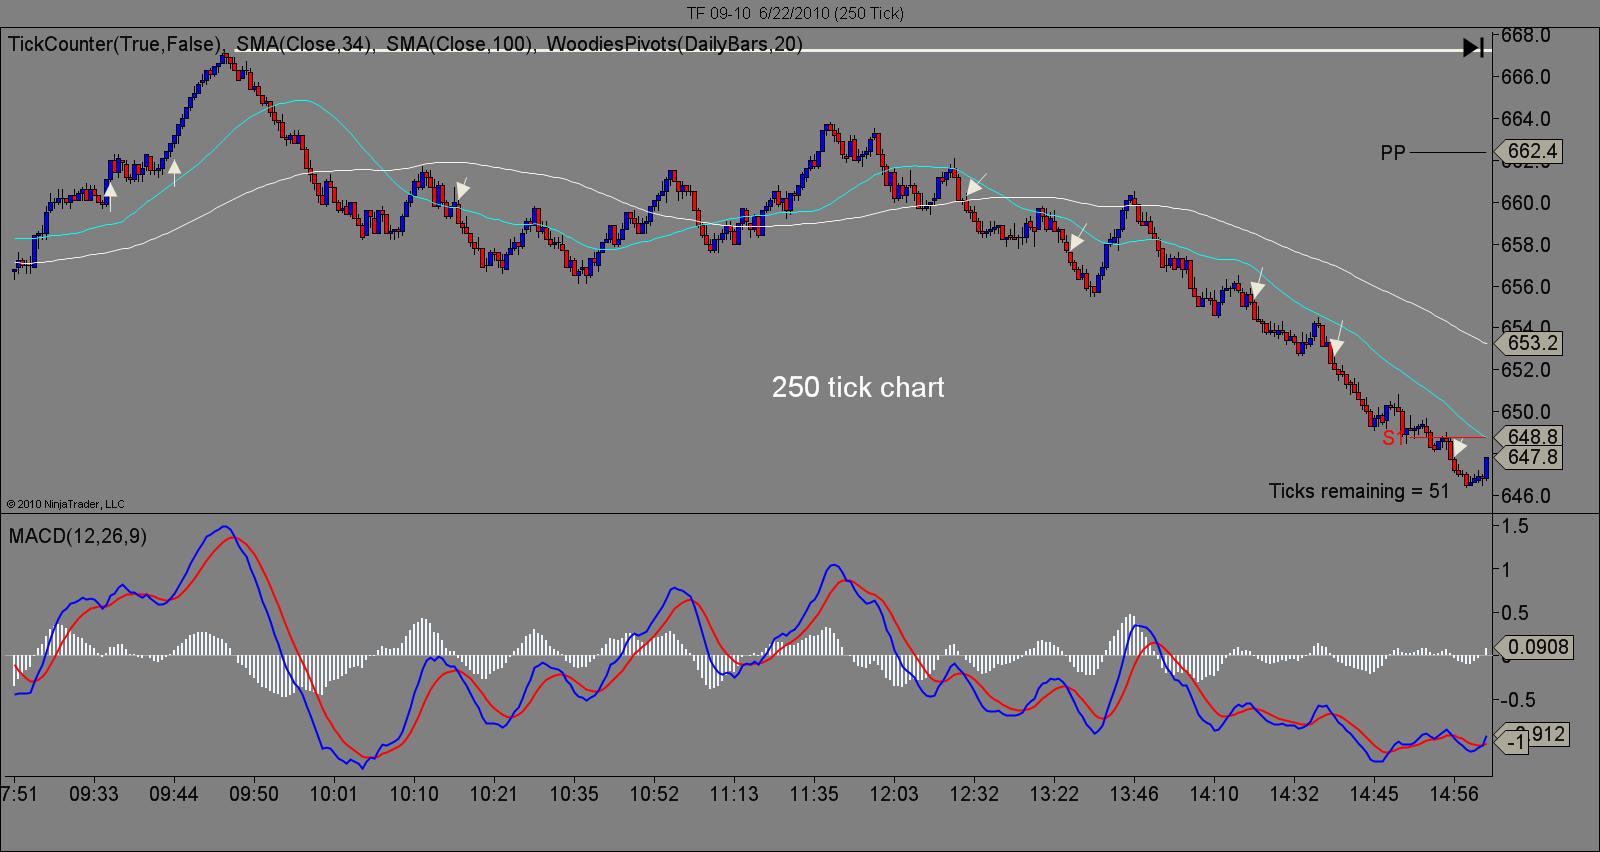
I use a 610 tick chart, and a 250 tick chart. I have Woodies Pivot points on my charts. I use a SMA 34 and a SMA 100. My MACD is normal 12,26,9. I had woddies CCI on my charts too, but since visiting this site I have removed it, in the hopes of not "seeing everything".
Does anyone know what I mean by that " seeing everything"? I only trade the Russell 2000 and maybe that is why I have not made this work out yet. Instead of being patient, I'm "looking" for trades here, and their, and every where. The real problem is that when I decided that because of the circumstances to modify a rule on the fly, the tragedy is, sometimes I'm right! I think that puts the nail in the coffin. Being right about a trade I should of never taken in the first place is death. Because the next time, the next time, you get wip sawed off your butt.
The MACD
It does work. Every night I set down and see the same thing, over and over again. If a person just took trades off a 610 tick chart using a 250 tick chart to enter, they would do well. The thing to do is to take trades long or short when the red line is above or below the zero line and rising(see charts). So why am I still sitting here with four blown accounts "looking" for something that works. It's obvious I'm the problem. But what is it that is the problem?
I have alot more to say about this, but I'm tired. I appreciate all posts negative or positive.
Click image for original size
Click image for original size
Chad:
IMO, a "system" trader takes all trades as defined by his/her system. The great advantage of it, is that historical performance of the system can be tracked (through backtesting and day-by-day forward "testing").
In the case of what you just posted, it would be very easy to backtest the performance of that system (and you don't have to use multiple timeframes for that, just multiply the MACD parameters used in the higher timeframe chart by the ratio of higher to lower timeframe - ie. 610/250, and use that "scaled" MACD parameters in the lower timeframe chart).
At that point, I am pretty sure you'll find the following :
- that system is not as profitable as you thought it is
- it has a much larger max drawdown as you are willing to ever go through
- a large number of winning trades look so scary (dumb) at the hard right edge that you would have real trouble pulling the trigger on these.
IMO, what makes a "discretionary" trader is the flexibility given in his trading plan to use his/her judgment in trade selection, entry style and trade management. Sure, the trading plan is likely to provide guidelines to that effect, but the responsibility of each trade remains with the trader. The corollary is that discretionary trading cannot be backtested, period.
Back to your post ... are you a system trader ? If so, you MUST have backtesting results for that system, I would say covering at least 1 year AND 300+ trades, and you SHOULD be trading this system mechanically (ie., have a computer execute all the trades for you).
If not, you are a discretionary trader ... meaning that your trading plan should have guidelines for the judgment-part of your trading - "I only take the best setups" isn't a guideline IMO, just wishful thinking ;) This is where things can become wide open ... one can be a discretionary trader by filtering a "system" setups using a set of quantified criteria, another using only qualitative criteria on the same "system", and yet another one have no "system" at all, and only use a set of qualitative criterias to define the setups.
Helps to have a strong trend as in your example, which is the real power of the MACD, trend identification. I would suggest there are better tools for trade timing (entry / exit) than the MACD however (re. your 250 tick chart signals).
I use the MACD and the MACD Histogram quite a bit. There is a lot of information available in the MACD & Hist if you know what your looking at. They are kinda like that trusty old hammer in the tool box, it ain't sexy but it's nice to keep handy when you need to get a job done.
I use the MACD and the MACD Histogram quite a bit. There is a lot of information available in the MACD & Hist if you know what your looking at. They are kinda like that trusty old hammer in the tool box, it ain't sexy but it's nice to keep handy when you need to get a job done.
PT, Perhaps you could give us some examples of how to identify congestion or trends when using the MACD ? I think that is the biggest battle - determining trending behavior....
Bull and bear flags look great after the day is done but when the day is unfolding we never really know what will happen. I know you are also a student of MP but I'm more concerned with your use of the MACD indicator to confirm congestion or breakouts.
It seems that we all need to protect ourselves from the 20 % of the time we trend to avoid losses and learn to captialize on the 80% of the time we don't trend.
Of Course, the flip side of that is to suck every penny out of a trend and avoid the congestions. Anyway the real point of this is to see the Macd in action and how it confirms or negates trend. Thanks!
my thoughts on this are it is hindsight trading, i would get a market bias first from a longer time frame chart , also i would look into candlestick readin and pattern recognition systems , studying what tails do at an indicator such as a macd or 20 ma ot lrc really any indicator, i would take a look at forwaord lookin things like reversal times like 10, 10,30 12 and 2 pm, the ma is only a line in the sand ,
in the chart above the short signals were the bearengulf candlesthe candles become extended from the ma and then tey snap back to it
It seems like you have drawn a big influence from this thread on another forum.....can't comment on all 1000 plus pages but perhaps there are some additional pointers in there...
here it is:
http://www.elitetrader.com/vb/showthread.php?s=&threadid=99283
here it is:
http://www.elitetrader.com/vb/showthread.php?s=&threadid=99283
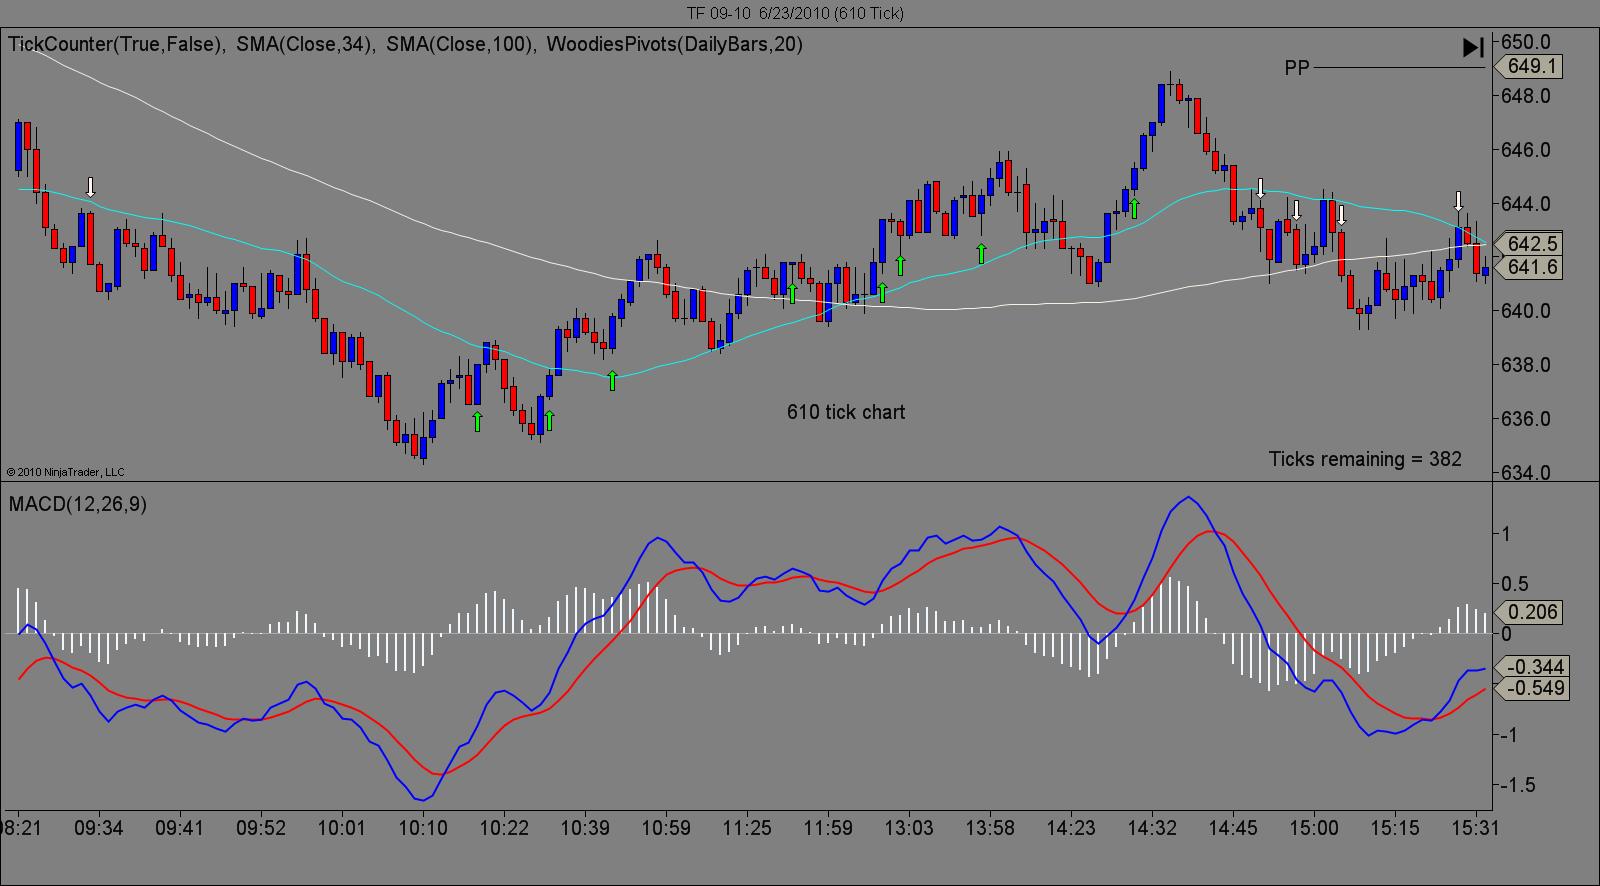
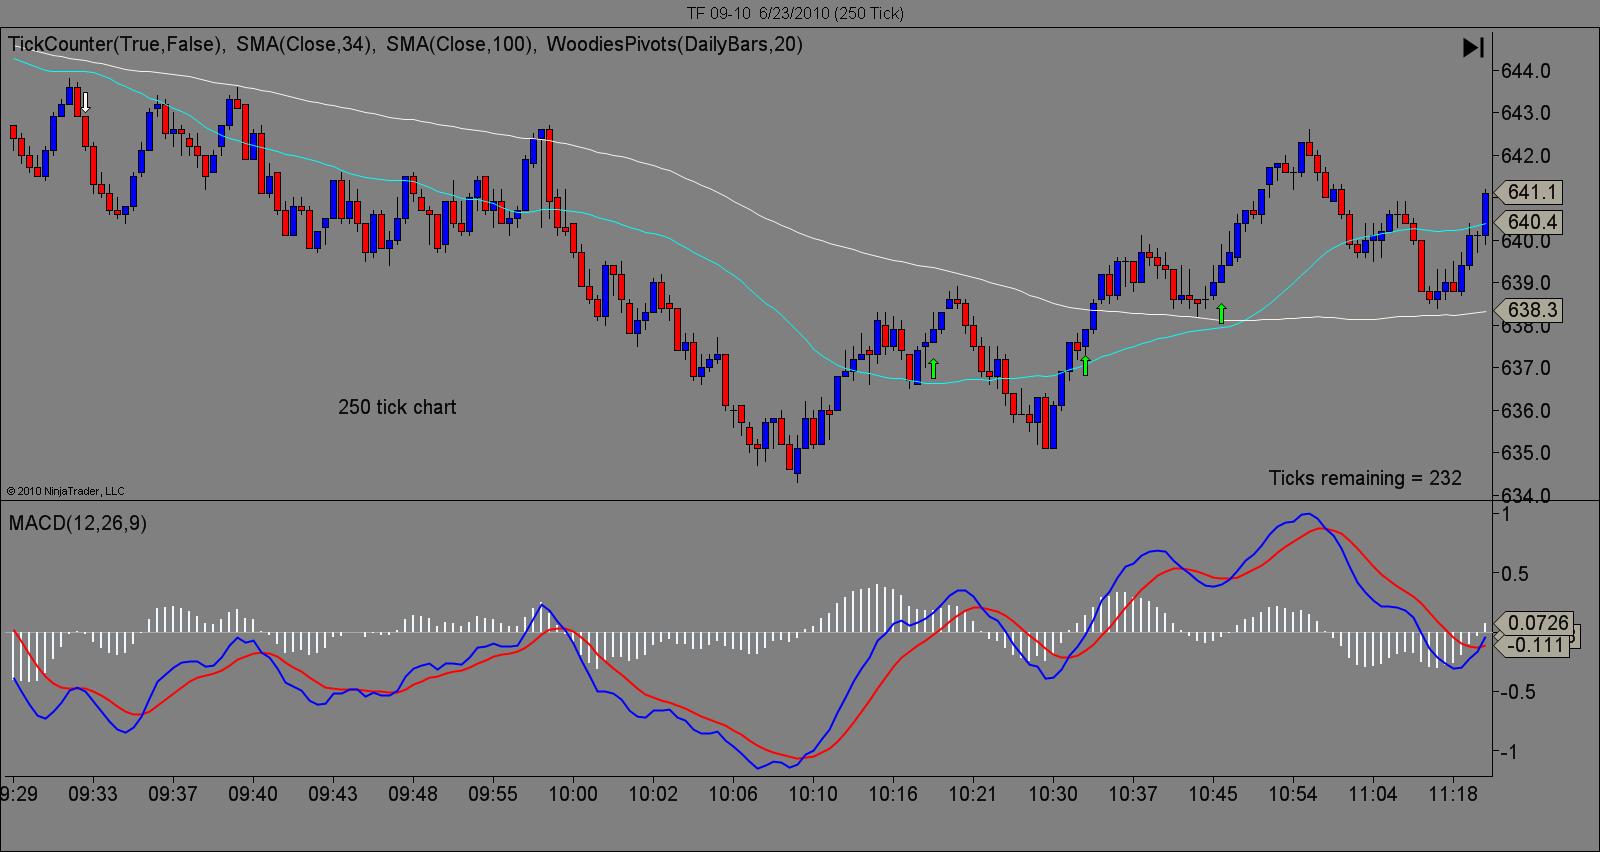
Ok so this is what I did all day today on the Russell 2000. When the MACD red line was rising or falling I would take long or short trades, using a 250 tick chart with a MACD cross as the entry.
13 trades, with 3 contracts on each. So that is a total of 28 trades, with 21 winners and 7 losing trades. I'd take 3 ticks on 2 contracts then move the stop to break even. Stop was at 12 ticks. I know it's large, I'm not sure how to fix it.
I'd let the runner go till the MACD crossed on the 250 tick chart.
Net profit was 970
Sounds fantastic doesn't it? My largest losing trade was 14 ticks on 3 contracts that is -420 dollars. This all happened by the 5th and 6th arrows on the chart. Prior to this happening I was up 570 dollars, then I let two trades go futher than they should of and all of a sudden I'm down.
Why do I do this? I think it has something to do with a great immaturity on my part. I just can not accept a losing trade, its so hard for me to see past it to tomorrow, or the next day, or the next week, or month. No one trade should break me or make me, but it has! Lot's of times!
That only means one thing, and I know what it is. Having undefined rules floating around in my head and not on paper. Every night I look at this and see this works. It's the same thing over and over again.
The 250 tick chart is split in half. I wanted anyone who carried to look to be able to see it clearly. On the 610 tick chart you can see the whole day.
Any comments negative or else appreciated.
Chad
Click image for original size
Click image for original size
Click image for original size

Originally posted by Skyfly
13 trades, with 3 contracts on each. So that is a total of 28 trades, with 21 winners and 7 losing trades. I'd take 3 ticks on 2 contracts then move the stop to break even. Stop was at 12 ticks. I know it's large, I'm not sure how to fix it.
I'd let the runner go till the MACD crossed on the 250 tick chart.
- Not sure how the maths work here ... 13 trades is 13 trades, why do then go saying that is a total of 28 trades ?
- When trading multiple profit targets, on the long run each profit target should make money of its own ... I suspect a 3-t target with 12-t stop won't make money in the long run ... think about it : after comms, and ignoring stop slippage, you make 2.5-t on a win and lose 12.5-t on a loser, which means you need a win rate of 84% simply to break-even
- great to see you have a runner strategy
Originally posted by BruceM
PT, Perhaps you could give us some examples of how to identify congestion or trends when using the MACD ? I think that is the biggest battle - determining trending behavior....
Bull and bear flags look great after the day is done but when the day is unfolding we never really know what will happen. I know you are also a student of MP but I'm more concerned with your use of the MACD indicator to confirm congestion or breakouts.
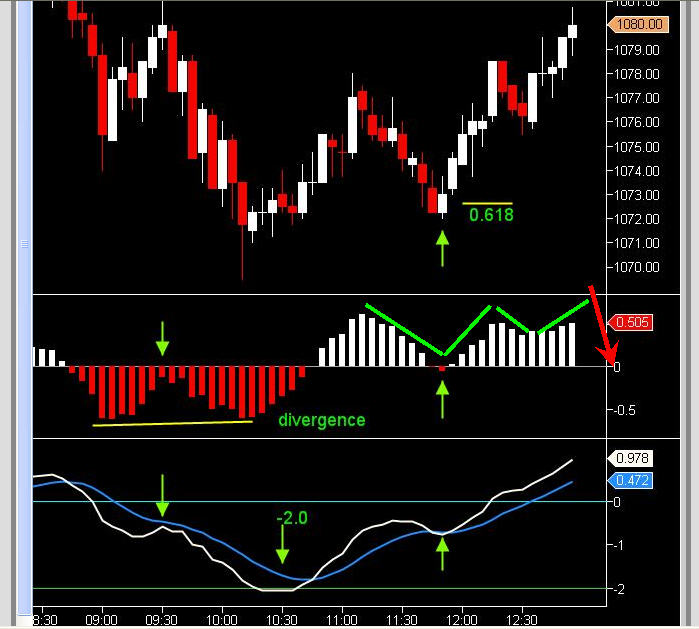
I have a simple rule that I follow: I assume the trend is being correctly reflected by the MACD until the MACD Histogram signals a divergence. Once I see a divergence, the risk of a reversal has increased and the rule no longer applies.
So if the MACD is above a rising signal line, and the histogram does not have any divergence, then I assume the trend is up. In which case, Skyfly's technique would be applicable (for me), and I look for higher low C point's for entry into the developing up trend.
Below is the current 5 minute chart of the ES. The blue line is the MACD signal line, which for me indicates direction. So if the white line is above the blue line and the blue line is rising, then the trend direction is up. In that case I am looking for retracements (higher lows) to enter into the trend on the Long side. This gives me direction. The faster time frame charts, such as suggested by Skyfly, can then be used to fine tune entry within the trend.
Click image for original size

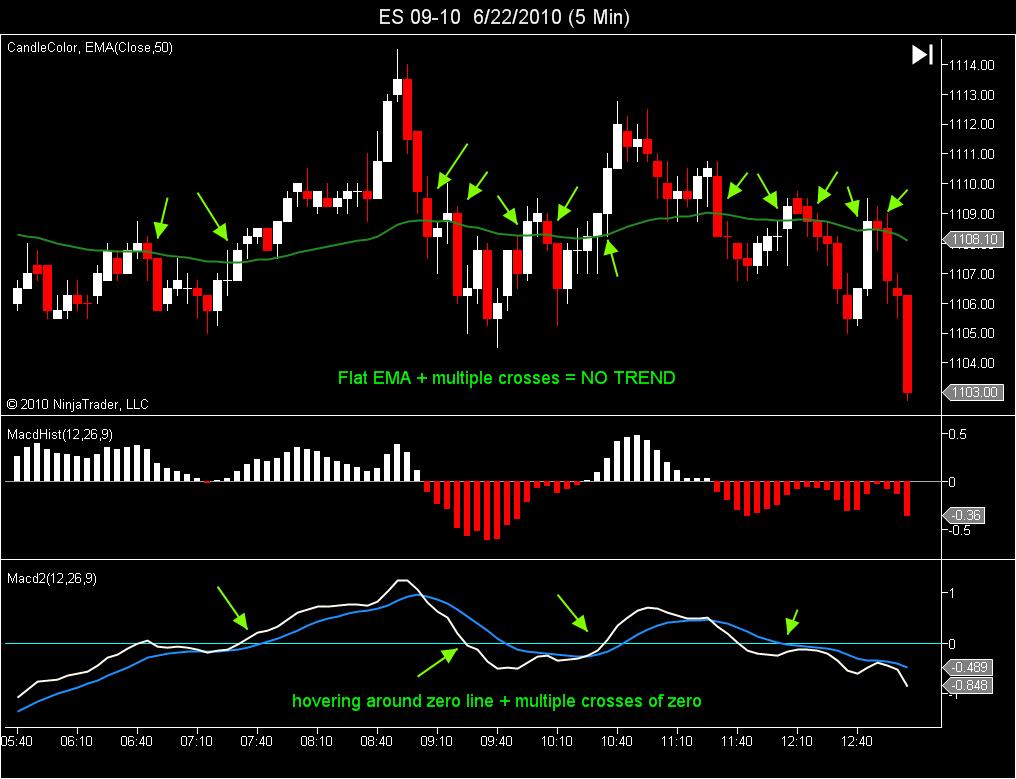
I have one more filter / rule that i apply: If the 50 period EMA line on the 5 minute chart is flat (the line is going sideways across the middle of the chart) and price is criss-crossing the line , then I assume there is no trend and the MACD is ignored. The blue signal line tends to confirm this by hovering ( or drifting sideways ) close to the zero line. I maintain this "no trend" assumption until price breaks out of developing value and the moving averages fan out confirming the new trend. (Obviously, using MP clarifies this situation explicitly). Tuesday morning was an excellent example of this situation as shown in the chart below...
Click image for original size
I miss your charts and analysis, friend .. Kudos!.. You probably taught me more than anyone here at mypivots ,along with Bruce.... keep em coming!
Click image for original size
dont forget the good ole 'Mitten' pattern
Emini Day Trading /
Daily Notes /
Forecast /
Economic Events /
Search /
Terms and Conditions /
Disclaimer /
Books /
Online Books /
Site Map /
Contact /
Privacy Policy /
Links /
About /
Day Trading Forum /
Investment Calculators /
Pivot Point Calculator /
Market Profile Generator /
Fibonacci Calculator /
Mailing List /
Advertise Here /
Articles /
Financial Terms /
Brokers /
Software /
Holidays /
Stock Split Calendar /
Mortgage Calculator /
Donate
Copyright © 2004-2023, MyPivots. All rights reserved.
Copyright © 2004-2023, MyPivots. All rights reserved.