Es short term trading 7-29-10
Numbers I'm using on Thursday
1115.25 -1117
1108 - 1110 *********
1096
1089 - 1091
1082 - 1084
let see if the reports and O/N can help refine these a bit
1115.25 -1117
1108 - 1110 *********
1096
1089 - 1091
1082 - 1084
let see if the reports and O/N can help refine these a bit
Mike, How long do you typically hold when looking for a +20 point gain? what kind of stop losses do you use?
Originally posted by Big Mike
Originally posted by BruceM
Mike..can u elaborate....why was 1090 key...for you...is the hour close based on the 9:30 EST open...so the first hour for you closes at 10:30??Originally posted by Big Mike
If this HR candle closes below 1090, I could see 1078-1080 being reached as it's the next support area to be tested.
The 1090 area looked to be the area of a supply/demand balance based it hanging right around the 1090 "area" for 24 hours on 7/23-7/24.
I use hourly candles with 24 hour trading sessions and try to base everything off supply/demand.
Seems most here are much shorter term traders. I'm looking to get in trends where 20 points is available.
Have you evolved away from that, more towards "scalping"? The indicators you guys run are quite interesting. Triples, Air etc.
I run a "clean" chart w/o indicators.
I am finished trading for today, but as an example is anyone noticing that there is very little supply/demand balance apparent in 1088-1099 range. Demonstrated on 7/23 and twice today. Price does not like to be there!
Keep up the good work, I'm learning along with everyone.
Good fortune to all!!
I hold until it's done. Meaning it depends on speed, momentum and observe support/resistance areas.
5 point stop on entry.
If it goes, it goes. If not...
5 point stop on entry.
If it goes, it goes. If not...
took all off except one at 01.50...this isn't resolving fast enough
Originally posted by Big Mike
I hold until it's done. Meaning it depends on speed, momentum and observe support/resistance areas.
5 point stop on entry.
If it goes, it goes. If not...
Thanks Mike!
that would have been awesome...too many conflicts of targets for me....I just watched like a deer in headlights....
Originally posted by chrisp
Bruce, I guess trading for the air to fill at 1103.5 would have been nice as well...
stop at 03.75 on that last one
here is the volume divergence I used to initiate that...$ticks diverged too...not shown here...
Click image for original size
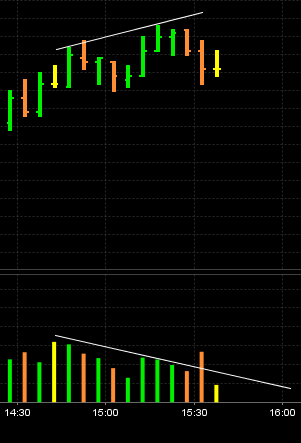
same type of divergence happened on todays lows...!!!
This afternoon's run up is almost exactly as the bounce on 7/23. Only quicker because it's within RTH. Duplicated within ticks.
late posting but....
50% of Globex range 18.75- 88.75 = 3.75
50% of RTH 17.75 - 88.75 = 3.25
61.8% of todays move 13 - 88.75 = 3.75
fwiw
50% of Globex range 18.75- 88.75 = 3.75
50% of RTH 17.75 - 88.75 = 3.25
61.8% of todays move 13 - 88.75 = 3.75
fwiw
Did anyone read about the CSCO halt. Appears the liquidity at the top of the book exhausted and some trades higher were questioned, but eventually let to stand. CSCO ended the day near the low if my screen correct. I'm not sure but the first release I read came about the time of the low today.
Another funny thing today. GS seemed to be the only bullish bank stock I watch. Read several that think it's going higher than today. I don't care but thought it interesting how it acted. Read there is a lockup period after earnings and that's why it's down recently? I'll watch it AM. Any red and it's a warning to me.
I bring these two things up because in the context of Friday, it might matter.
Did you note how the selling pressure lifted at the Europe close but the initial reaction was less than fast? End of month might not matter if they're selling prior to their August holiday period.Will be interesting to see AM before they close tomorrow.
I mention these things as anomolies. I defer to a chart but recognize what I consider could be manipulation, if one believes in such fantasies.
Some fed gov said today he's against anymore monetary support for the economy and the fed has done a good job. Sounds like a nail to me. Hope it's not the last?
Emini Day Trading /
Daily Notes /
Forecast /
Economic Events /
Search /
Terms and Conditions /
Disclaimer /
Books /
Online Books /
Site Map /
Contact /
Privacy Policy /
Links /
About /
Day Trading Forum /
Investment Calculators /
Pivot Point Calculator /
Market Profile Generator /
Fibonacci Calculator /
Mailing List /
Advertise Here /
Articles /
Financial Terms /
Brokers /
Software /
Holidays /
Stock Split Calendar /
Mortgage Calculator /
Donate
Copyright © 2004-2023, MyPivots. All rights reserved.
Copyright © 2004-2023, MyPivots. All rights reserved.