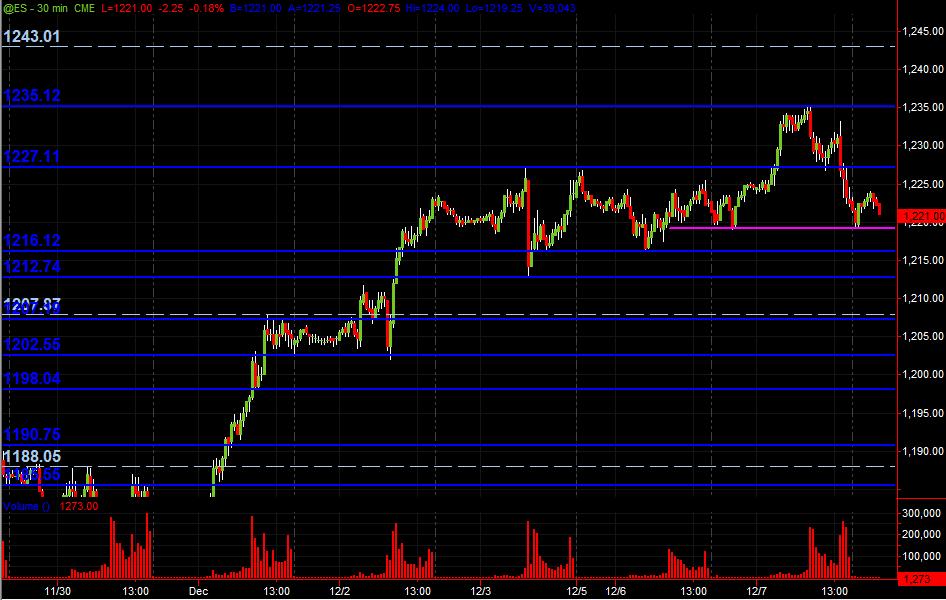
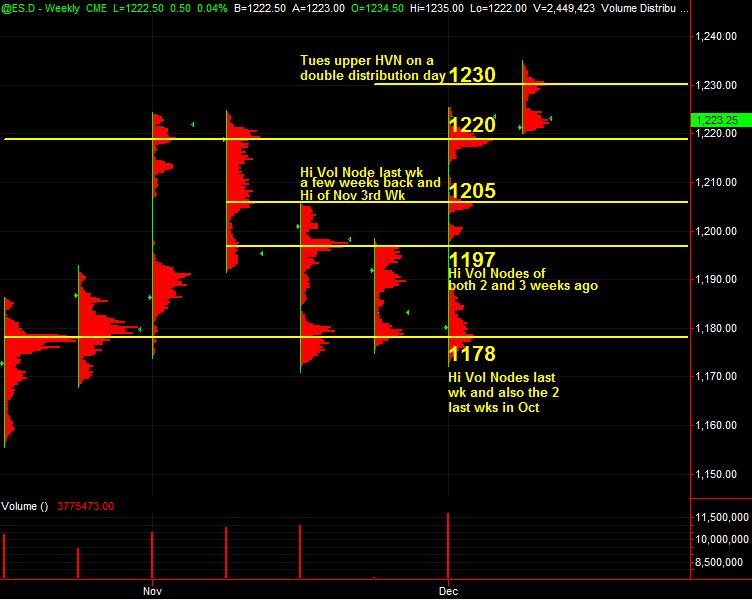
Just to kick off the topic with what I've got on an ES 30-minute chart showing PASR levels in Blue with the light dashed lines being Wkly Pvt levels. Merely a "map" coming into Wednesday's trading. Also, am posting from TradeStation charting, the Weekly Volume at Price HVN price areas from RTH. Not much changes in price levels from last posting of my charts. Hope some folks find this useful!
I1
i1hunter
Rep: 1,730
Posts: 268
If the 1219.00 (Today's low) does not hold then 1212.00 is my objective for now. Some support at 1216.00. ES now trading at 1219.50 -- 23:44
Finding support at 1219.00 will have me targeting at a possible retest of today's high at 1235.00.
Will see, and as always, the market has the last word and in due time will show us the way.
Finding support at 1219.00 will have me targeting at a possible retest of today's high at 1235.00.
Will see, and as always, the market has the last word and in due time will show us the way.
BR
BruceM
Rep: 216,211
Posts: 19,895
I'm using 27 - 28 as resistence ( triples up there too) , 1222. 75 becuse it was a key number on Monday and overnight has traded through it and 1216 - 17....somebody is really protecting that so far from declines
BR
BruceM
Rep: 216,211
Posts: 19,895
staring small shorts at 26.25 now...I don't want market spending too much time above 29 this morning..taget is gap fill.. but 24.75 to tighten
KO
koolblue
Rep: 48,651
Posts: 16,032
Thanks guys... after a fantastic nov, ive cooled off in dec, misgaging how far this puppy would run, but nailed the 1171 low for a nice spy options long. now looking for higher basically into jan? Then the usual seasonal decline into feb.... we'll see!...short scalp attempt right here...