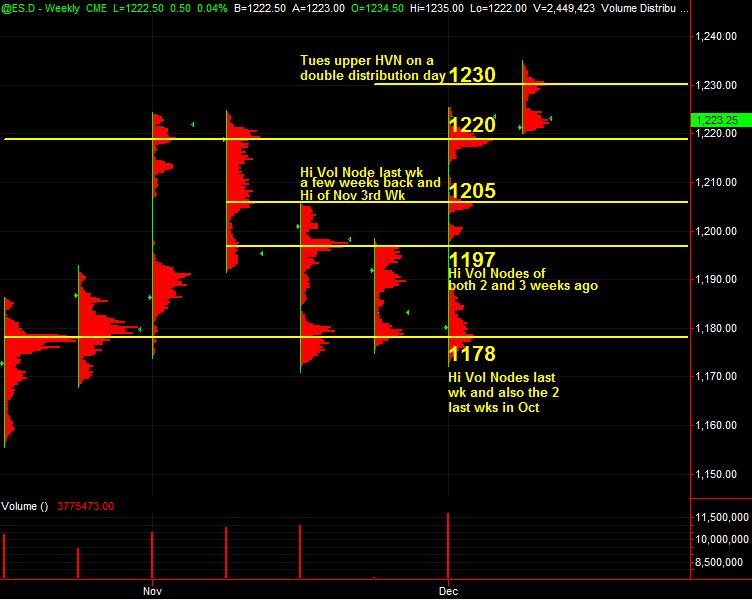
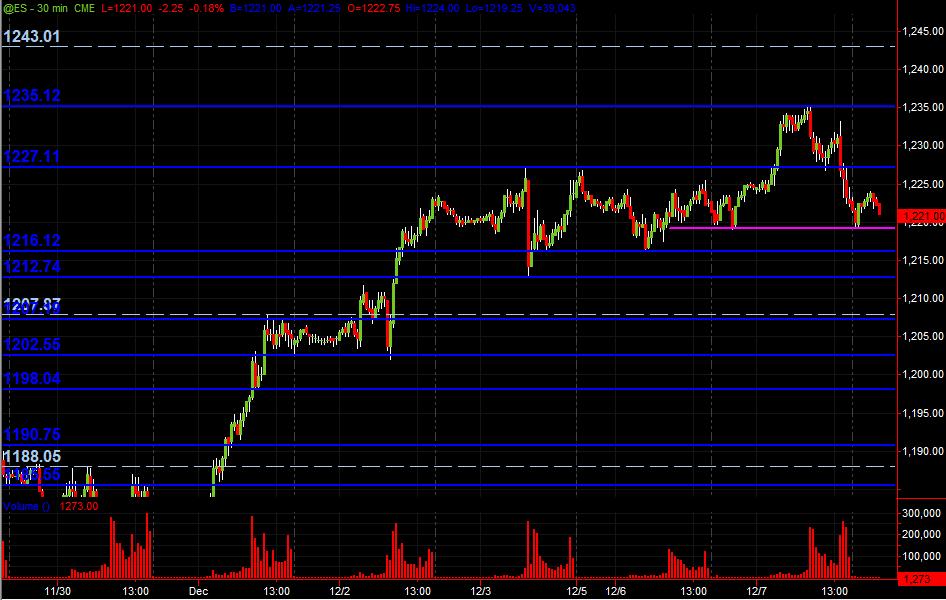
Just to kick off the topic with what I've got on an ES 30-minute chart showing PASR levels in Blue with the light dashed lines being Wkly Pvt levels. Merely a "map" coming into Wednesday's trading. Also, am posting from TradeStation charting, the Weekly Volume at Price HVN price areas from RTH. Not much changes in price levels from last posting of my charts. Hope some folks find this useful!
Click image for original size
Click image for original size