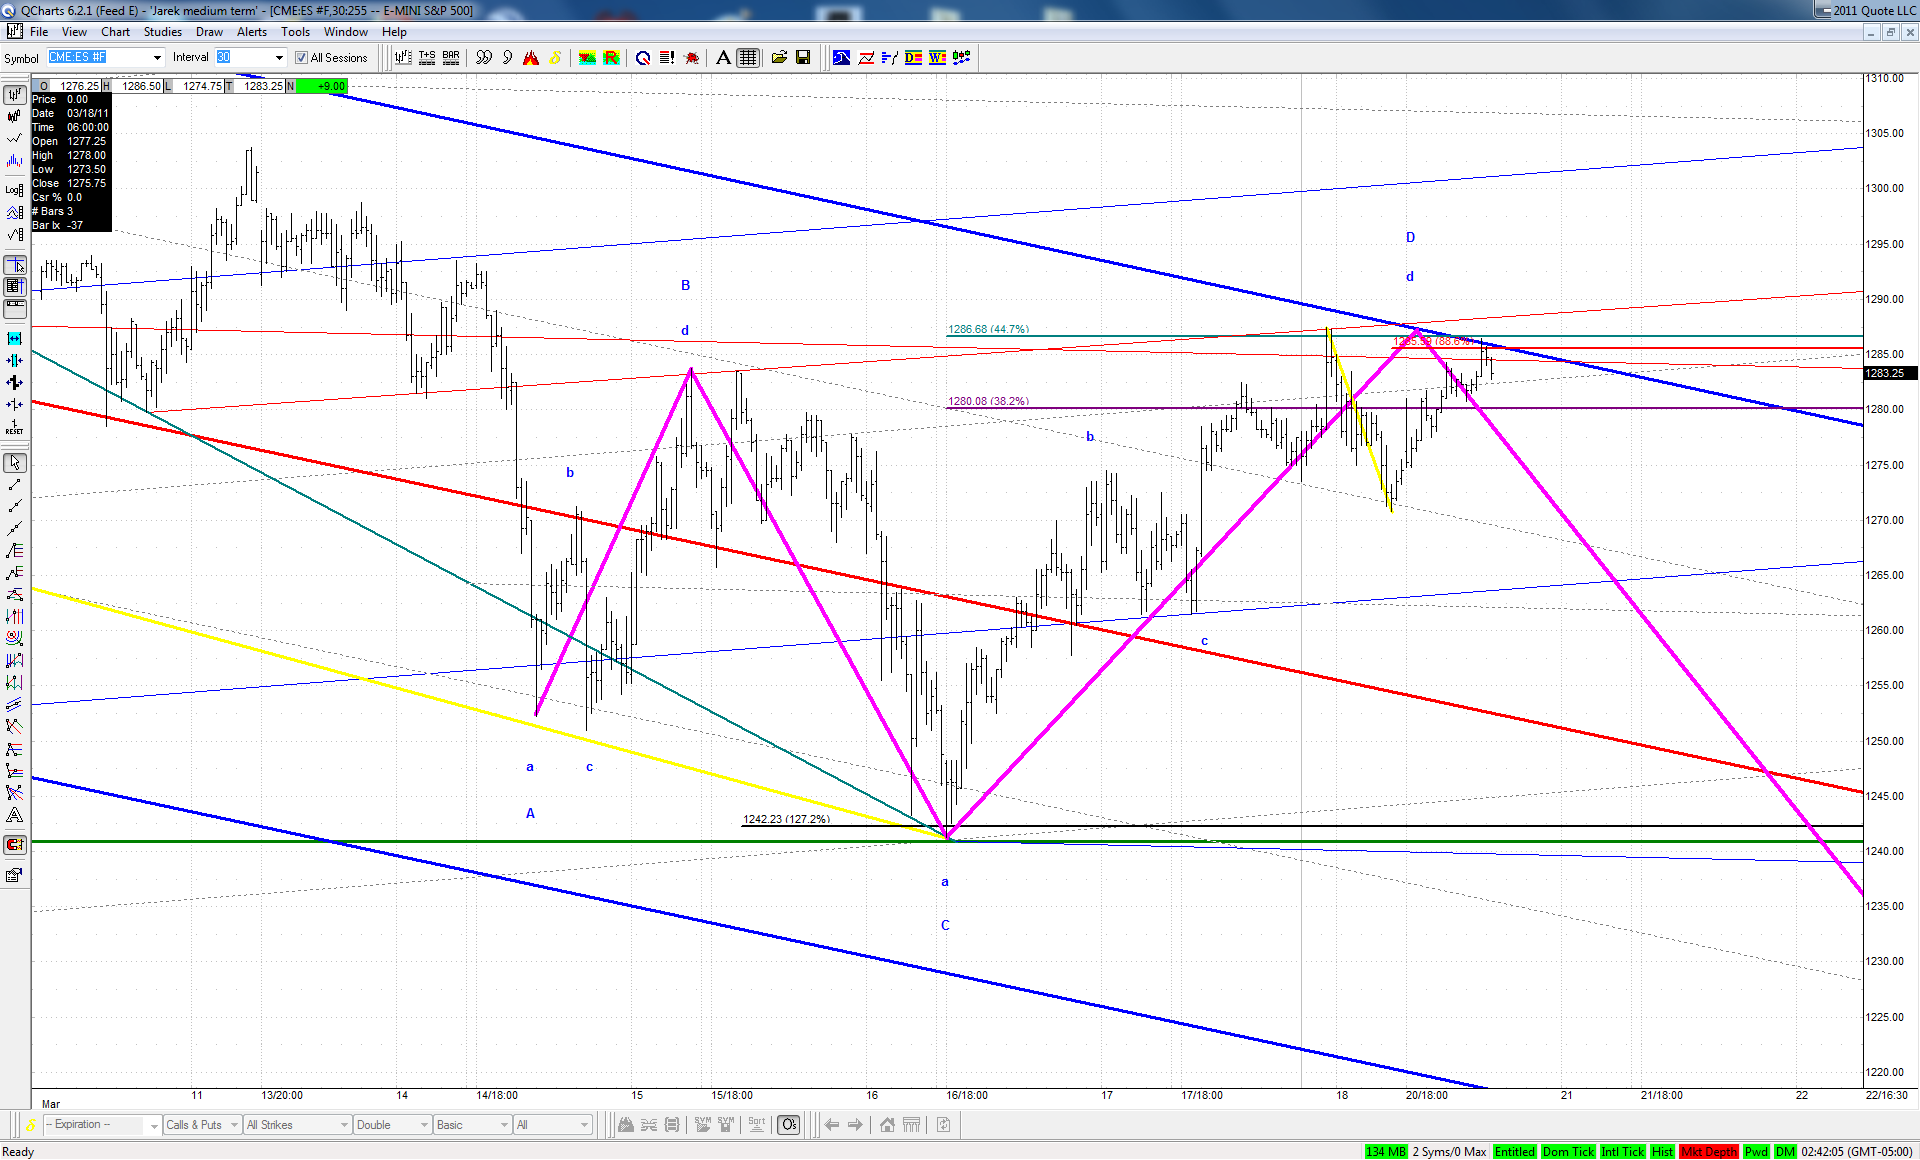
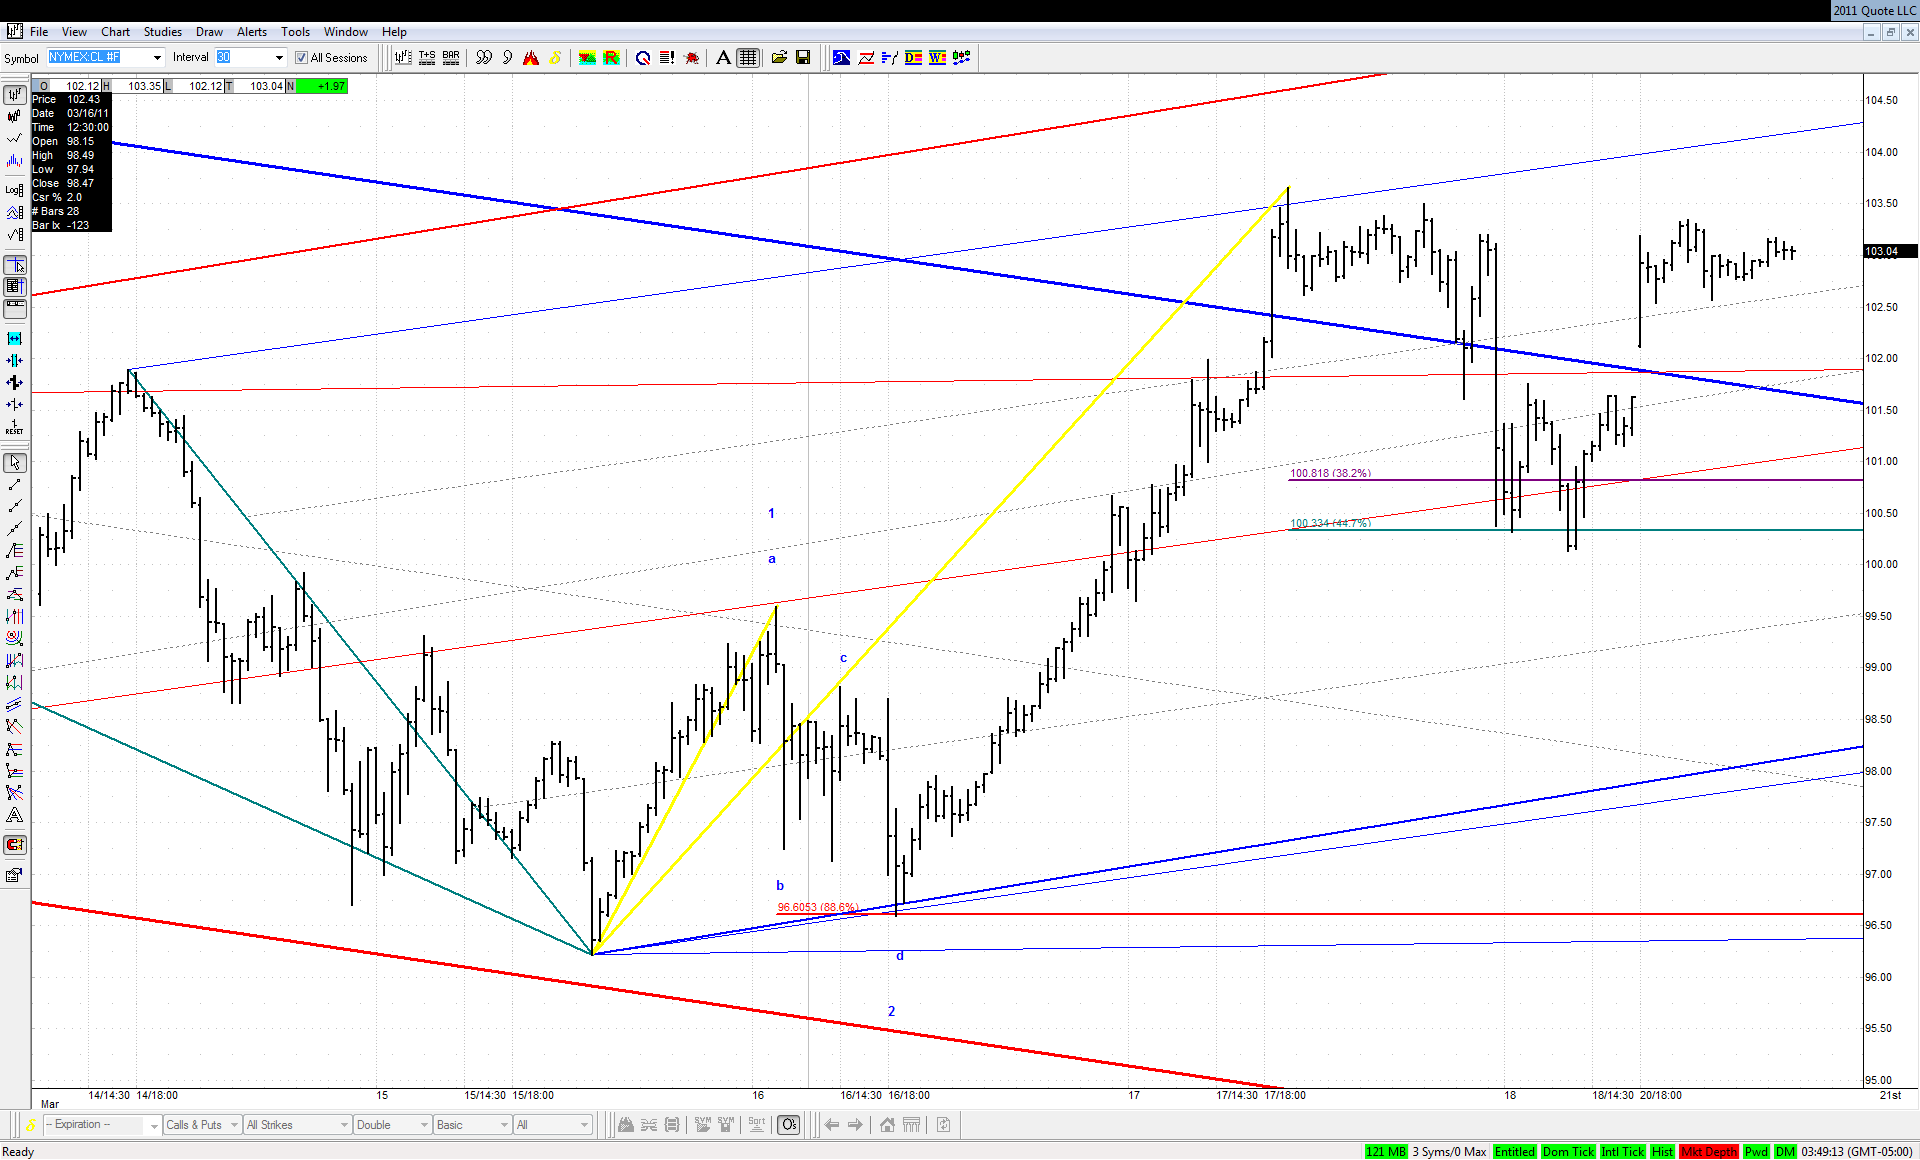
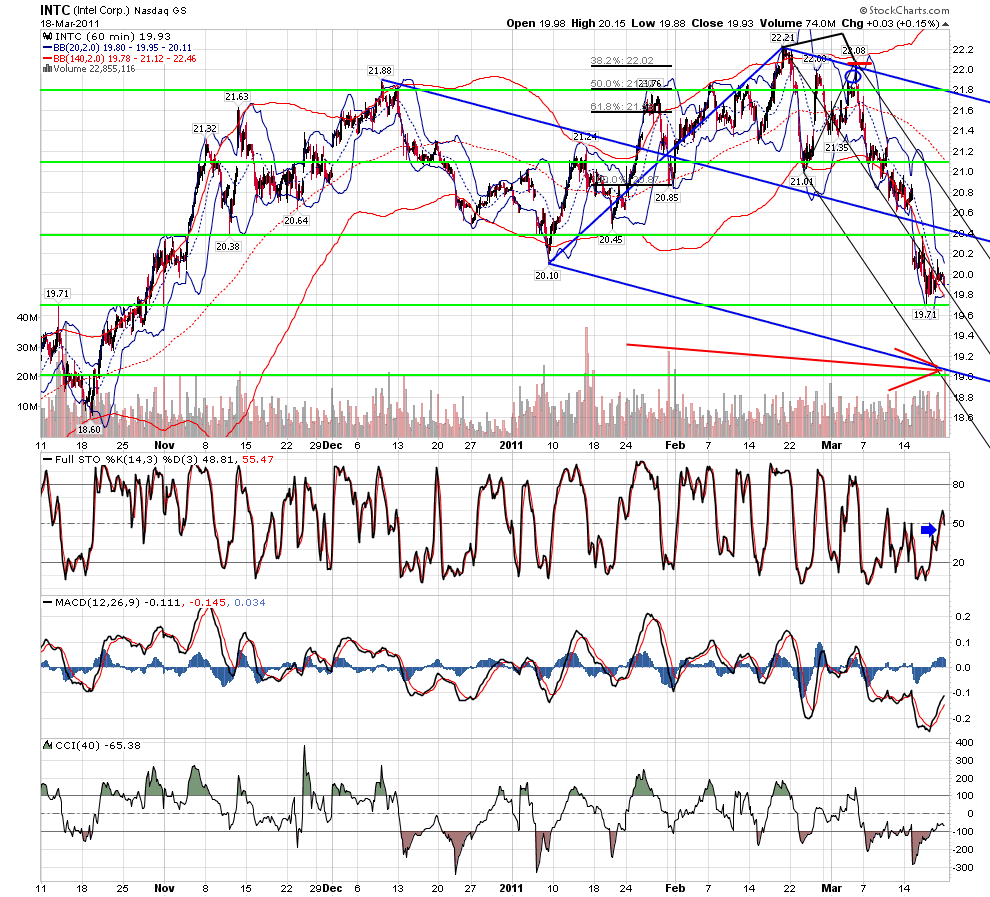
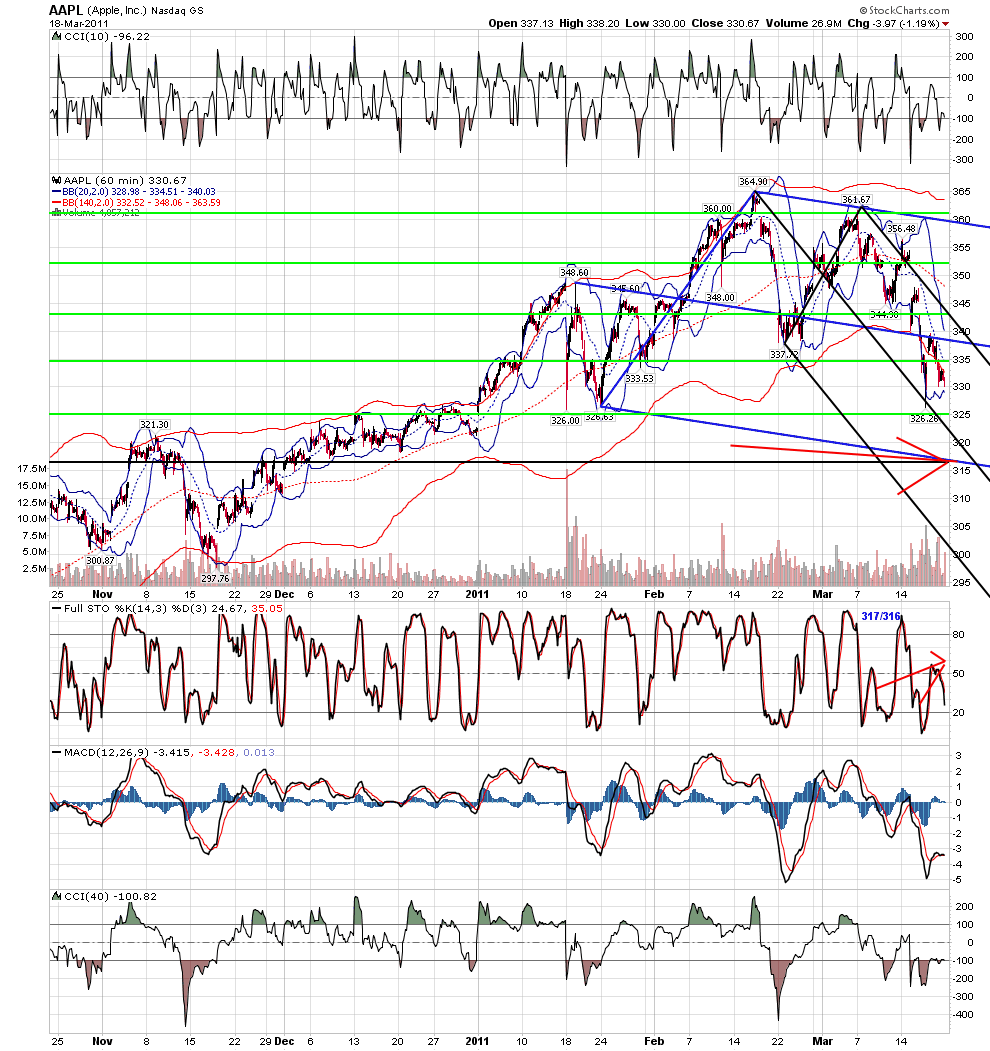
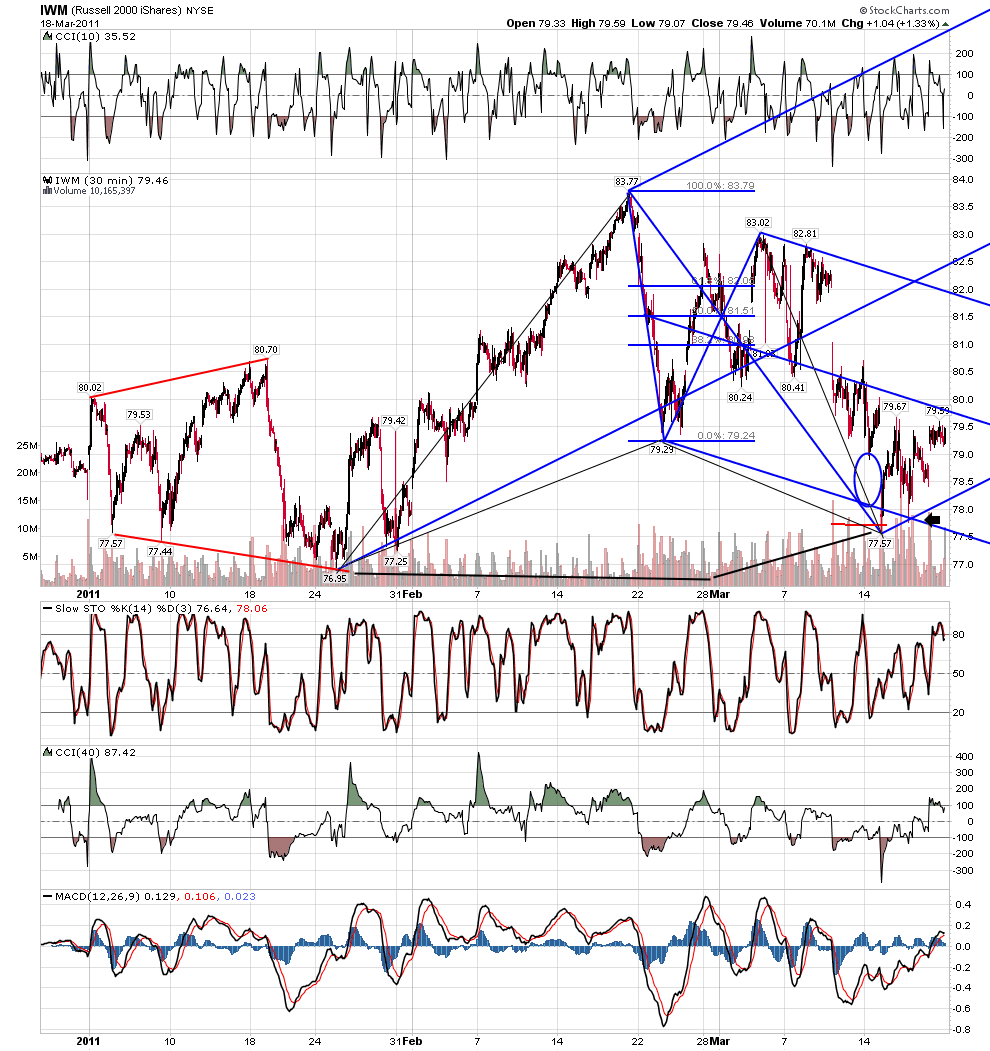
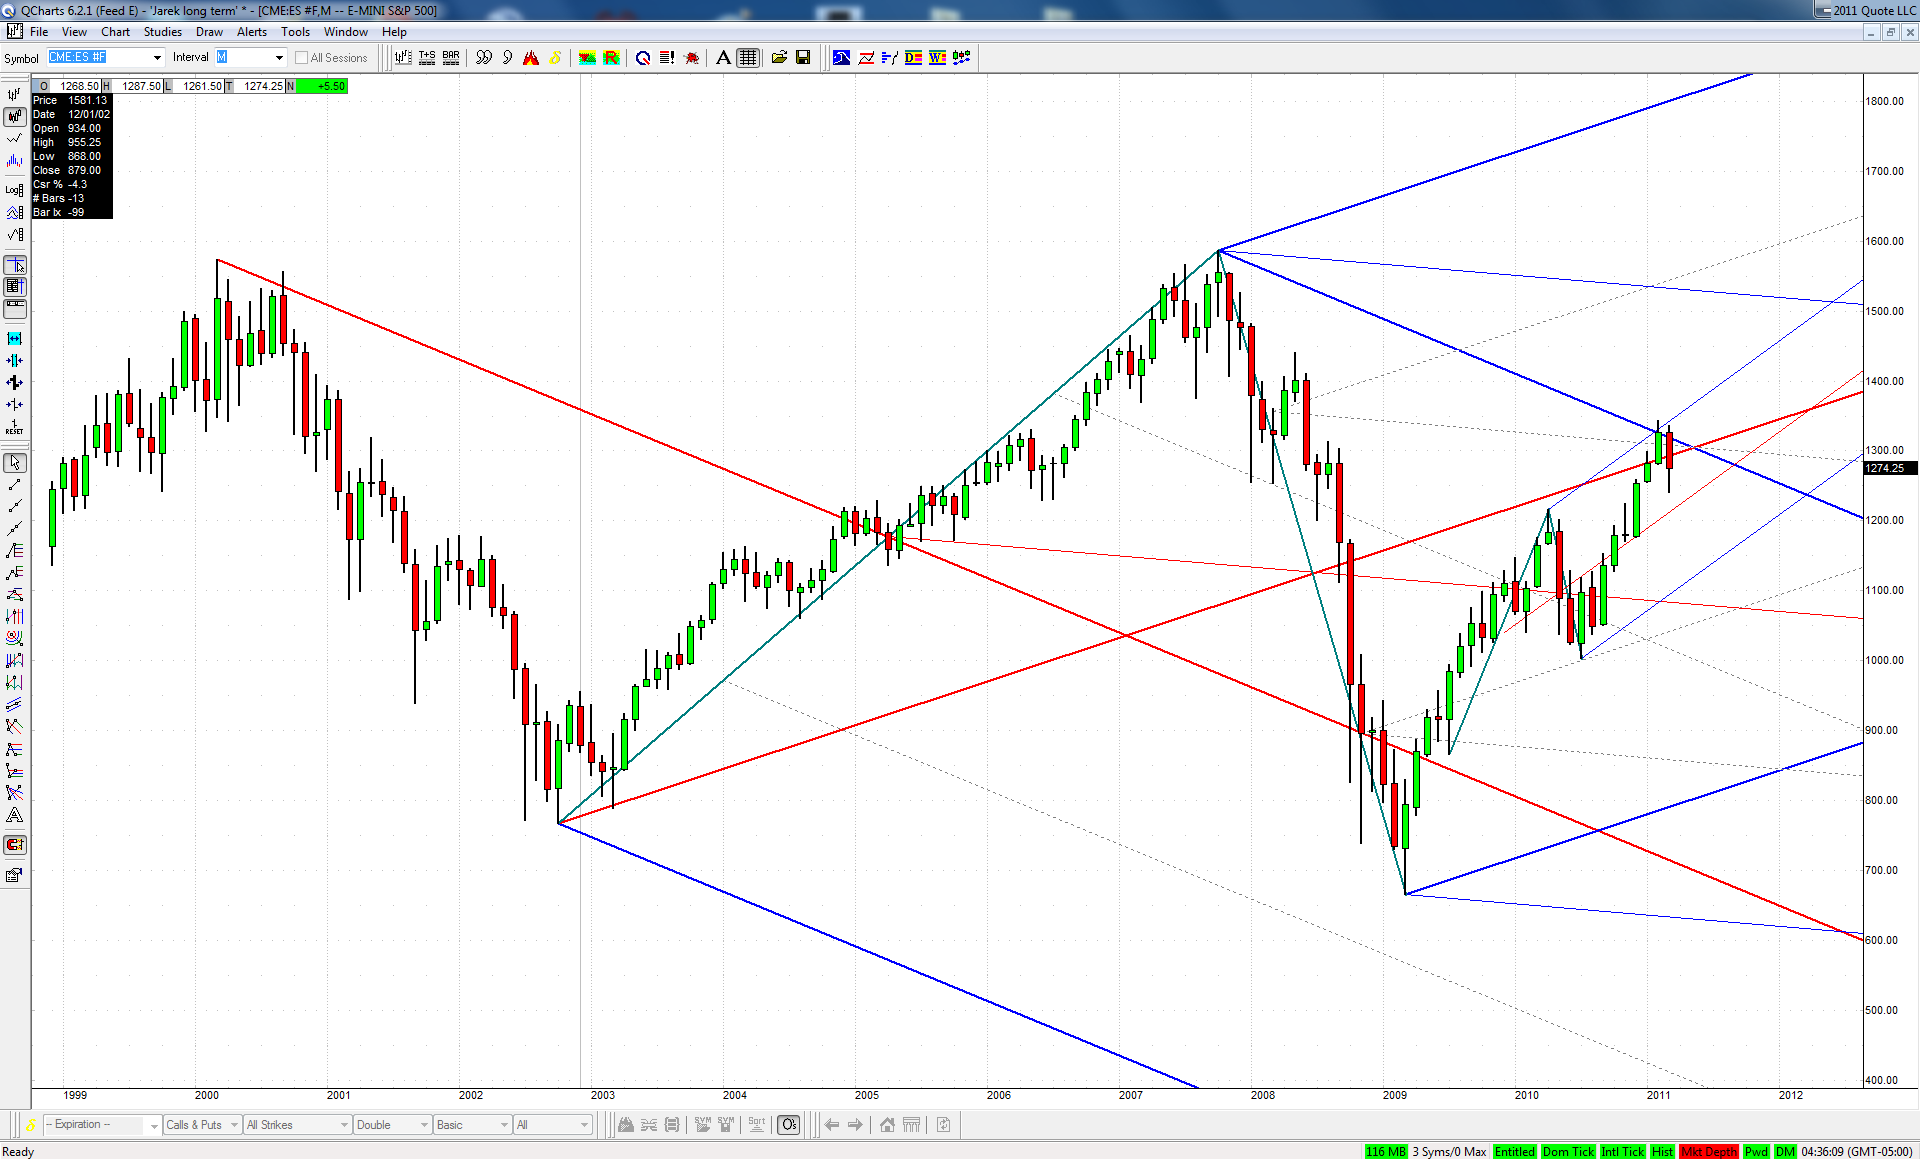
Can the recent high in February stay with us for quite longer than almost everybody is expecting at this point?
We may not know the answer to this question for some time to come, but in my opinion this is a viable alternative to consider!
JA
jarek
Rep: 94
Posts: 3,474
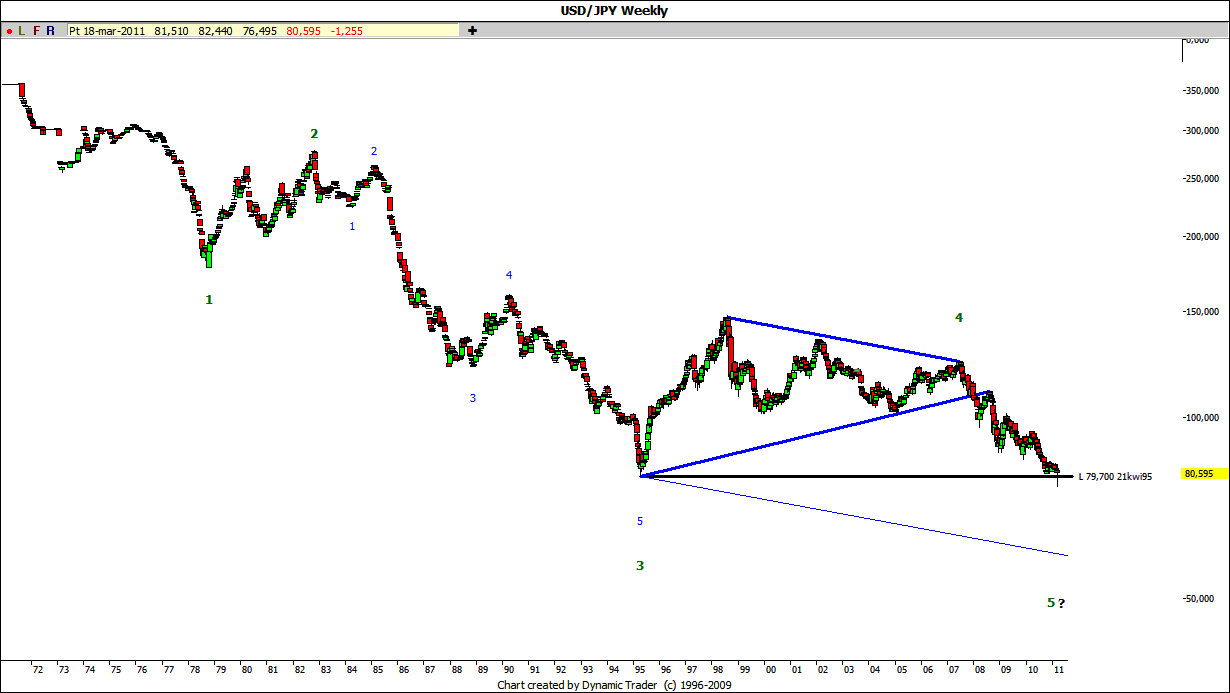
Last developments in JPY reminded me a chart from my old Elliott times, which I last saw couple of years ago:
I recall being sure then, that the count simply couldn't be correct. My thinking was: "How can a currency of such indebted nation strengthen so much that 1979 low would be taken out and yet alone the target for the move off the W4 triangle could be met?" I'm not so sure now...
TX
tx_ches
Rep: -10
Posts: 514
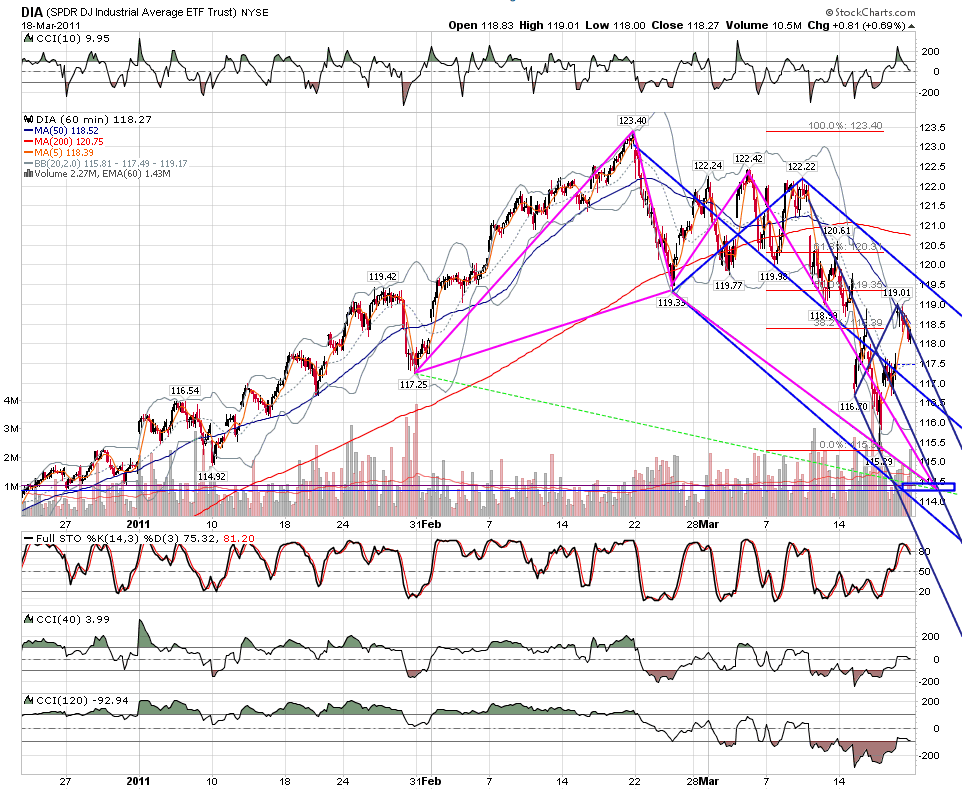
My spreadsheet came up with the same results as you have, if that is what you are asking in regards to the 114.42 to 114.29 range.
Originally posted by rat89
someone please correct me if I'm not applying this correctly....
117.25 > 123.40 = 114.42 @ 1.46
119.33 > 122.42 = 114.33 @ 2.618
115.29 > 119.01 = 114.29 @ 1.27 of last swing
seems as though there is a 13¢ target in the blue box?
TX
tx_ches
Rep: -10
Posts: 514
If you go lower and do the retrace from 114.92 to the high, you get 114.39 at 1.063.
RA
rat89
Rep: 0
Posts: 7,015
thanks tx
Originally posted by tx_ches
If you go lower and do the retrace from 114.92 to the high, you get 114.39 at 1.063.