I saw a potential teaching moment here, so I thought I'd post. I'm a bit reluctant, though, since I've been through so much 'out there', I'm gunshy as can be, even in my own forum, where no one really acts badly. Still, I want to look at an example joed posted in his blog today. If I had even a lick of sense I would choose my own examples, and stay as far from anyone else's posts as possible. This way, there can't be any reason why anyone would get upset about my post.
I'm only going down this route because I don't have any examples ready at hand, I saw something here I thought was worth mentioning,
and that's it. I figure if I can't even look at the same examples as joed, then something is wrong with this forum, too, and I'll just shut it down. Point is, no one slam me because I'm trying to add value to a post he made.
And yes, I'm real gunshy right now.
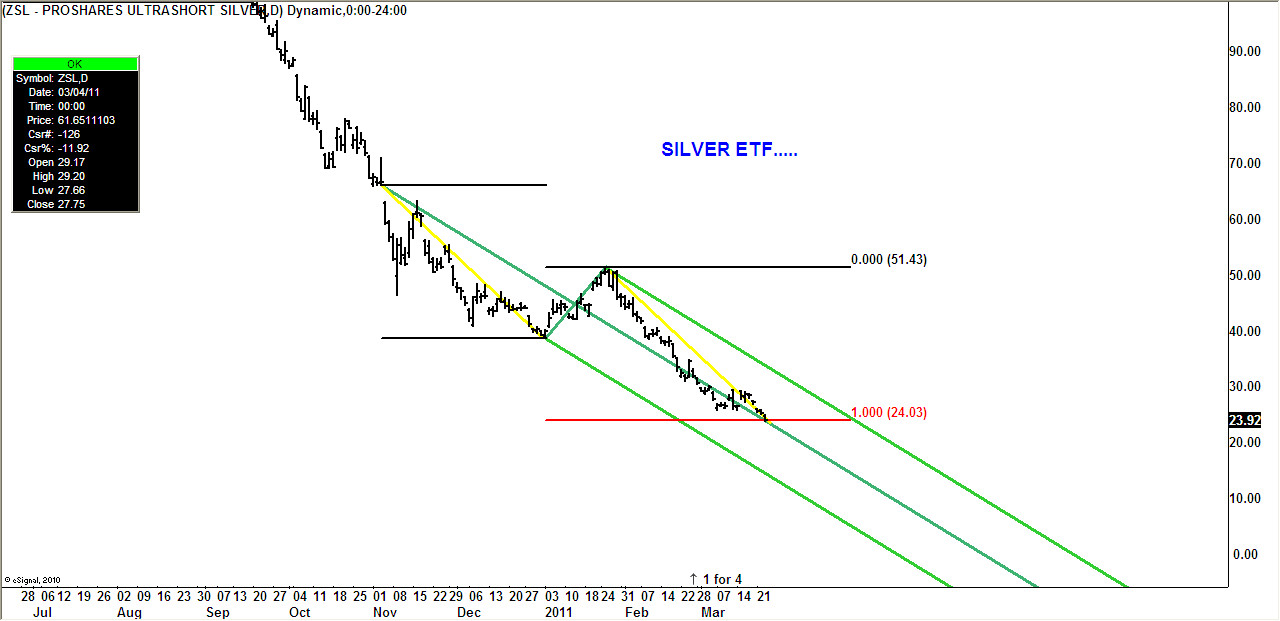
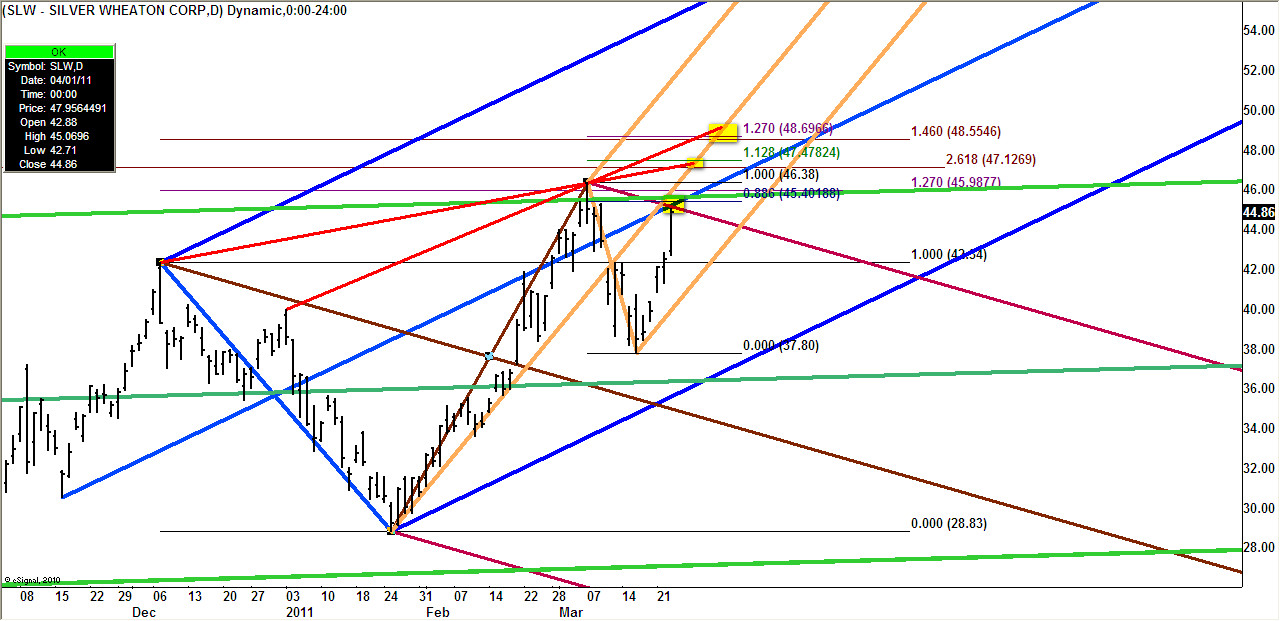
Look at SLW. That is a spectacular confluence there, and I have at least one more really perfect line, an .886, and some other things there. It also got there with a really strong, 'overdone', potentially exhaustive move. But, when I looked over my work, I can't help but feel it is drawn to the obvious SL. If this takes some time (it's acting like it won't take much time), there is this amazing confluence of a 1.460 and a 1.272 with that line, around 48.55-48.70.
Above that is another tight confluence around 50.30-50.68. Unless it took a lot of time, both would be overthrows of the SL. There is, though, a second SL that hits that 48.55-48.70 confluence, and hits it best around Monday. If it shot straight up tomorrow the SL lines up with a 1.128 around the low to mid-47 level.
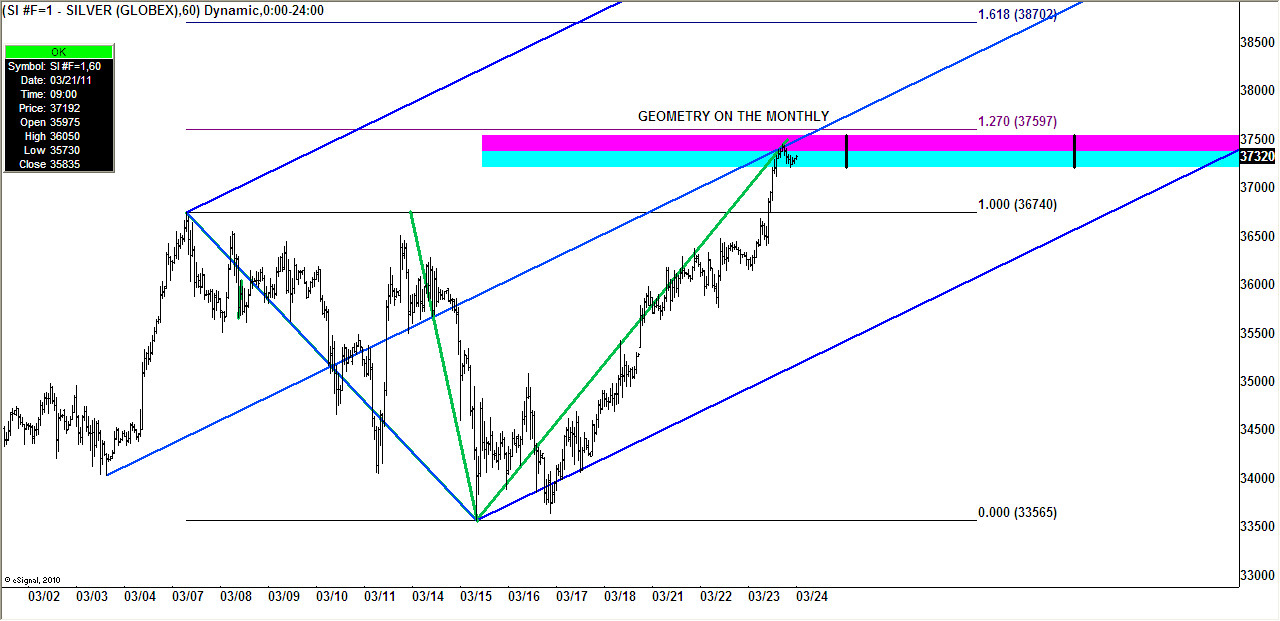
So, how is the silver futures contract situated? Well, start with Eric's fine work from today on that. Silver just hit almost to the 1.272 off that last ABCD, at a new high for the entire bull, and did it with vigor. It surely could back off in here with ease. It also could keep spurting up, given the frenzy. There's a SL above, and that would line up with the higher area(s) for SLW. Perhaps it sees joed's incredible confluence and backs off strongly from that, and then comes in to a KZ at line(s), and then heads up to the higher areas.
All I can say is, this SL above is calling out to this big time, and although I'd pretty much never bet against anything joed said, when I see this scenario in the ES it almost always reaches the SL. I thought this one would be great for everyone to do their own workup on, and follow along. If it goes up, think how you would manage this one off that 3/16 low, like you hit it there. If it backs off, think how you would manage it if you were long, again, off that 3/16 low. If you want, think how you would manage it on the short side, and what areas would concern you as it goes down. This one is a golden opportunity for learning in my opinion, so I wanted to get it out there so people can do some work on it.
Now I just sit back, wincing, hoping no one slams me because I used a joed post...