MyPivots
Sign In
JA
jarek
Rep: 94
Posts: 3,474
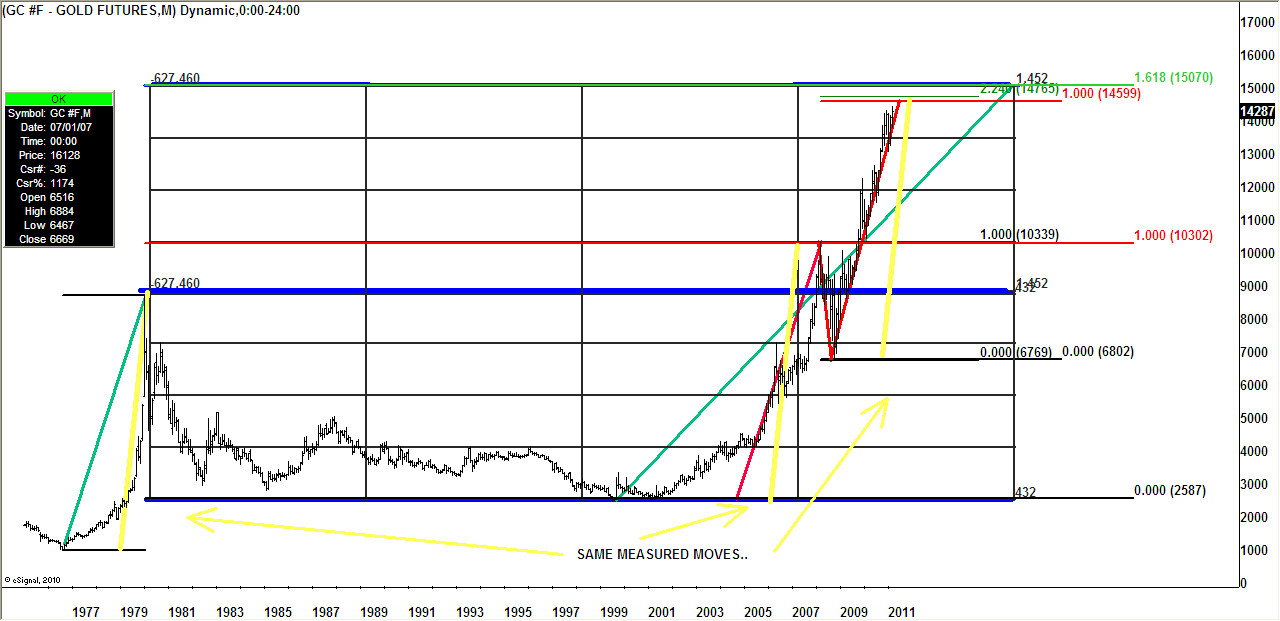
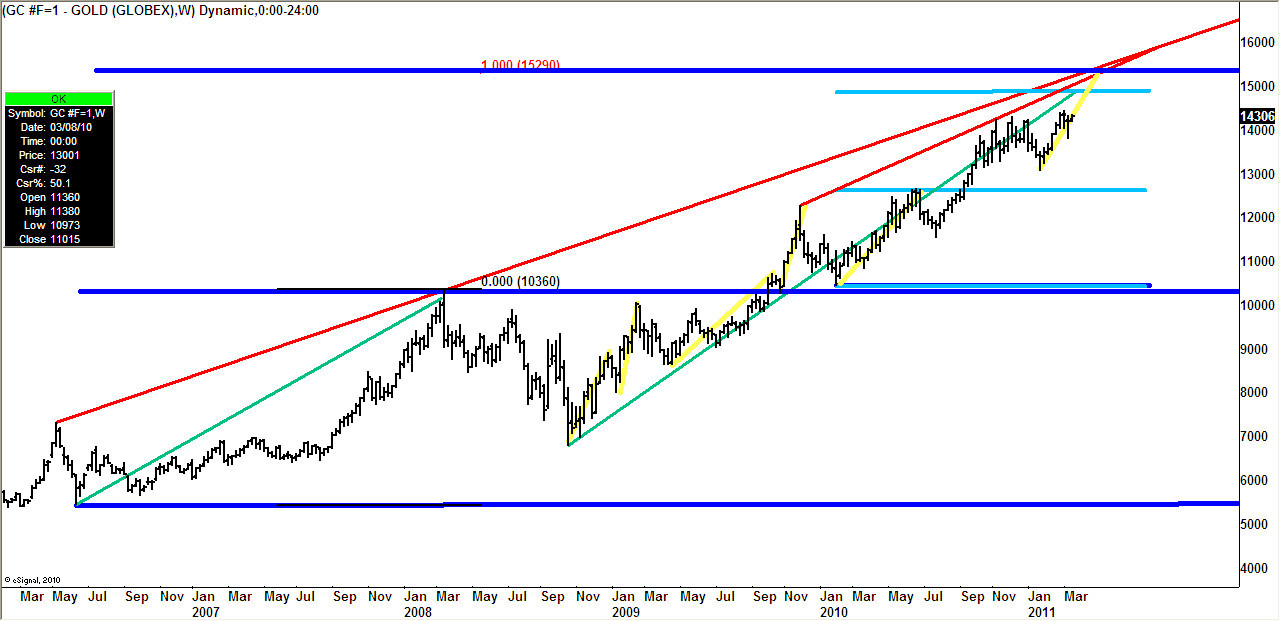
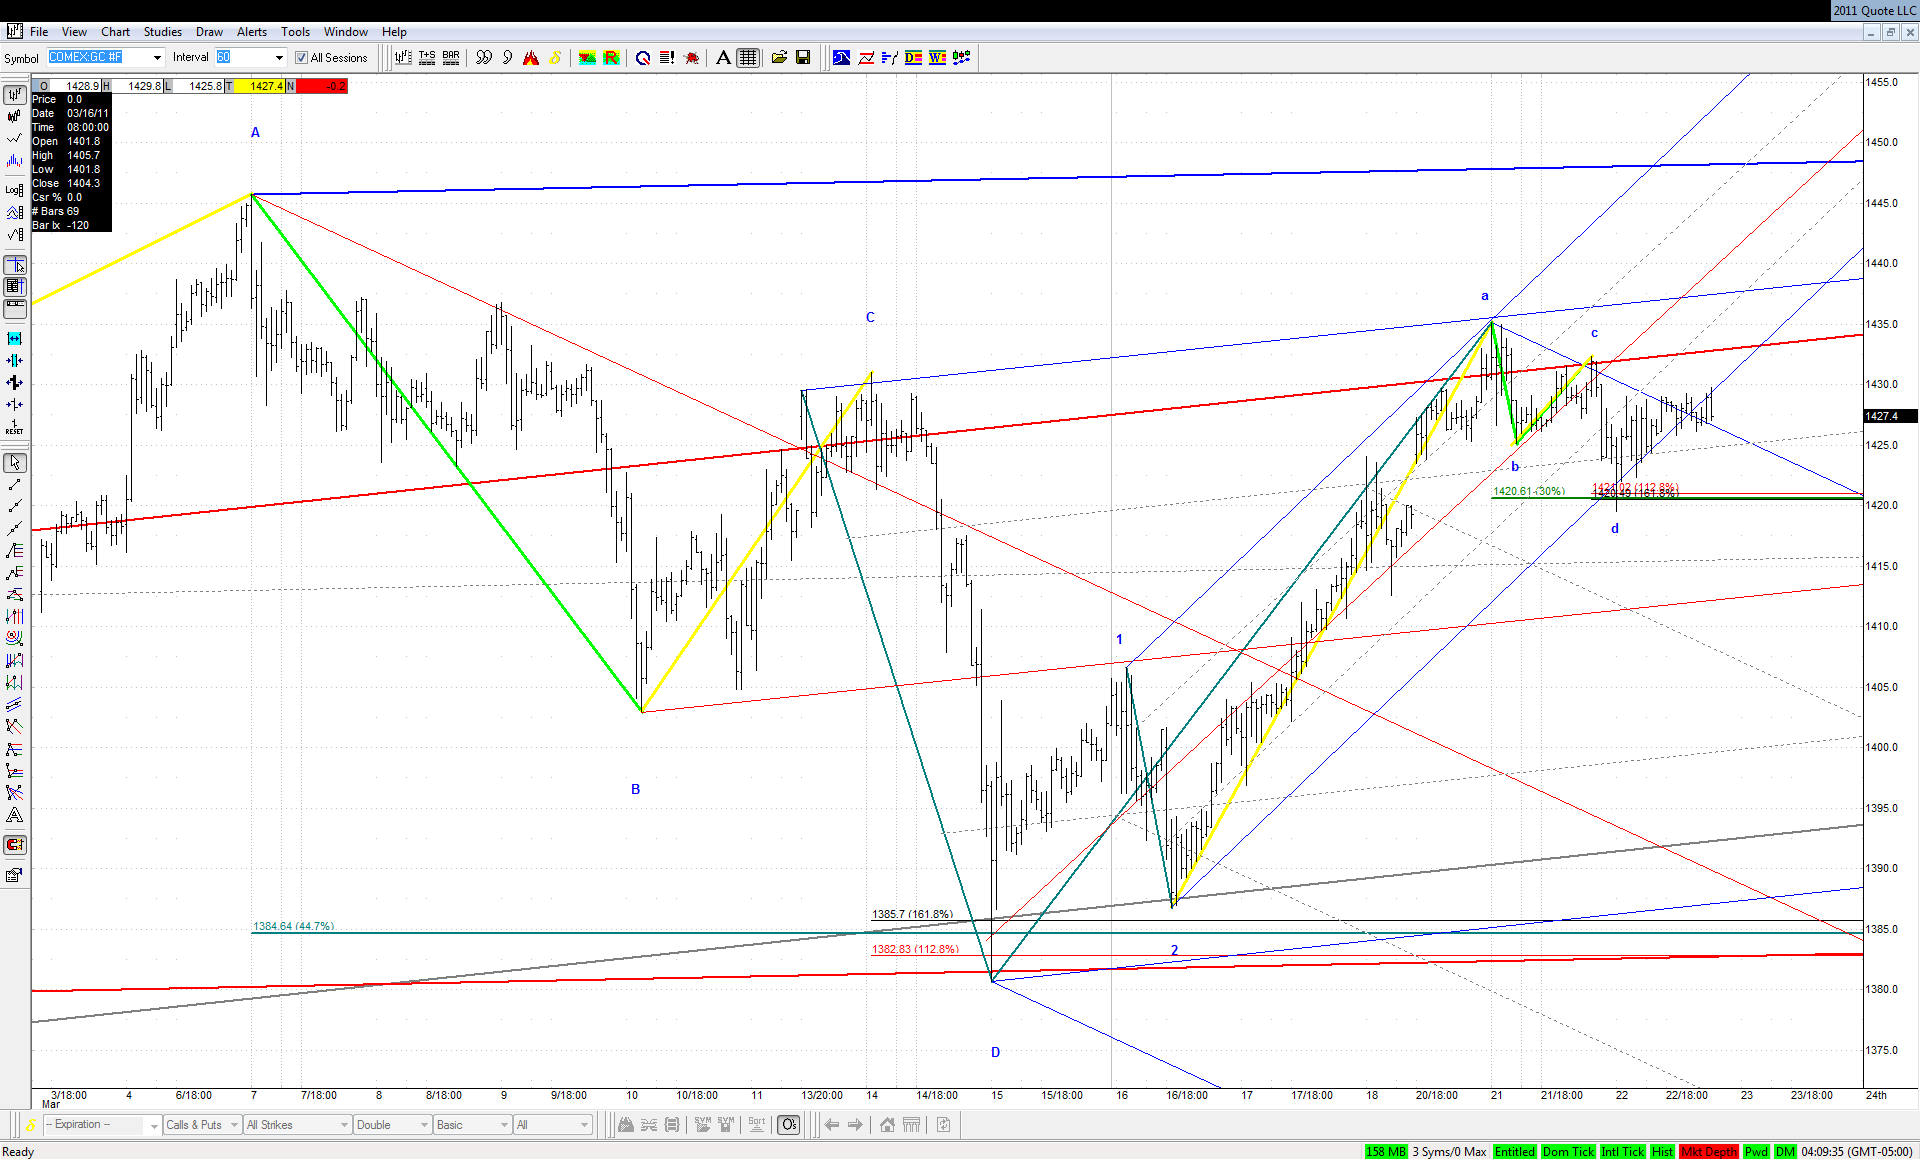
Can the recent high in February stay with us for quite longer than almost everybody is expecting at this point?

Click image for original size
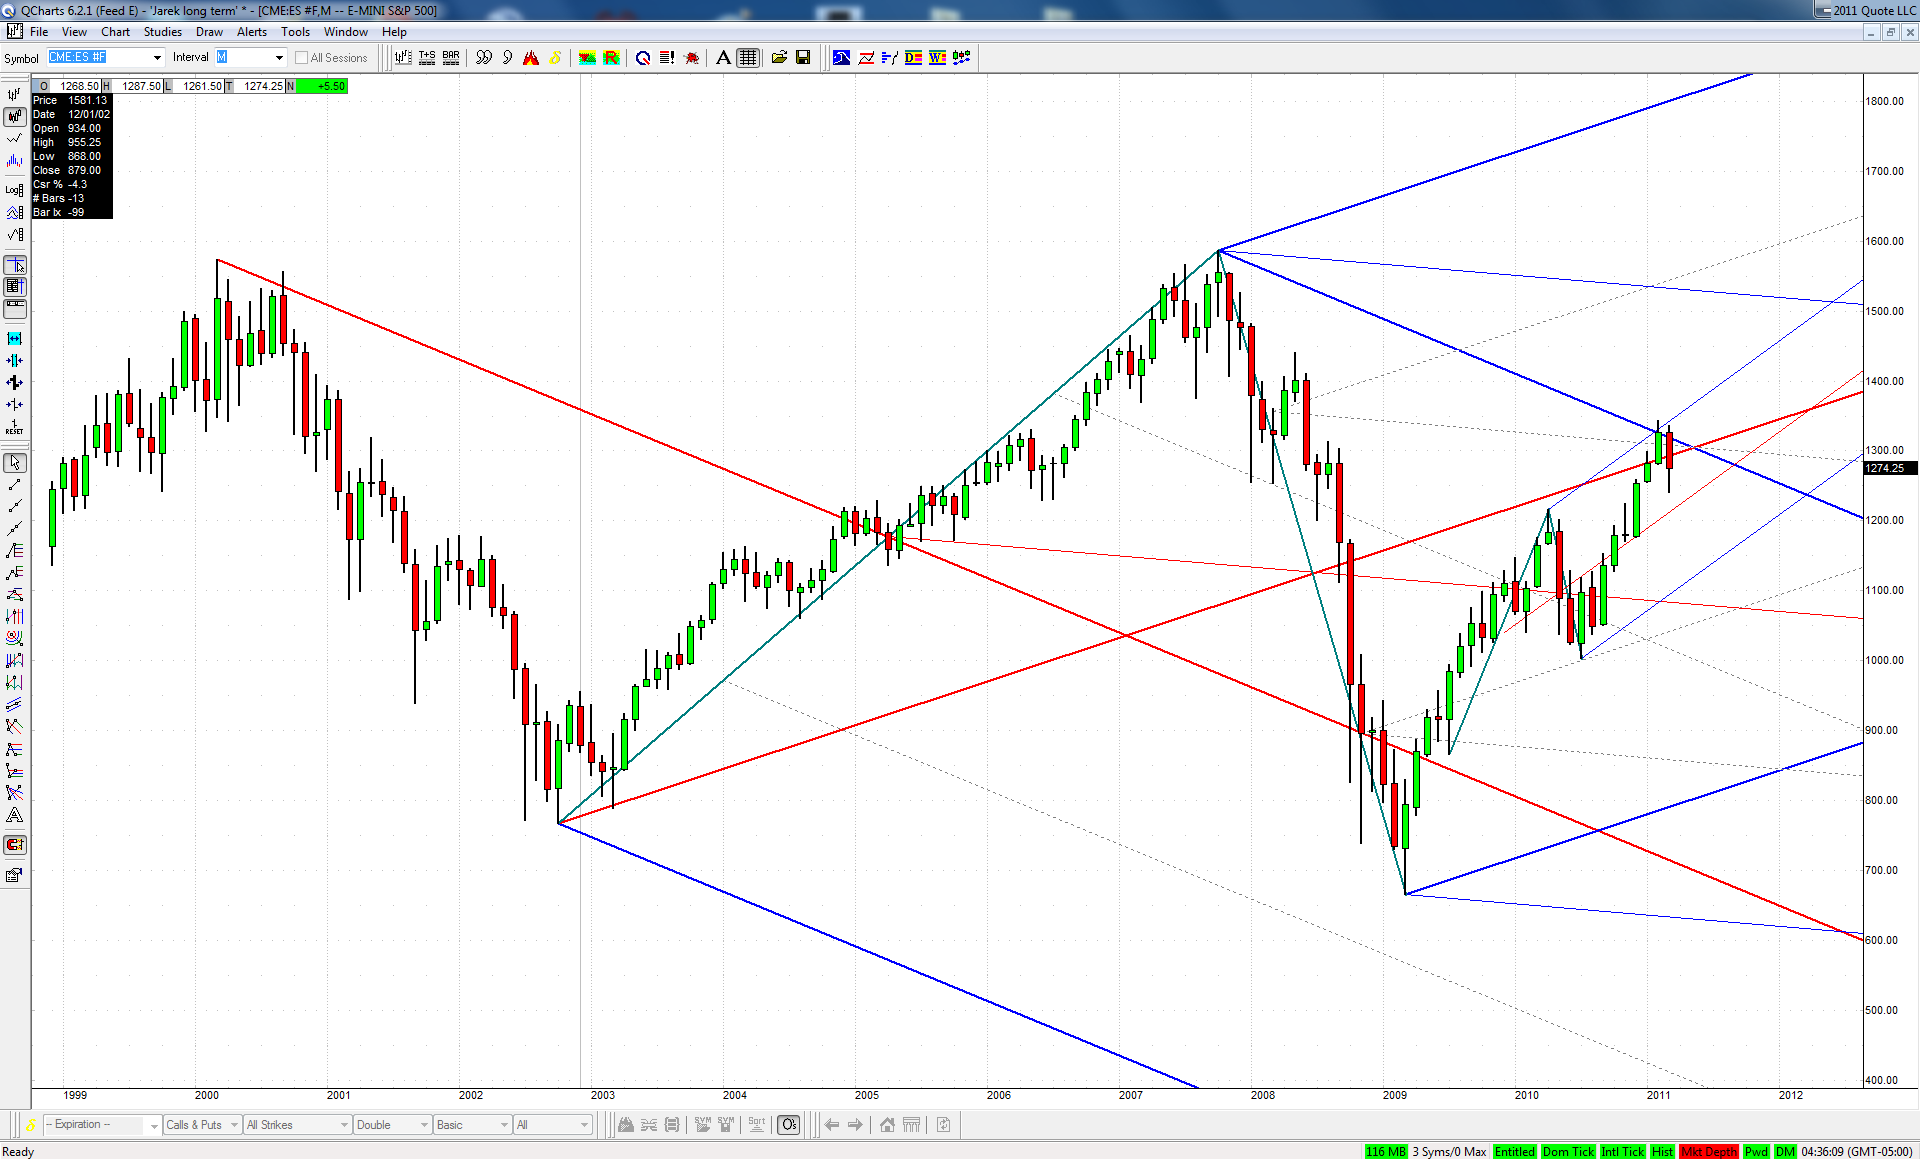

We may not know the answer to this question for some time to come, but in my opinion this is a viable alternative to consider!
JA
jarek
Rep: 94
Posts: 3,474
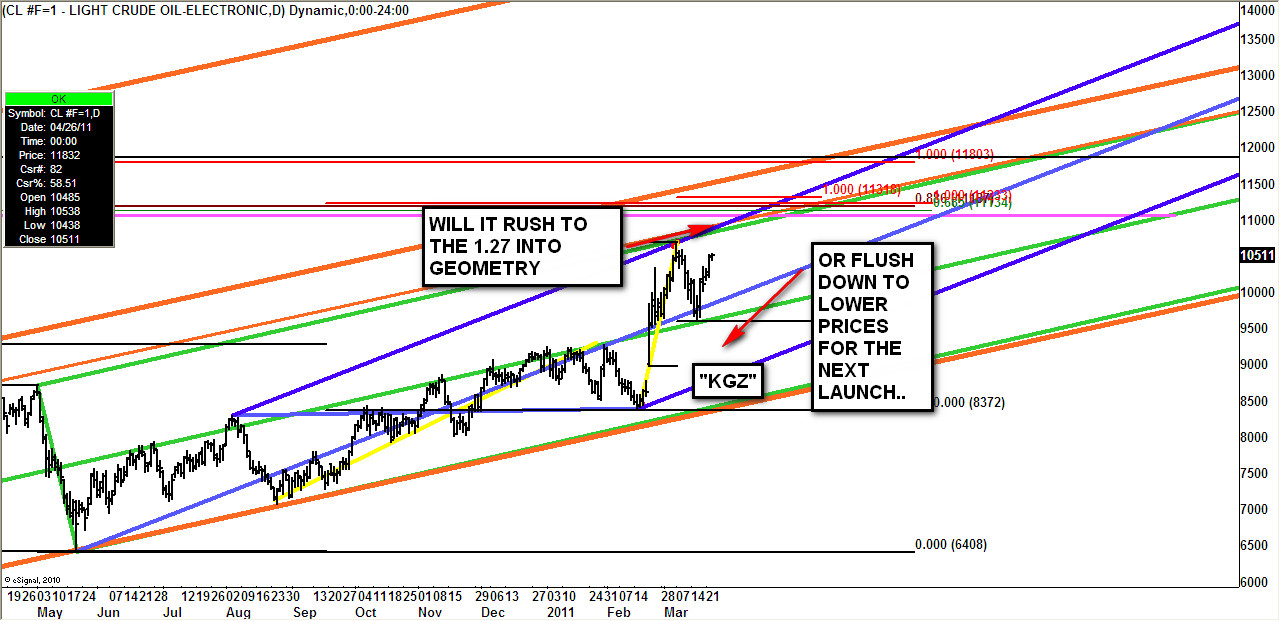
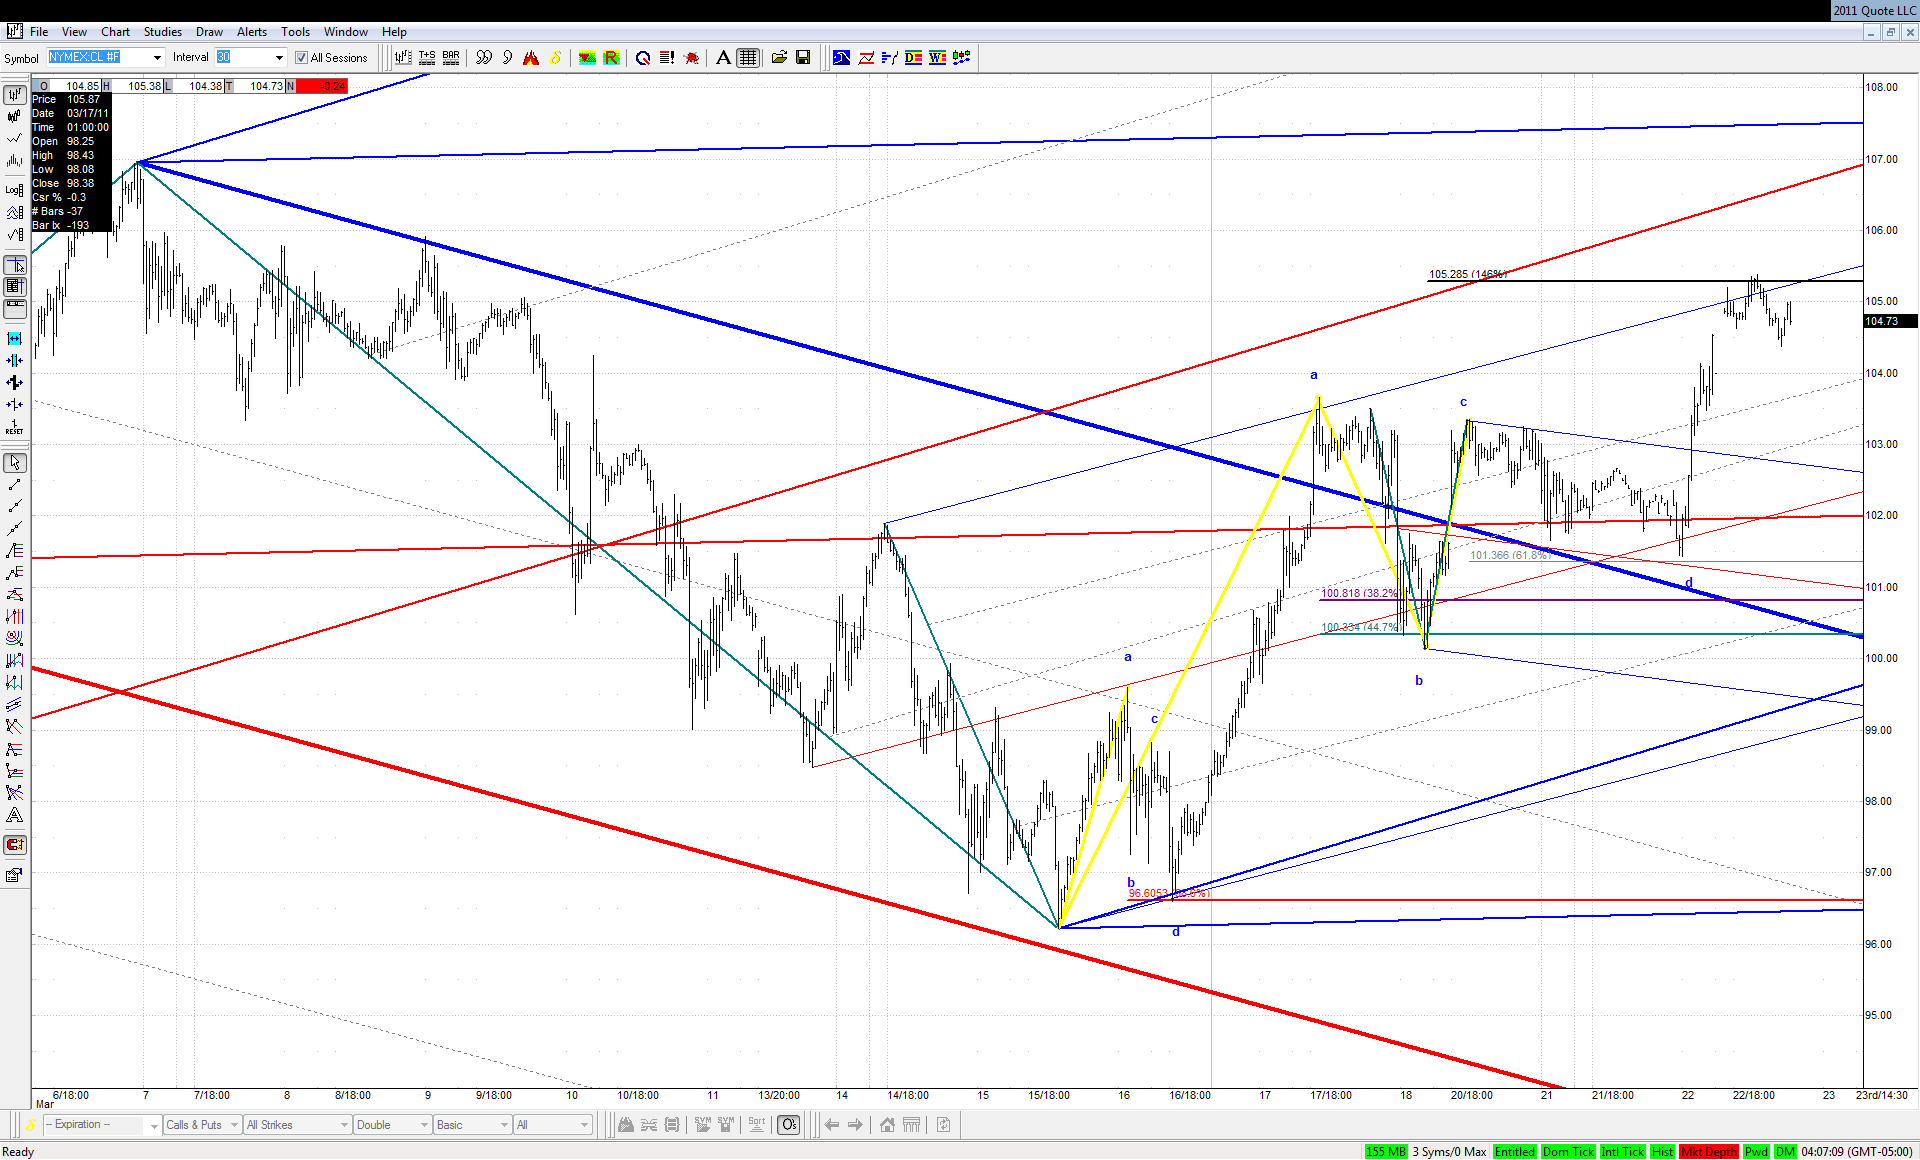
If this last bullish ABCD in Crude was a W4, then recent high should last for some time since 1.460 at line was already hit:

Click image for original size
JA
jarek
Rep: 94
Posts: 3,474
Originally posted by jarek

...Lets see how it reacts to bullish ABCDs forming on the way down
Initial reaction was positive but this clear TL creep is a warning sign for bulls:

Click image for original size
JA
jarek
Rep: 94
Posts: 3,474
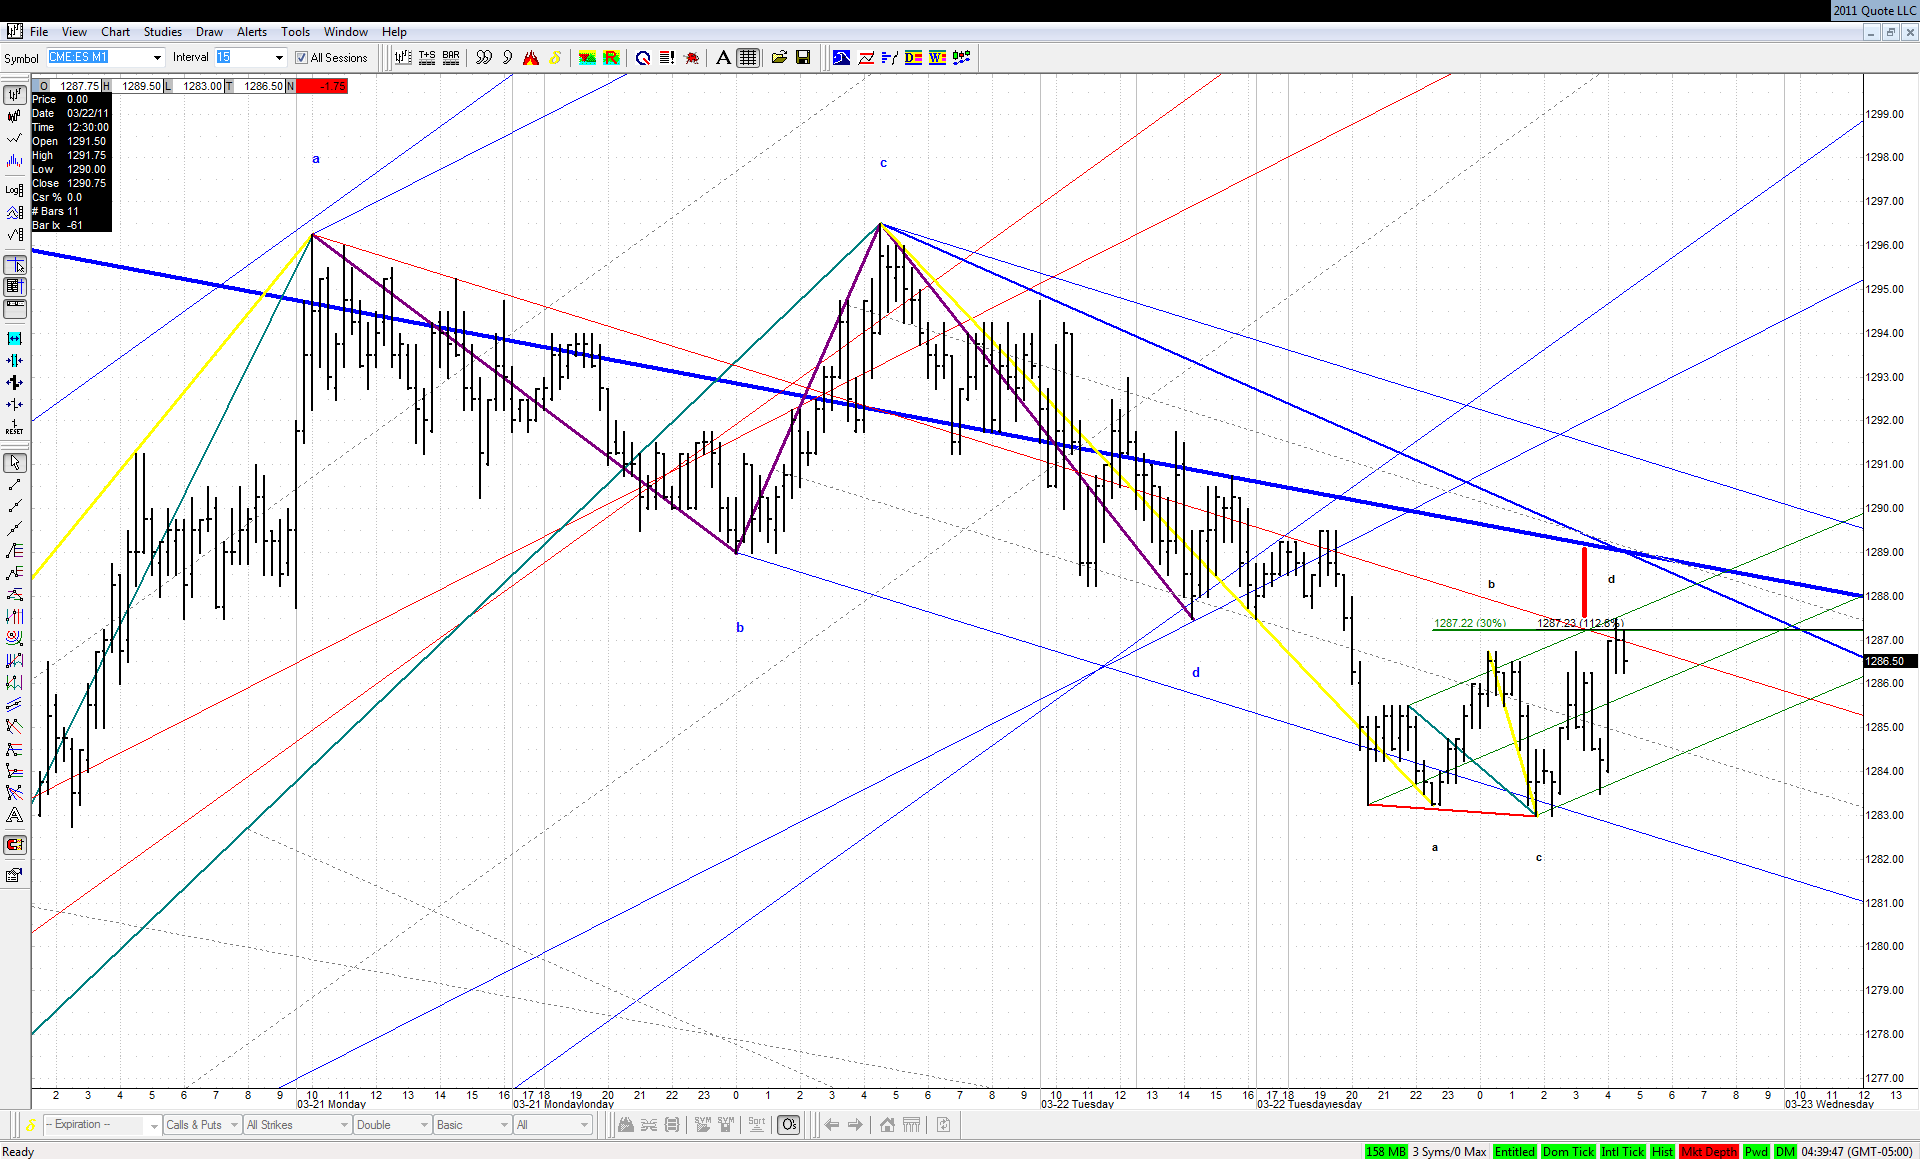
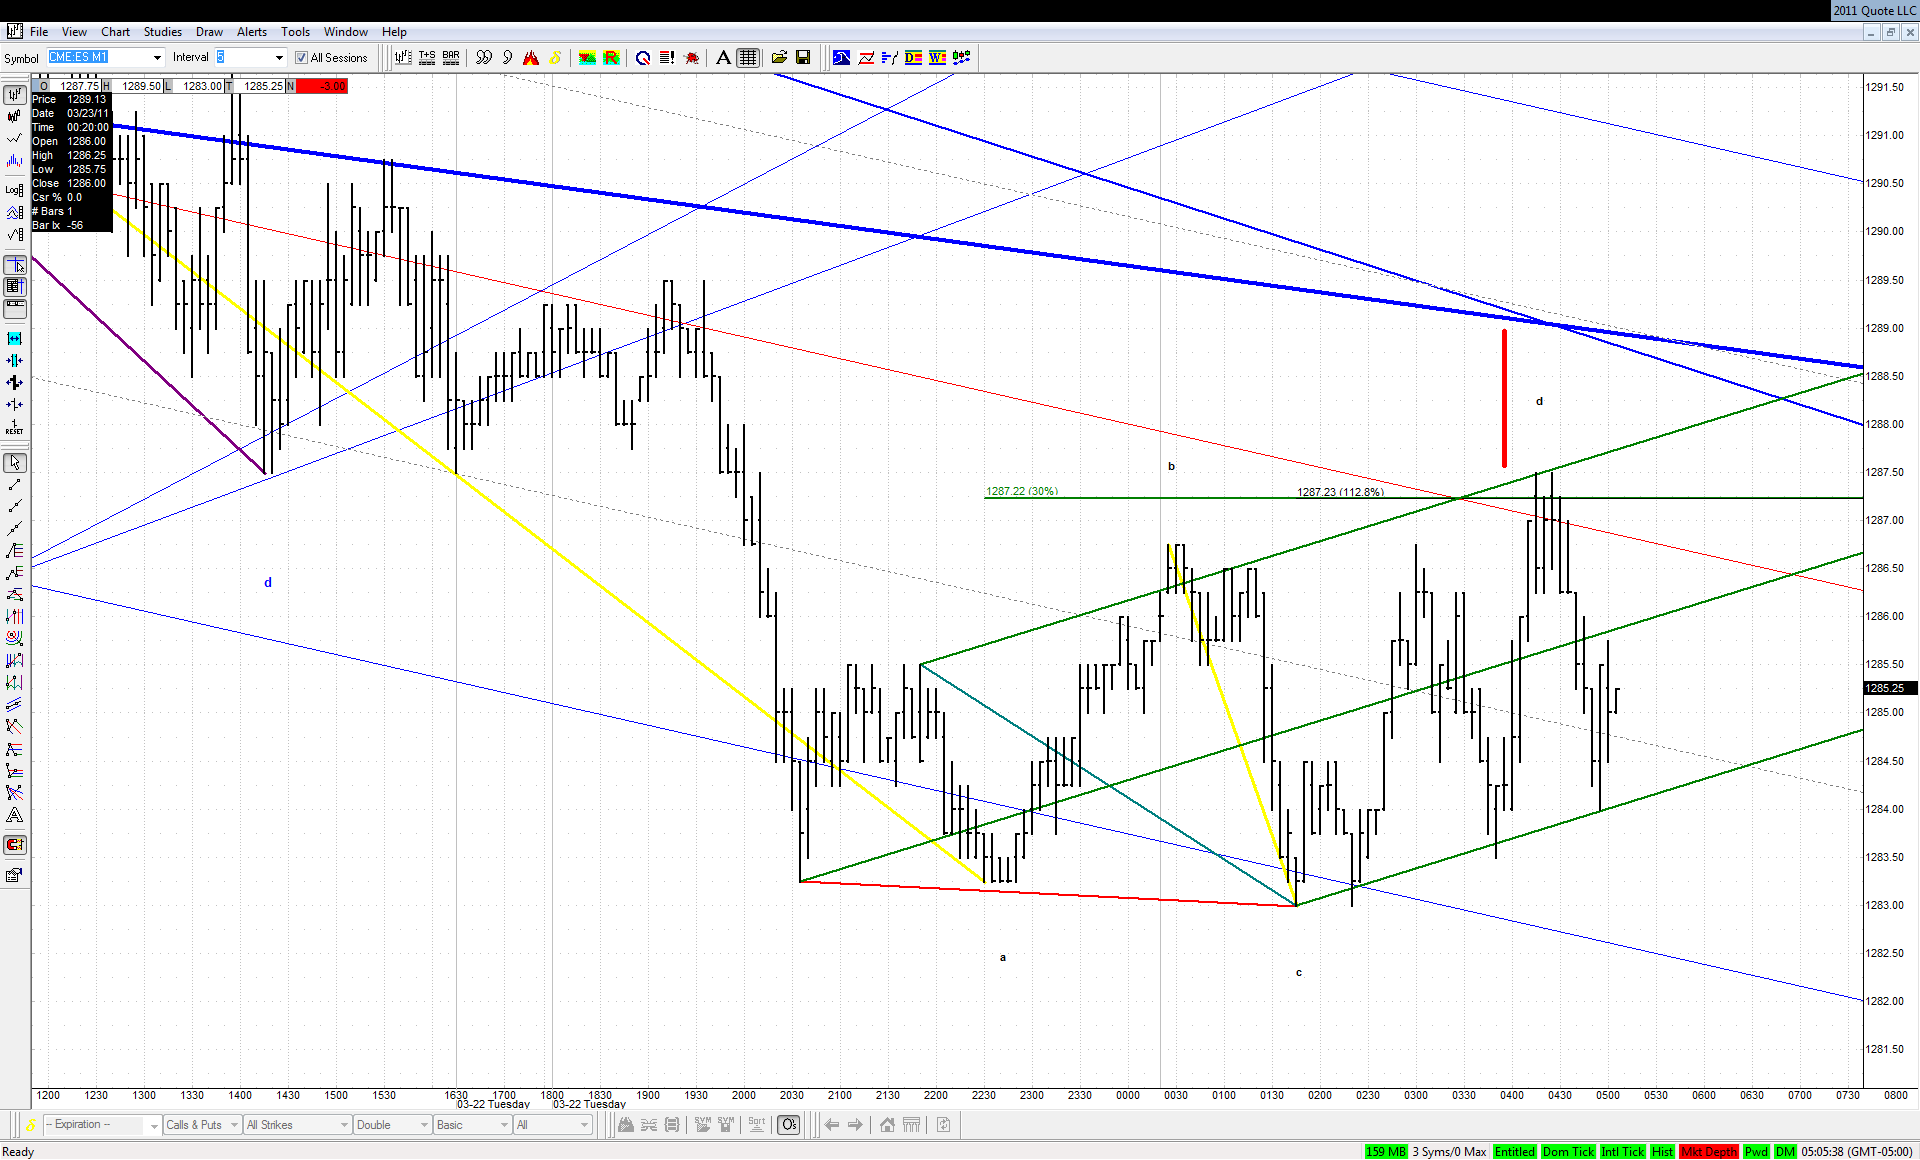
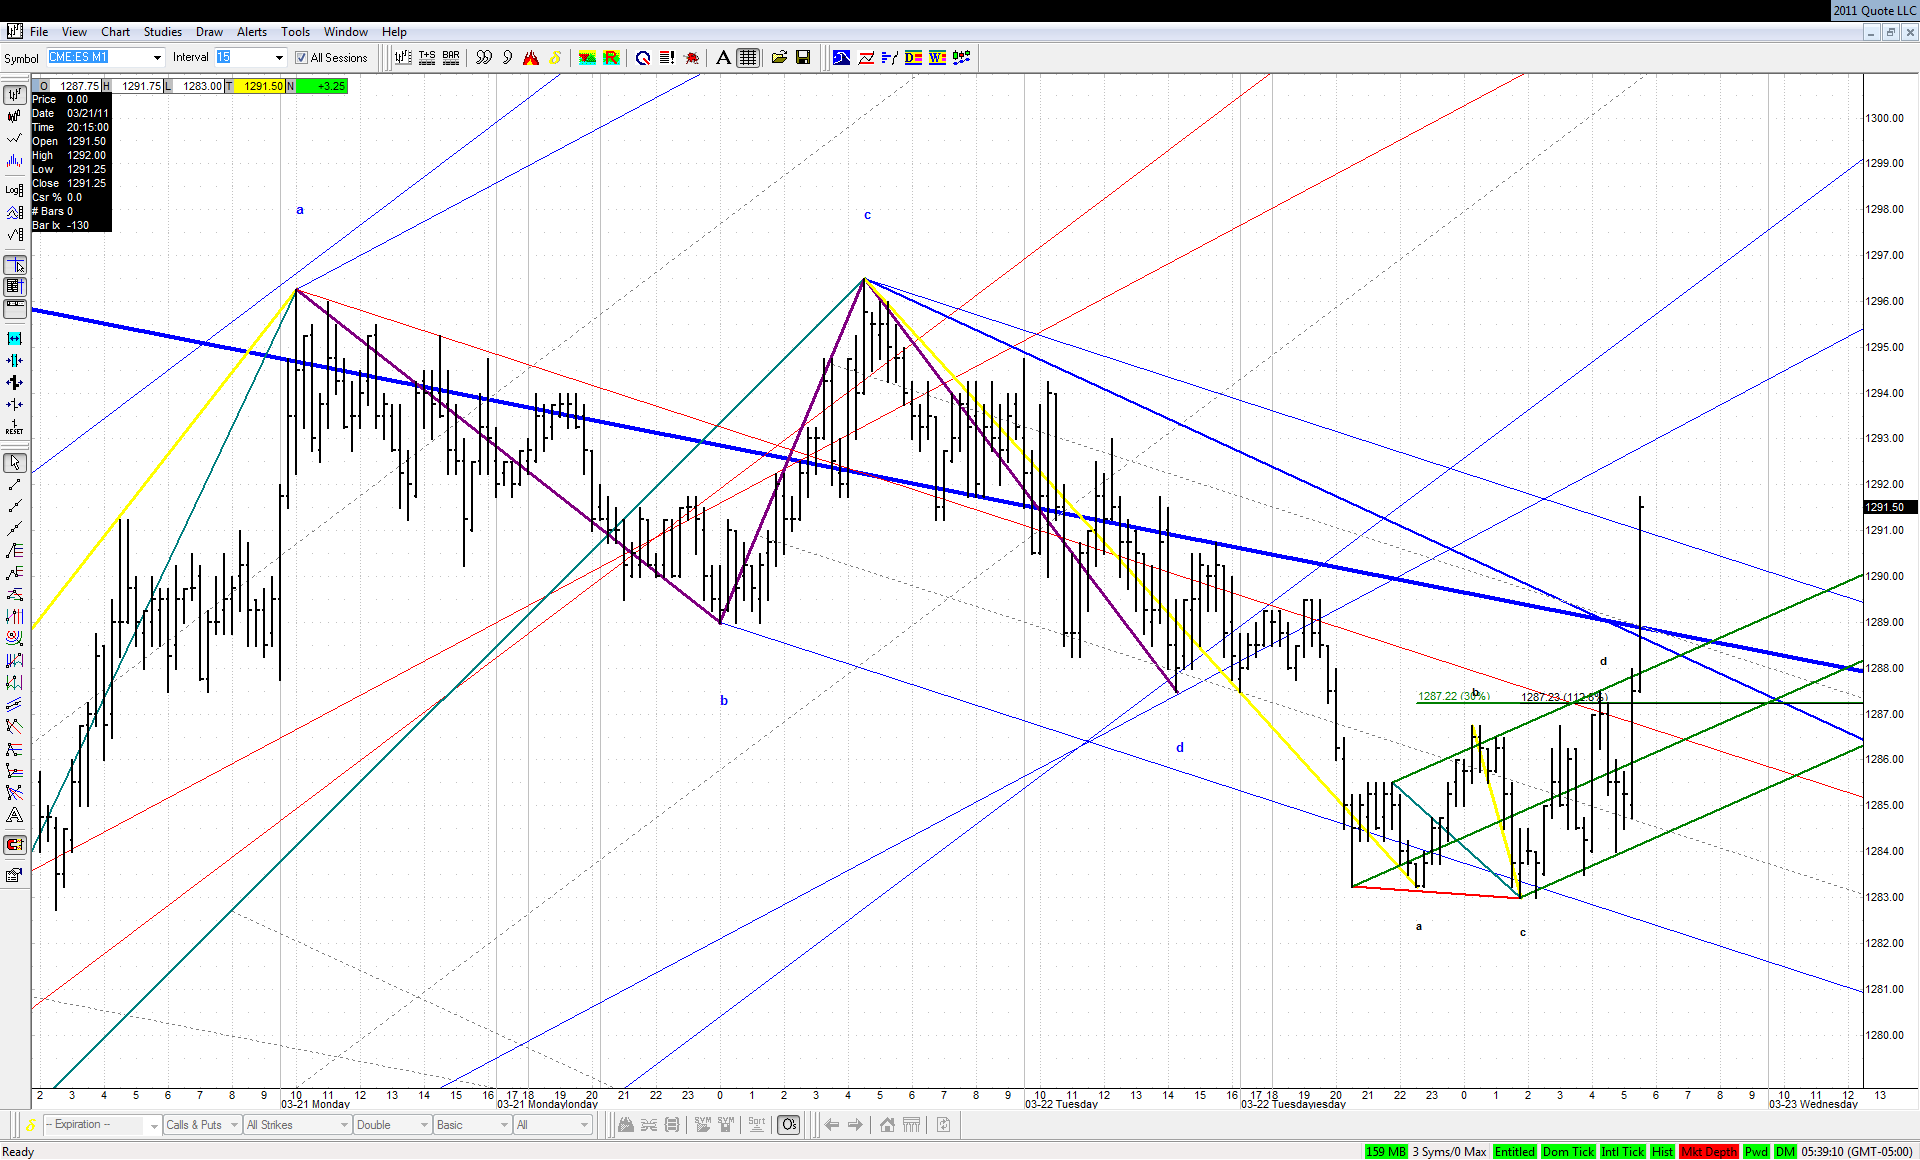
If this bounce in ES ends here without reaching the line for back-test, then bulls are doomed:

Click image for original size
JA
jarek
Rep: 94
Posts: 3,474
It's always nice to see green set "in action":

Click image for original size
ER
EricD
Rep: 63
Posts: 692
UPDATES...
Click image for original size

Click image for original size

Click image for original size
ER
EricD
Rep: 63
Posts: 692
Click image for original size
ER
EricD
Rep: 63
Posts: 692
Click image for original size
ER
EricD
Rep: 63
Posts: 692
Click image for original size
ER
EricD
Rep: 63
Posts: 692
Click image for original size
JA
jarek
Rep: 94
Posts: 3,474
Originally posted by jarek

If this bounce in ES ends here without reaching the line for back-test, then bulls are doomed:

They knew it and counteracted on time!


Click image for original size
RA
rat89
Rep: 0
Posts: 7,015
you mean white bg vs blue? interesting...

Originally posted by tx_ches

rat89,
I like the color contrast on your last charts -easier on my eyes.