MyPivots
Sign In
JA
jarek
Rep: 94
Posts: 3,474
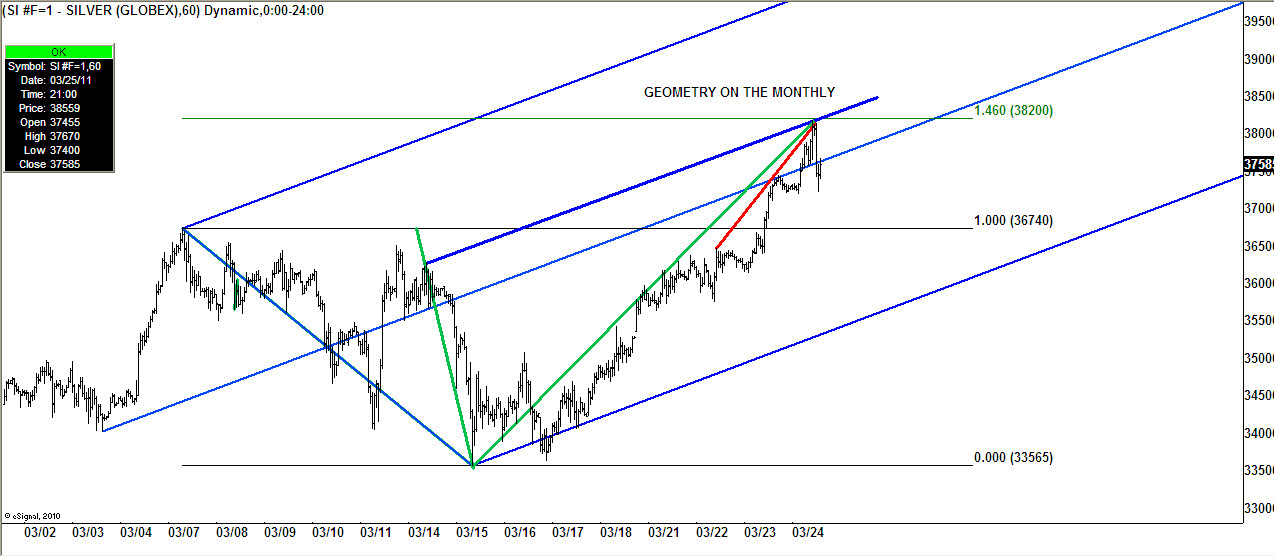
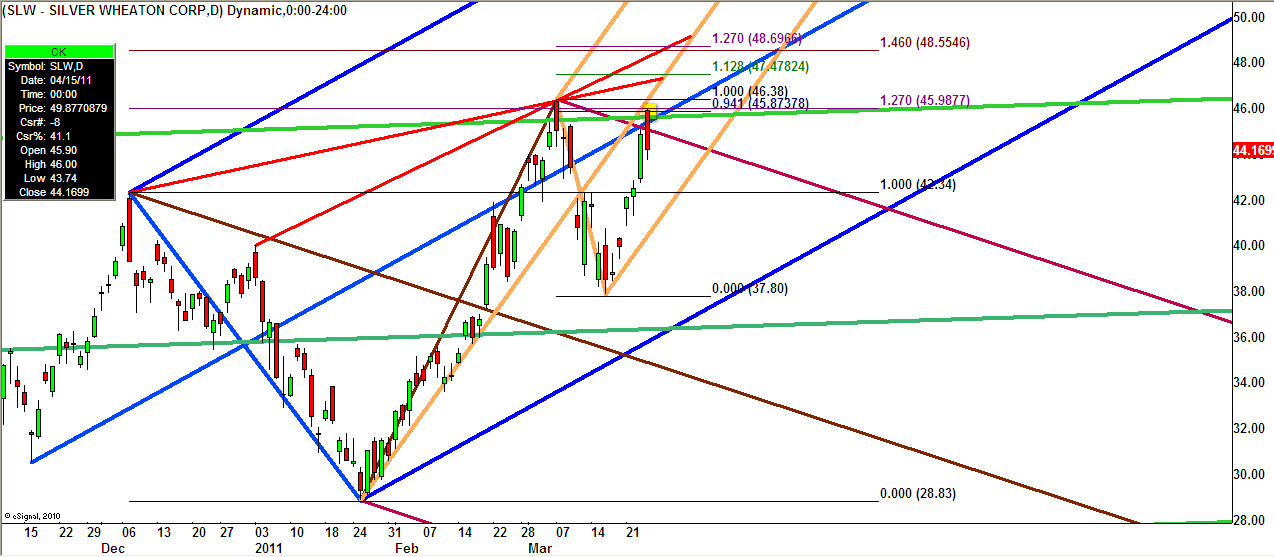
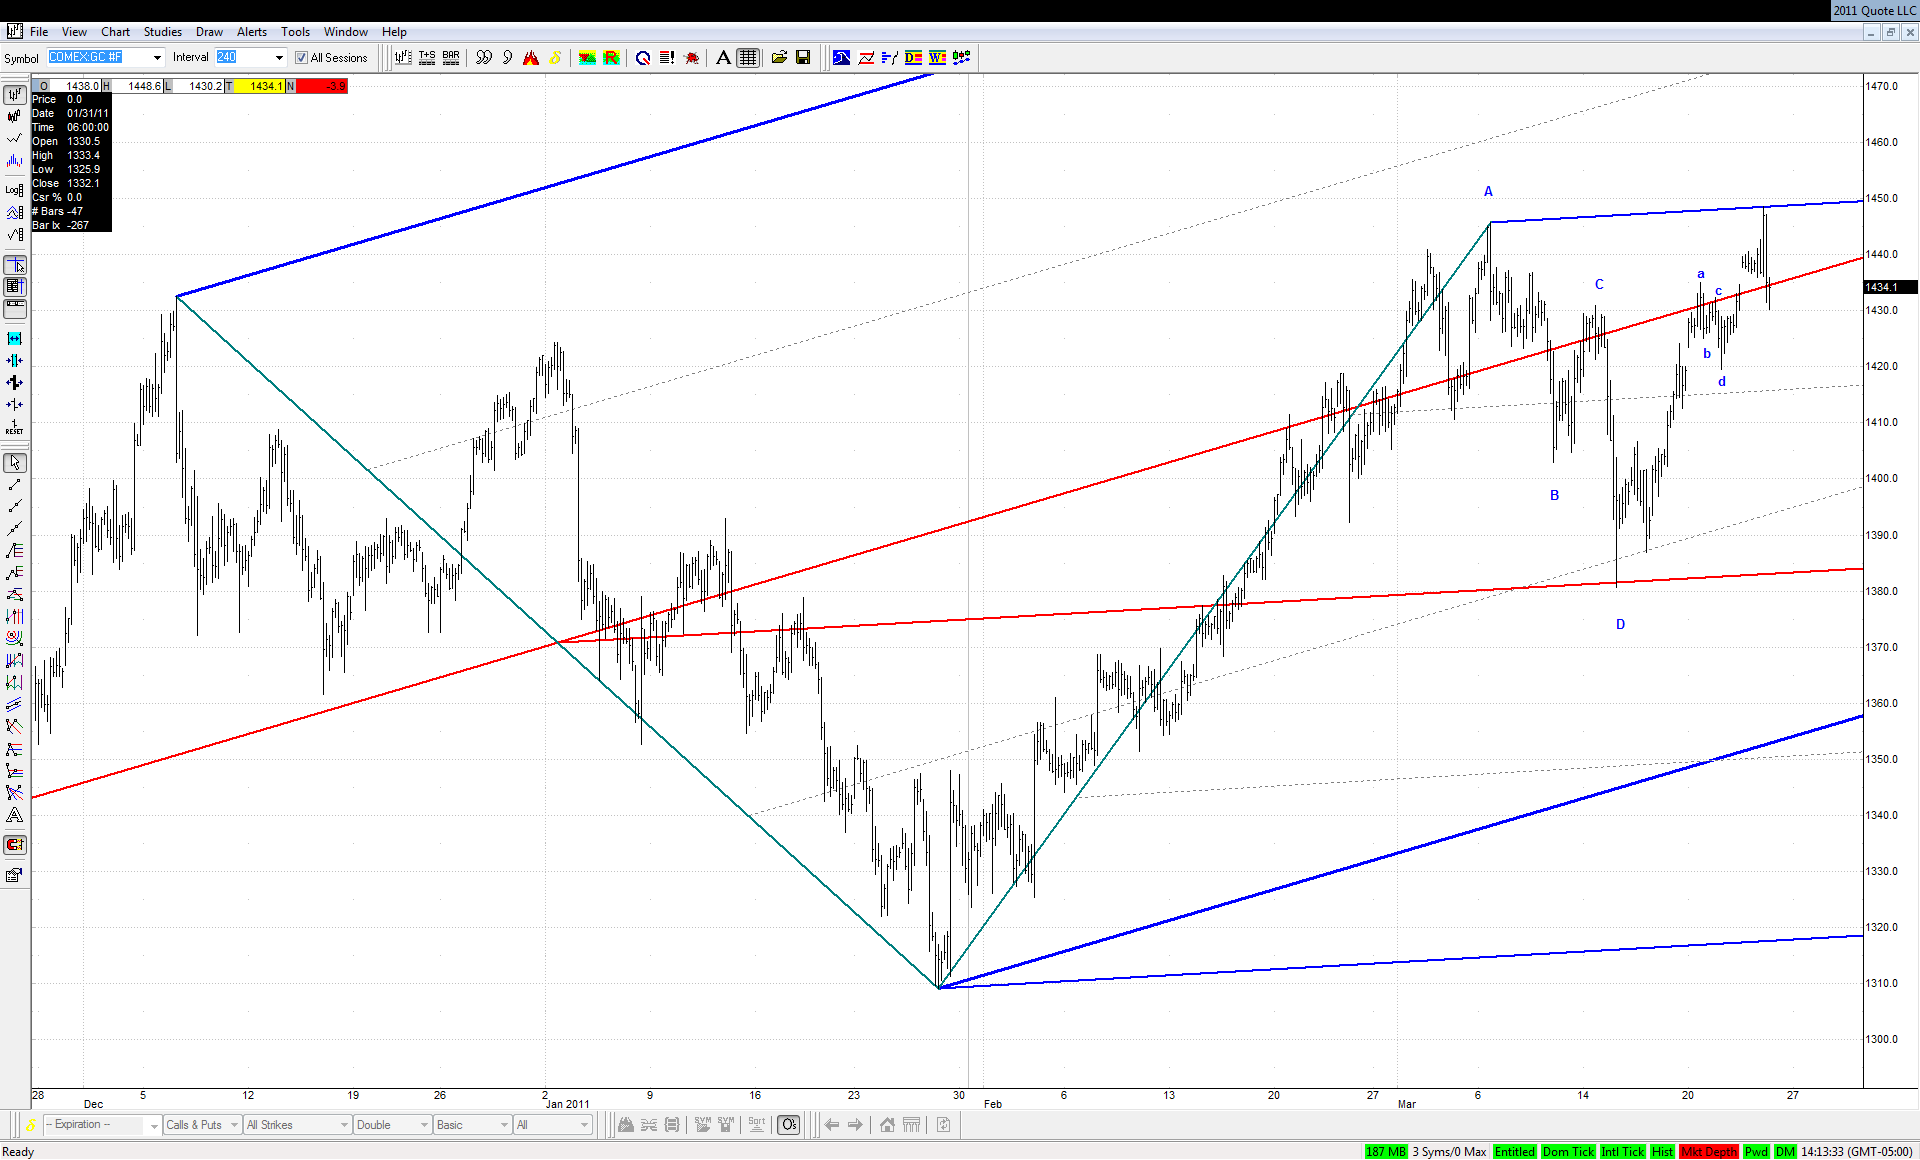
Can the recent high in February stay with us for quite longer than almost everybody is expecting at this point?

Click image for original size
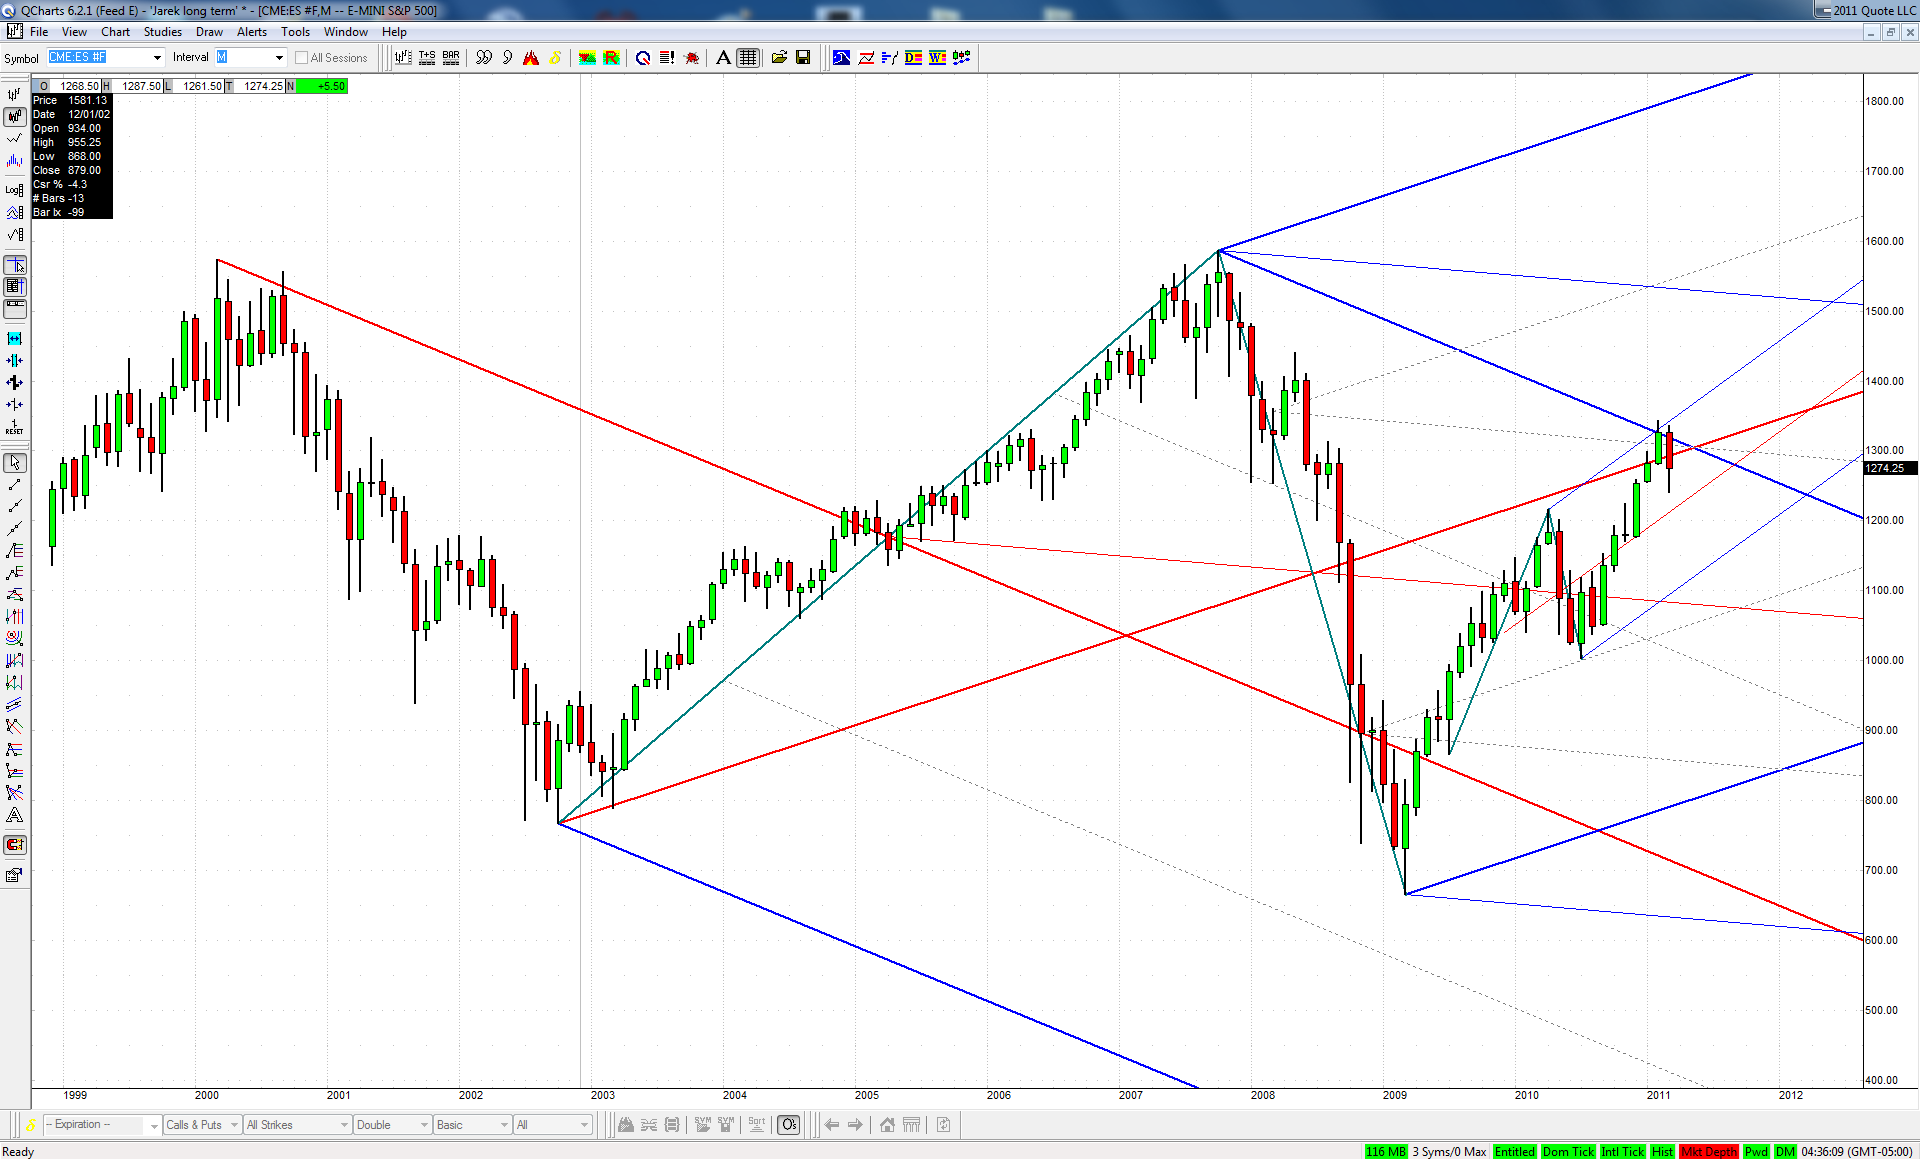

We may not know the answer to this question for some time to come, but in my opinion this is a viable alternative to consider!
RA
rat89
Rep: 0
Posts: 7,015
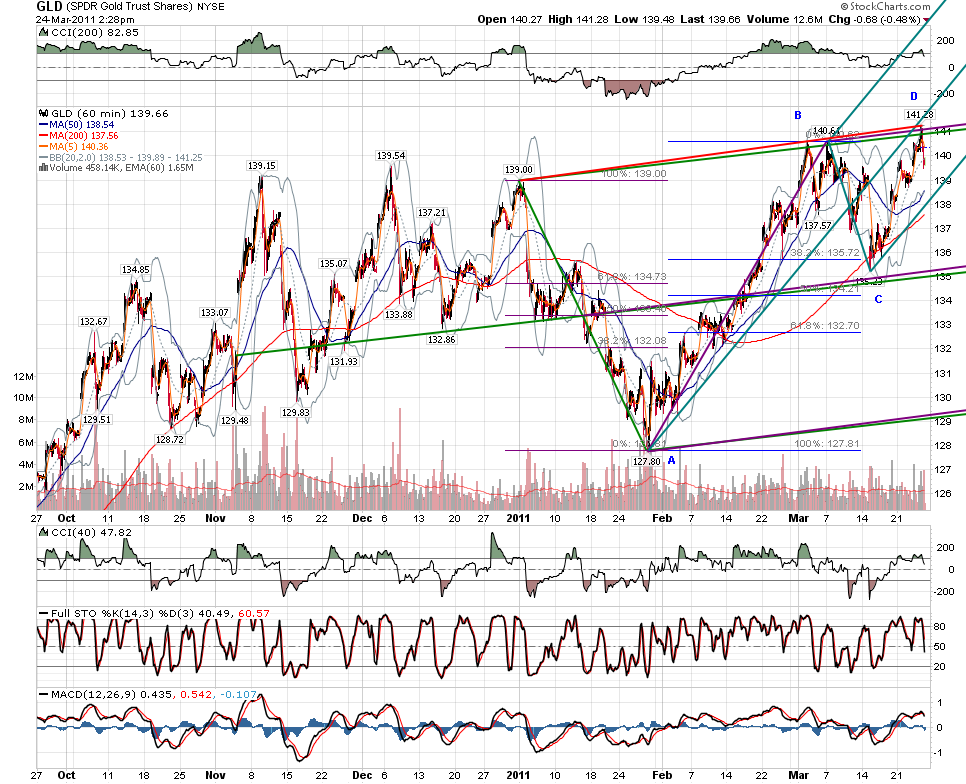
great chart jarek...it's quite a setup...the 1.128 dbs goes back to the dec high....I think I have your same schiff set in purple....seems like an interesting spot

Originally posted by jarek

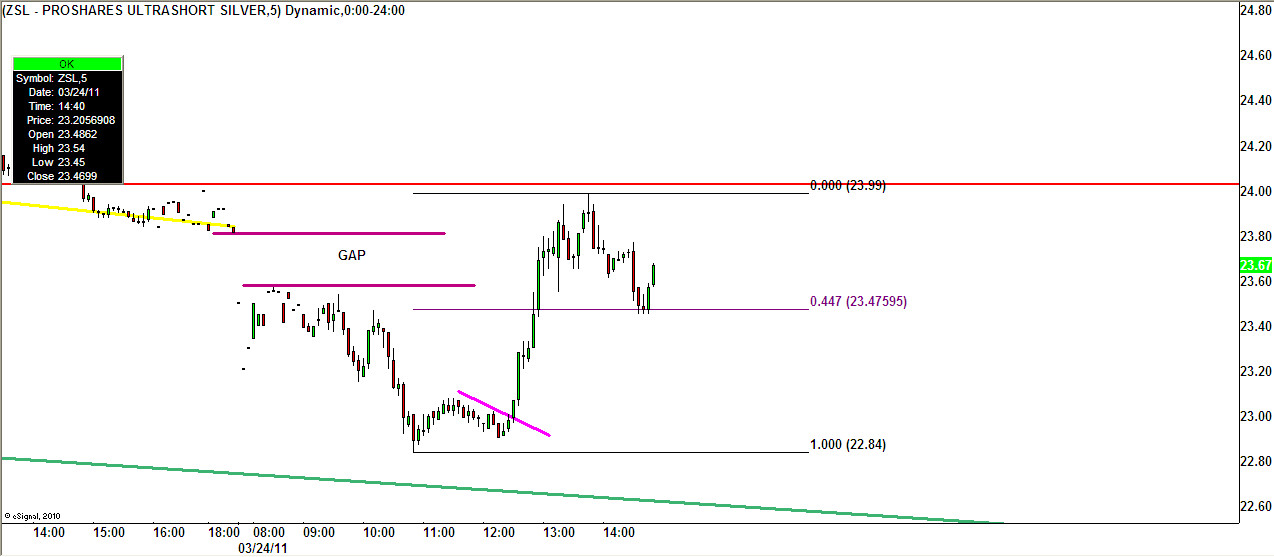
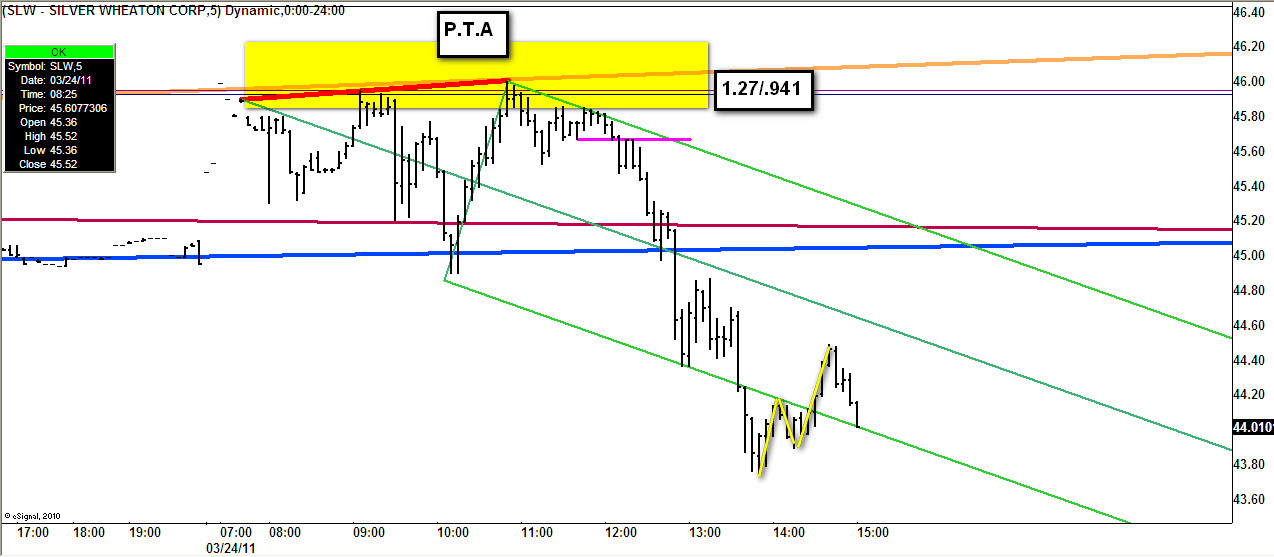
They gave it a successful shot, but just to the upper ML of an important Schiff set. I guess it was concurrent with that setup in GLD Roofer was mentioning earlier:

Click image for original size

Click image for original size
JI
jimkane
Rep: 3,058
Posts: 33,089
So, look at the time this went up at. Right on the European open... Part of the 'vibe' I got was from the layout itself, part was the way it acted. I can't describe it too much better than that, except, perhaps, that there were some small price action clues in there, too, if you look for them. Mostly, though, it was based on experience. Like how I 'know' the ES is about to launch up in here and take a shot at new intraday highs any second now...
Originally posted by jimkane

...I'm just trying to stay awake until the European open, to see if this makes a move...


Originally posted by jarek

I wonder where Jim had this "It wants up!" vibrations from during the overnight session?

JI
jimkane
Rep: 3,058
Posts: 33,089
And how I know under conditions like this the old high, plus or minus two ticks, is a 'danger zone' for a snap back trap, so I'm watching in case that starts to unfold.
JI
jimkane
Rep: 3,058
Posts: 33,089
Thanks, roofer, appreciate the support for good-natured study of whatever we see before us.


Originally posted by roofer

...jim... you will never get any grief from me if you comment on any other traders work based on your tools...
JI
jimkane
Rep: 3,058
Posts: 33,089
Notice the way this acted at the high, to the tick. Now look back at comments I made yesterday at the high. This is a different 'layout', with closer-spaced highs and other differences, but the concept is similar. Yesterday it hit 96.00. It had two significant previous highs, at 96.25, and 96.50, respectively. It then dumped 6.50 points off that 96.00. This is not uncommon. It's different here, the way it is laid out, but I still expect a potential reaction at the high, plus or minus two ticks, and we got one. Now we see if they can goose it up and over.
JI
jimkane
Rep: 3,058
Posts: 33,089


Originally posted by jimkane

...Like how I 'know' the ES is about to launch up in here and take a shot at new intraday highs any second now...
JI
jimkane
Rep: 3,058
Posts: 33,089
Boy, did I read that little oinker just right (in my opinion)...
ER
EricD
Rep: 63
Posts: 692
Click image for original size

Click image for original size

Click image for original size

Click image for original size
ER
EricD
Rep: 63
Posts: 692
Click image for original size

Click image for original size
JI
jimkane
Rep: 3,058
Posts: 33,089
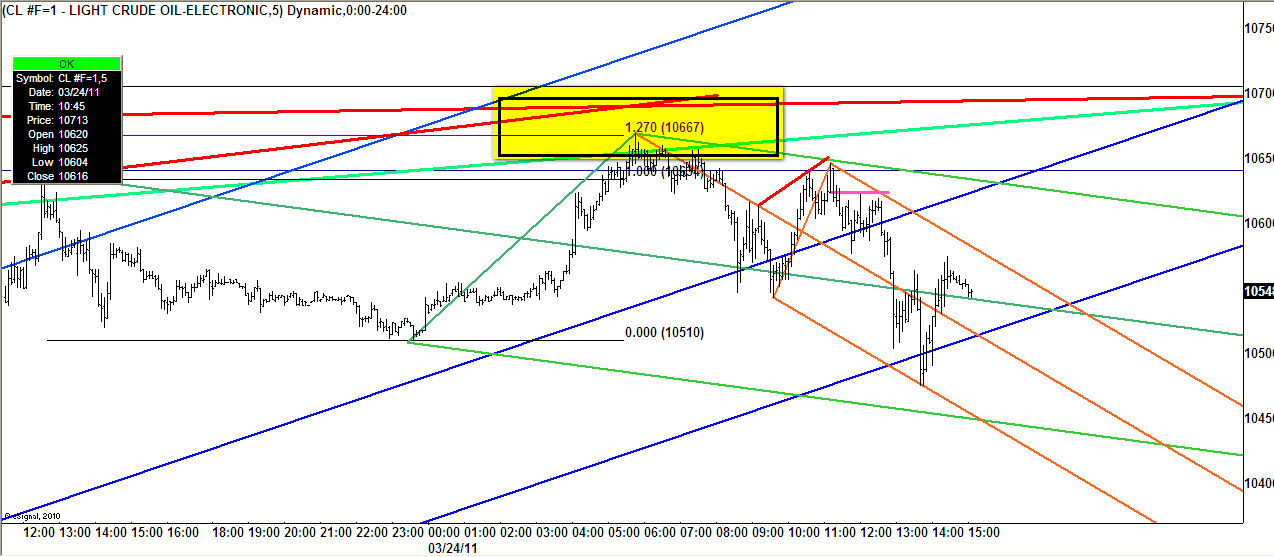
Notice the 15-min SL and 1.272/1.460 from the 5-min, all hitting at the HOD. Now we get a clue for the next phase.

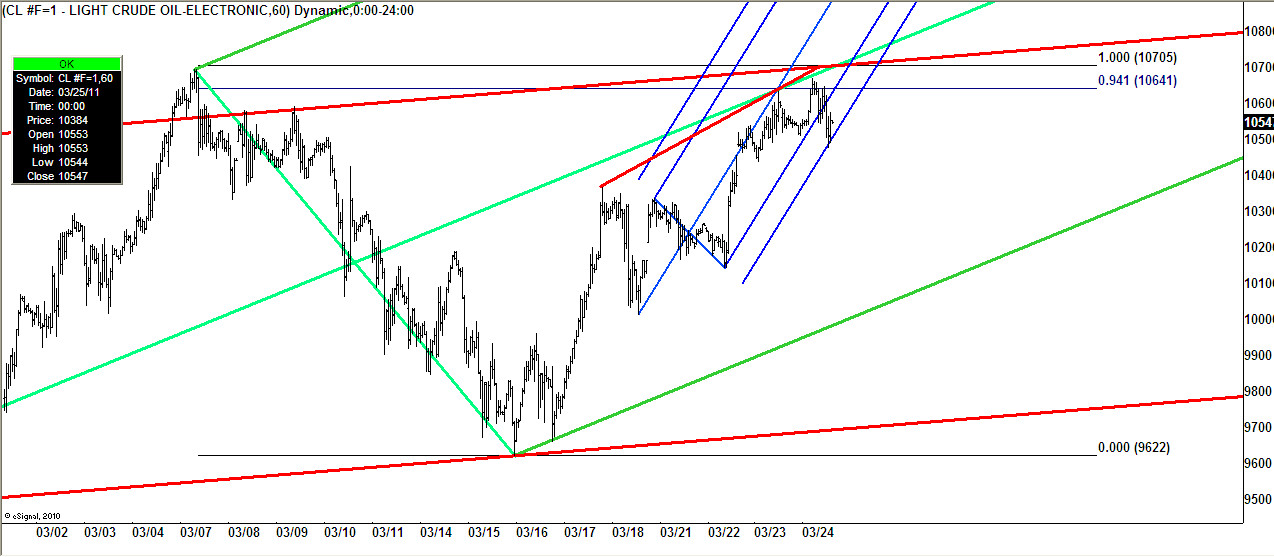
Notice crude on the tick chart.
RA
rat89
Rep: 0
Posts: 7,015
you mean white bg vs blue? interesting...

Originally posted by tx_ches

rat89,
I like the color contrast on your last charts -easier on my eyes.