MyPivots
Sign In
JA
jarek
Rep: 94
Posts: 3,474
Can the recent high in February stay with us for quite longer than almost everybody is expecting at this point?

Click image for original size
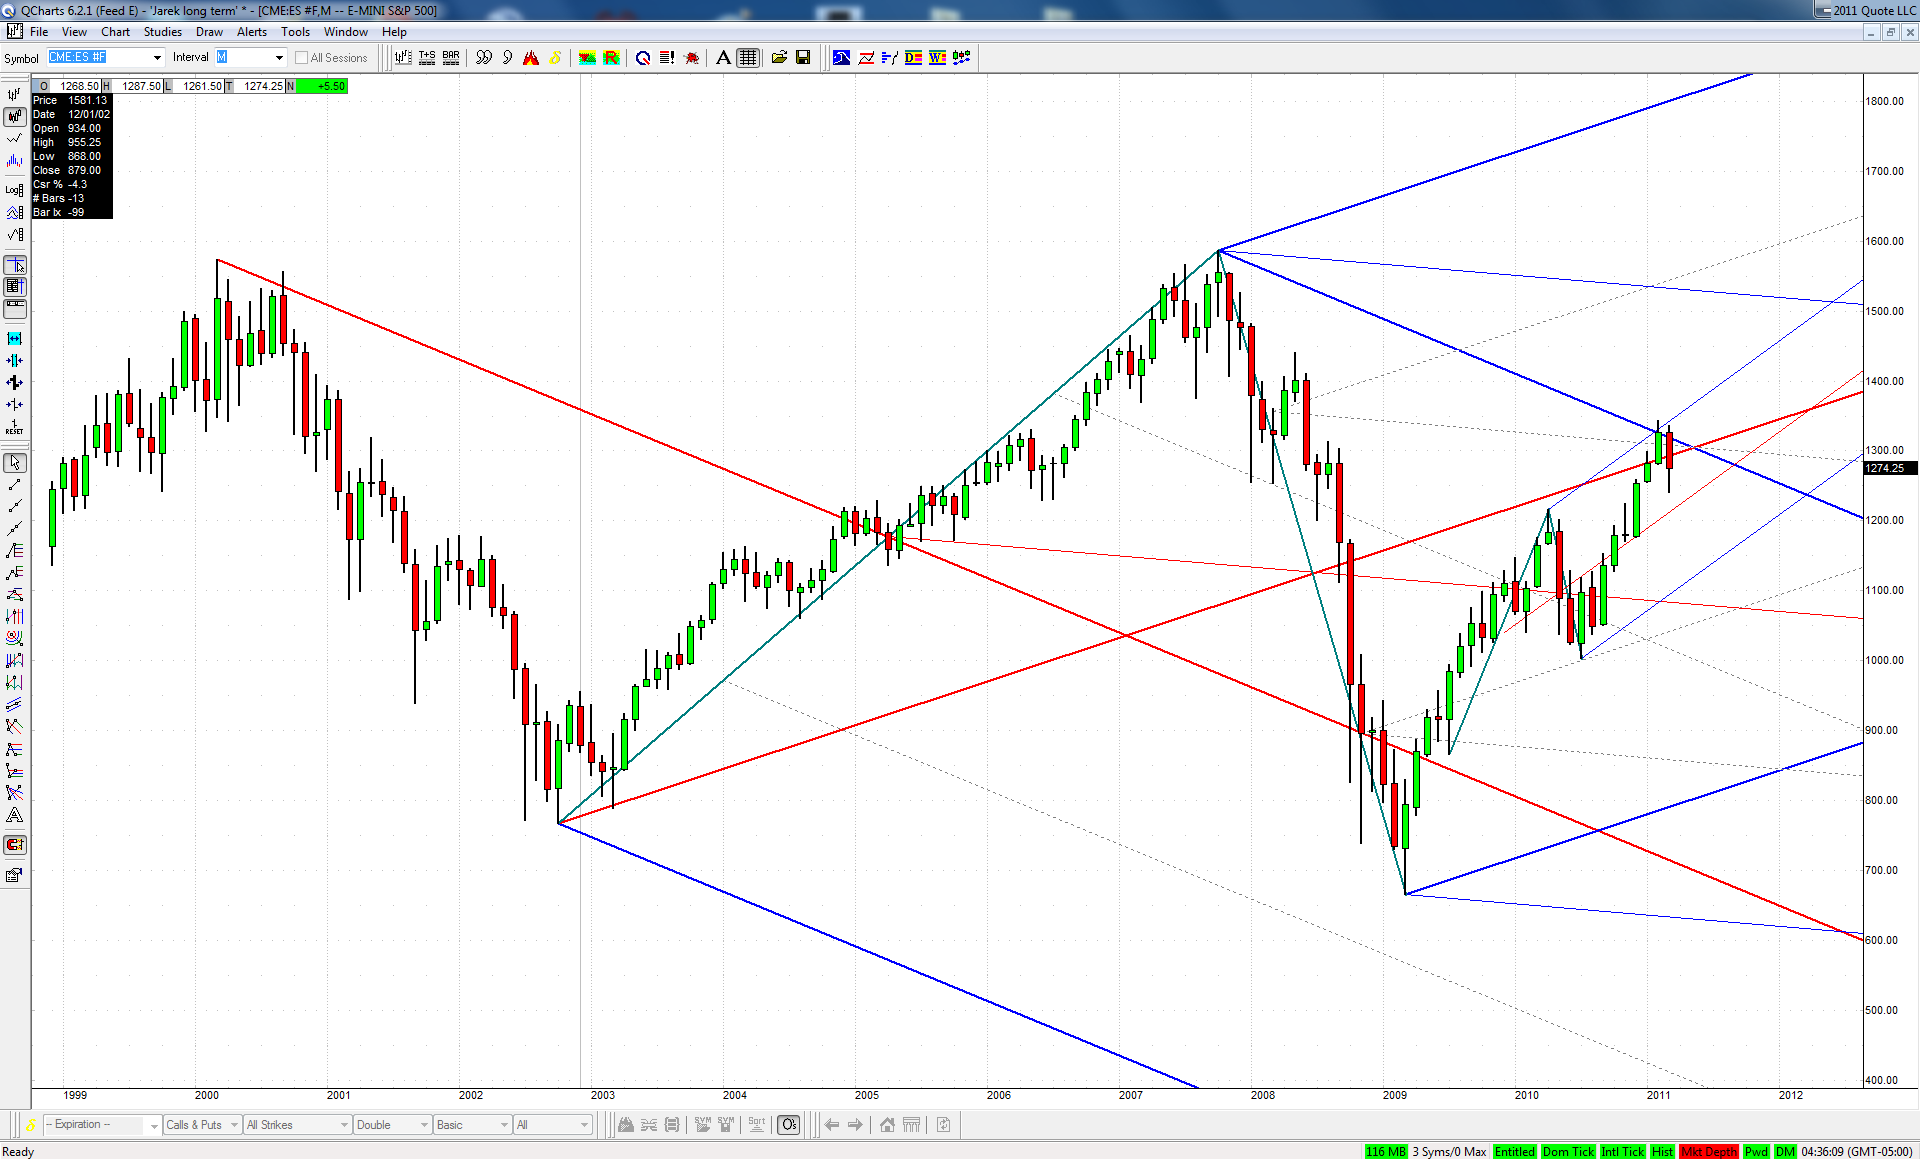

We may not know the answer to this question for some time to come, but in my opinion this is a viable alternative to consider!
TX
tx_ches
Rep: -10
Posts: 514
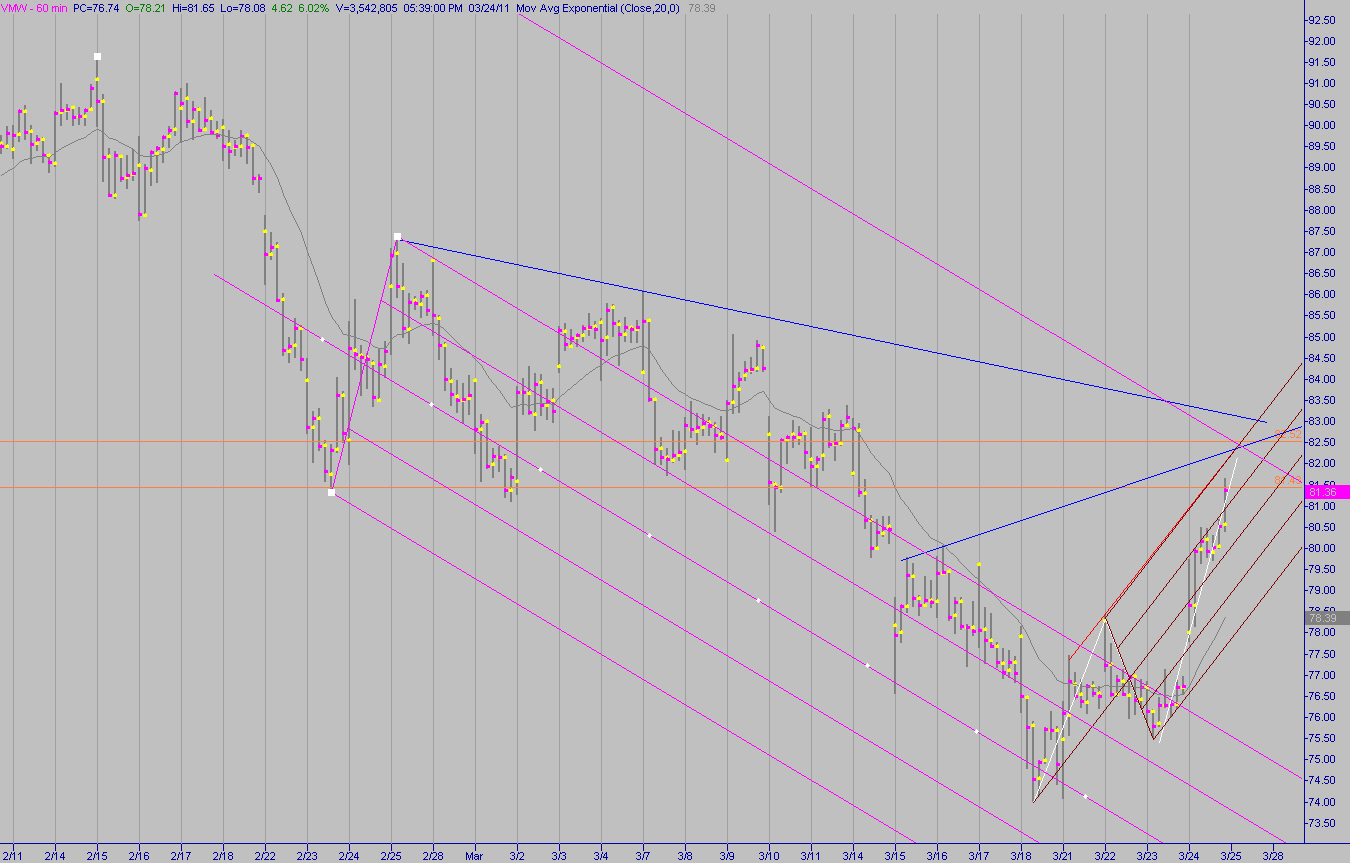
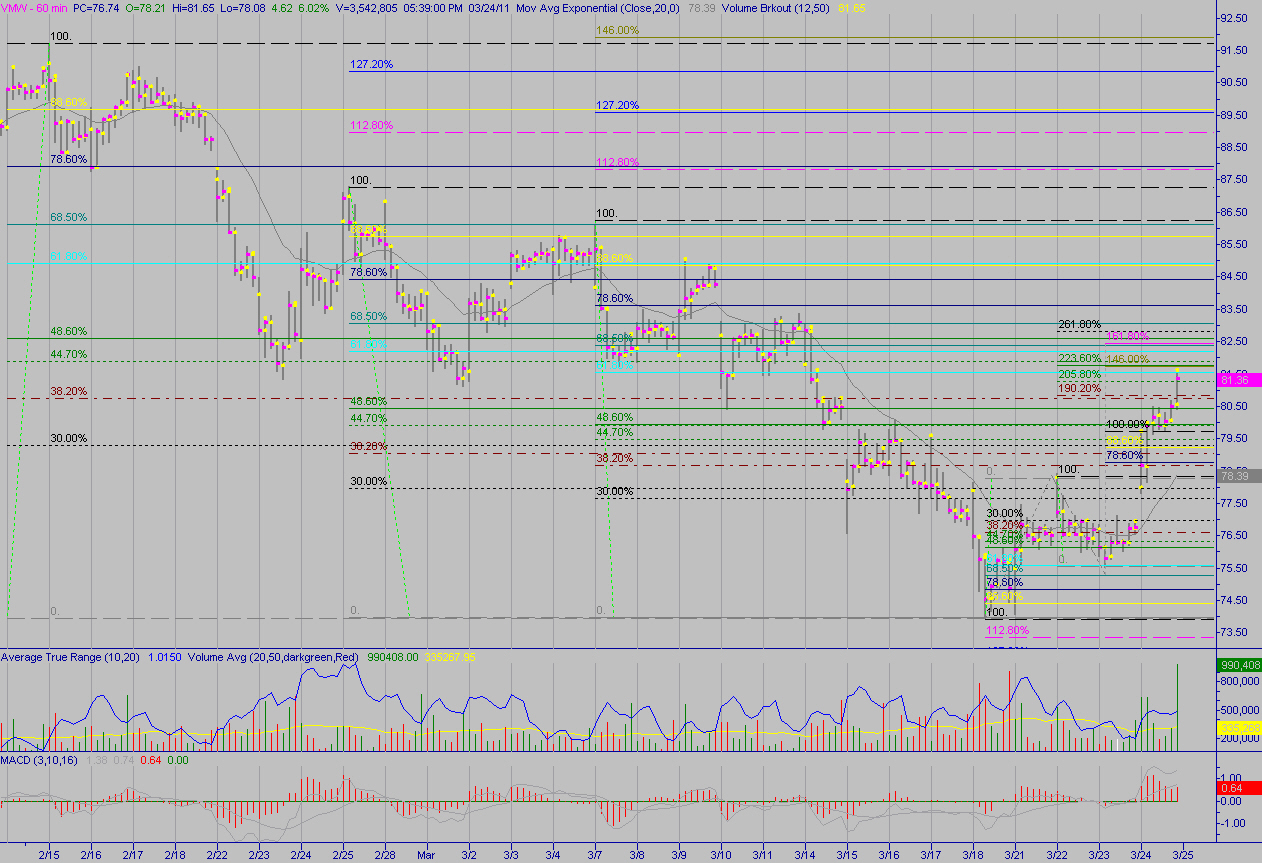
Practice work in vmw 60 minute.
One chart shows the fibs.
One chart shows the lines in the area of fib confluence.
I think Jim would say it's gone too far to be a corrective bearish abcd.
The last bar is about at 146 projection now. The C was at 61.8.

Click image for original size

Click image for original size
TX
tx_ches
Rep: -10
Posts: 514
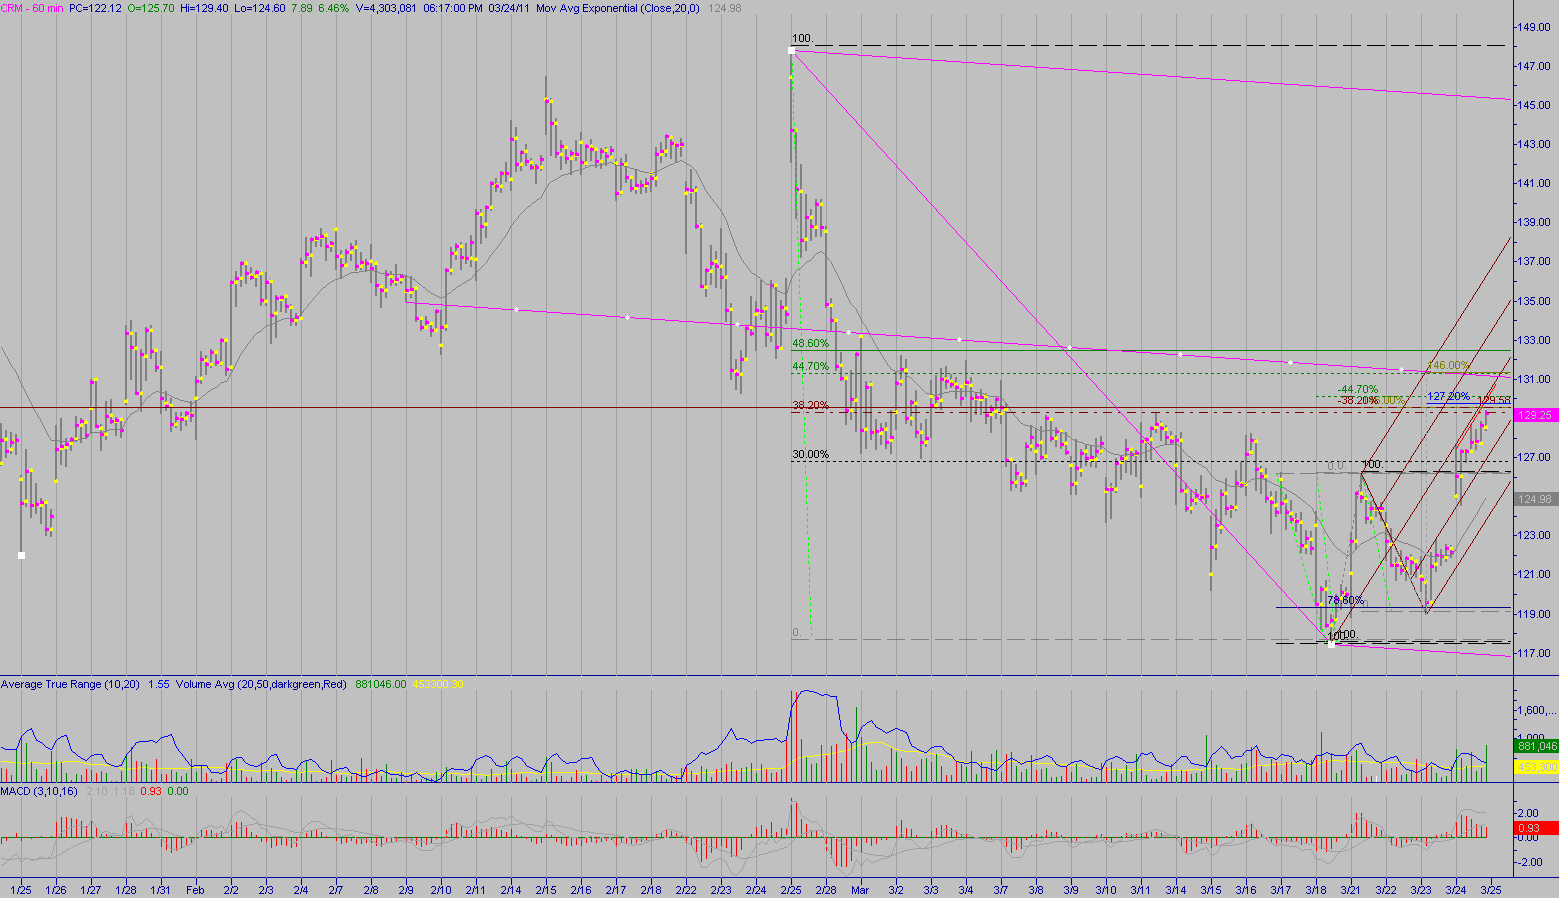
CRM 60min.
May get some kind of knee jerk reaction in the kane zone.

Click image for original size
RA
rat89
Rep: 0
Posts: 7,015
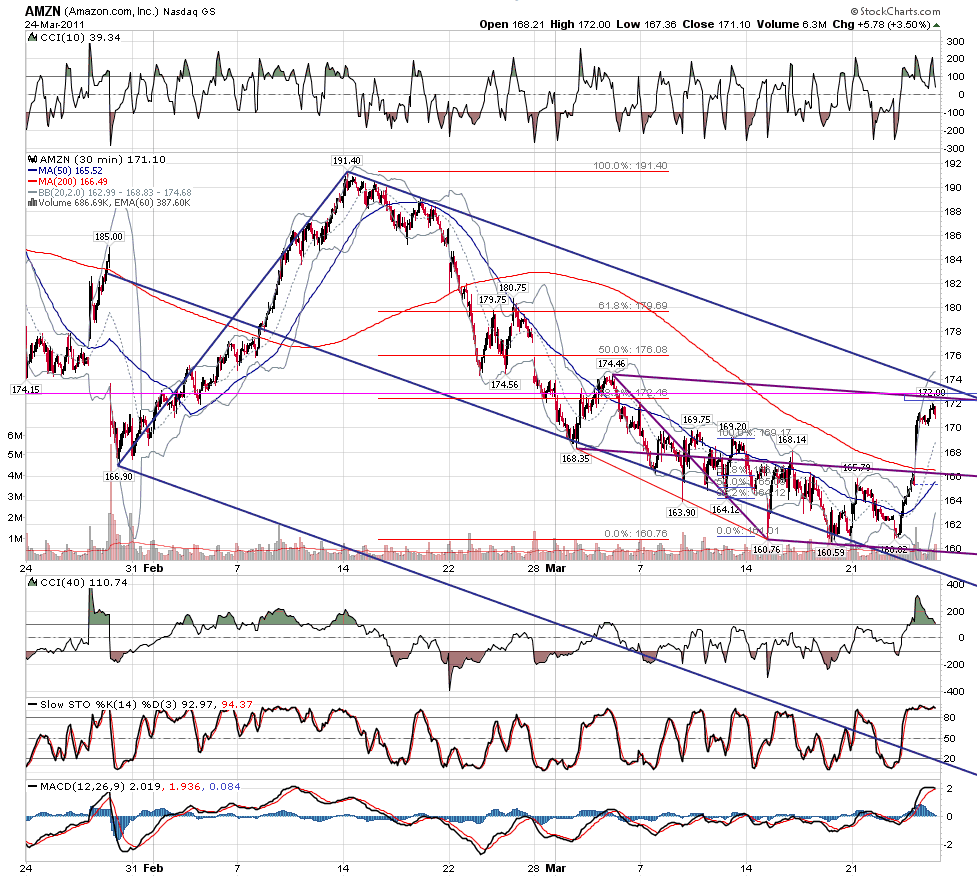
interesting confluence of larger .382 and smaller .886 from 172.36 - 172.88


Originally posted by tx_ches

AMZN 60 minute.
Find some FIB confluence coming up in AMZN when gets above 172.17 for a possible bearish ABCD. The D point, if it plays out, could occur at several places.
Still looking for the ML confluence but there are horizontal S/R lines from prior pivots.


Click image for original size
TX
tx_ches
Rep: -10
Posts: 514
I didn't have that 88.6 on my chart. Thanks for pointing that out.
Something should happen in that area. Could gap above it to avoid it all. Flexible - look both ways.

Originally posted by rat89

interesting confluence of larger .382 and smaller .886 from 172.36 - 172.88
JA
jarek
Rep: 94
Posts: 3,474
Originally posted by jarek

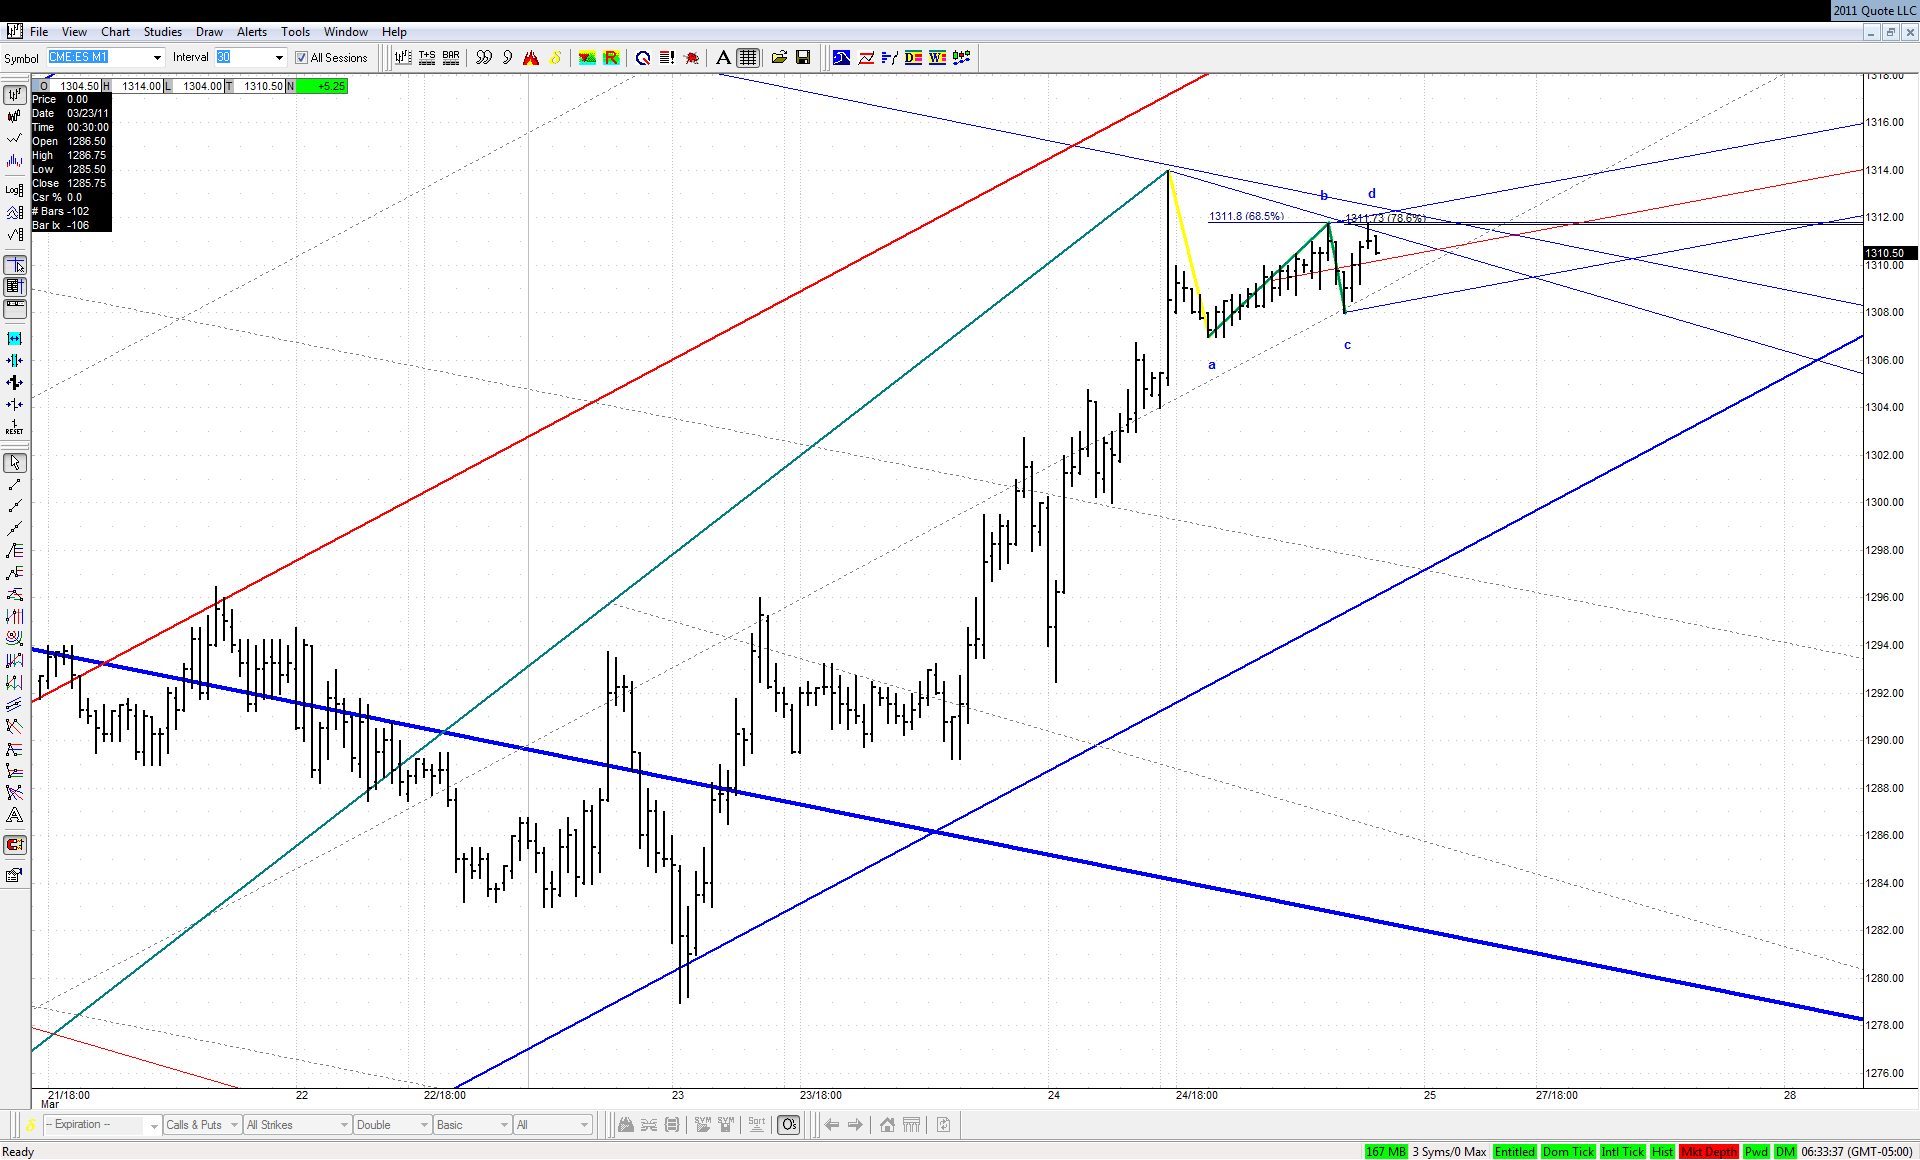
ES behaves like it was in some sort of W3 up...
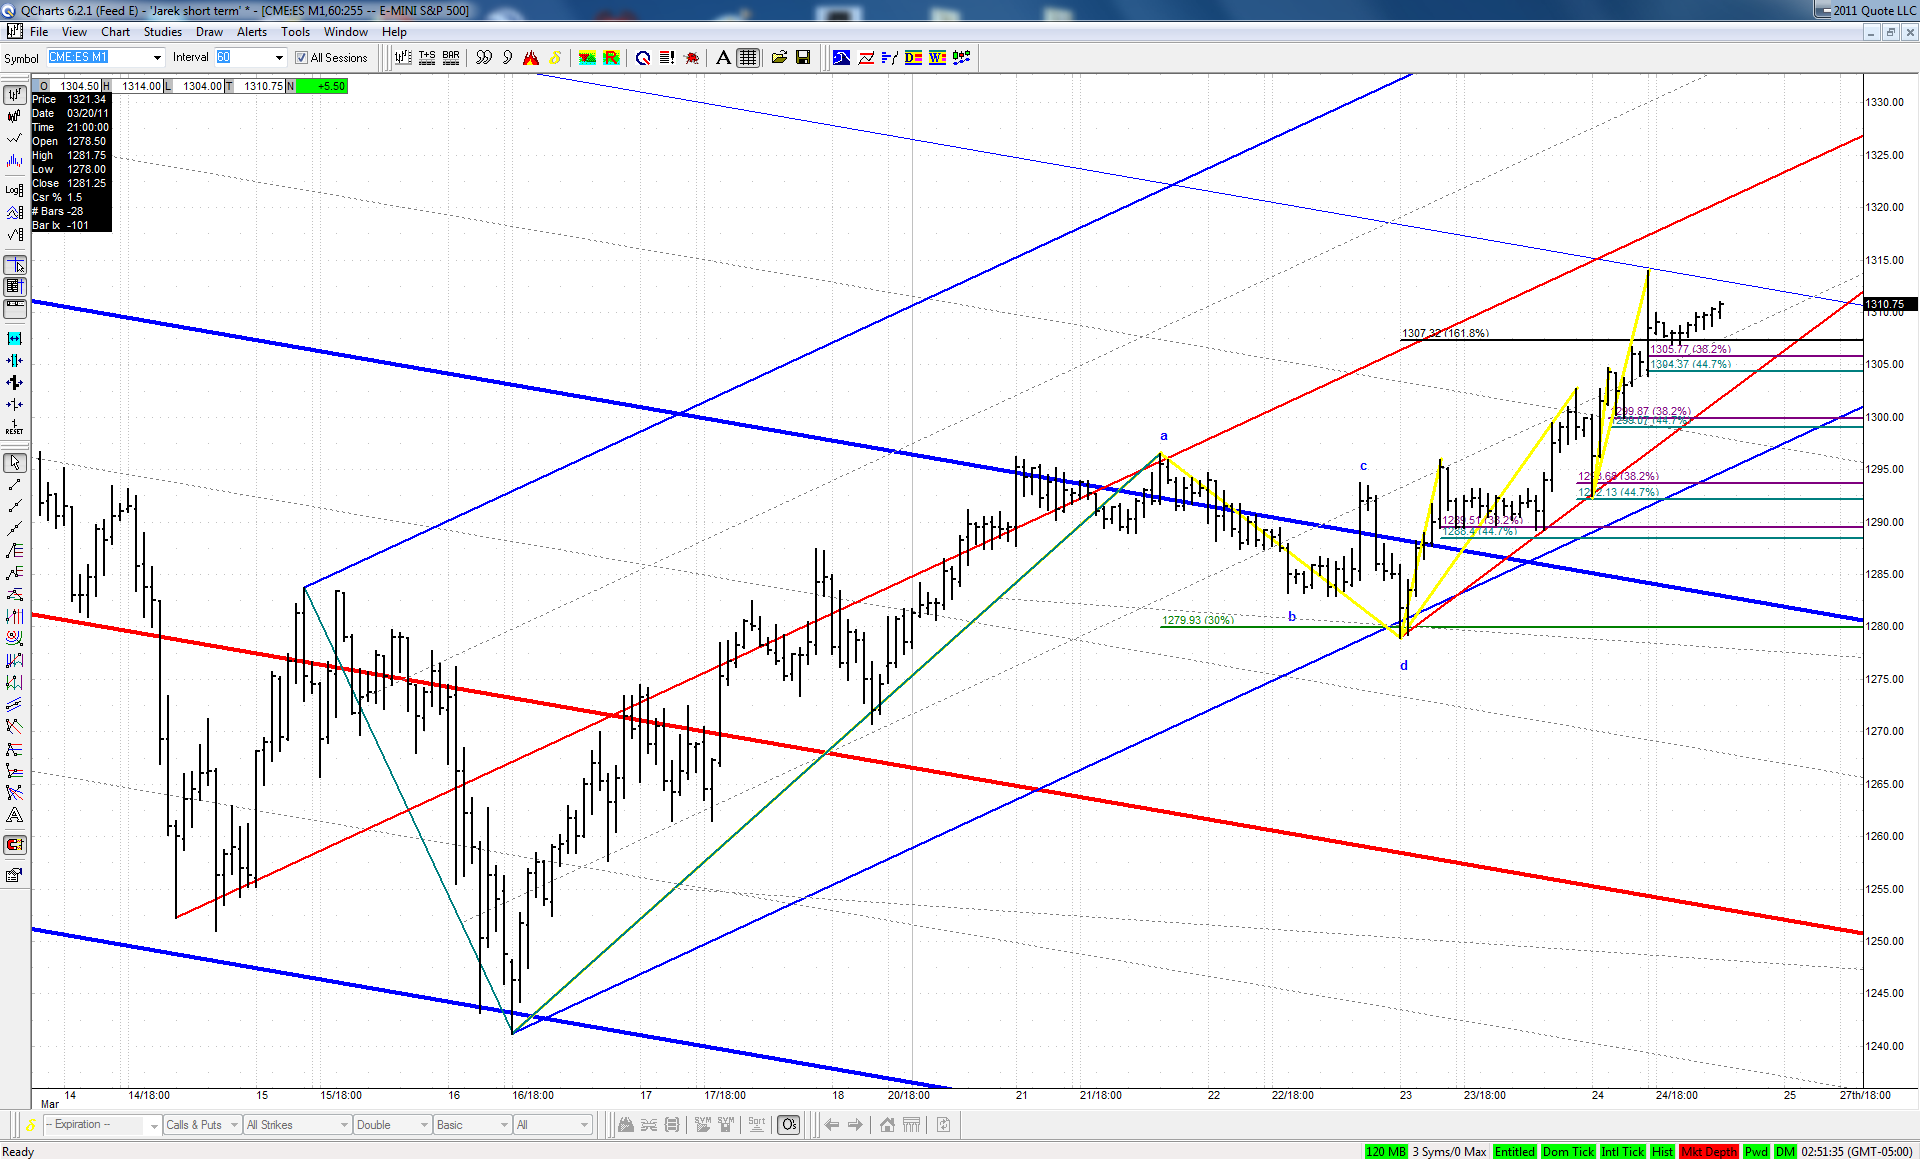
...and this was confirmed by taking out 1.618 of our bullish ABCD which thus couldn't be W4:

Click image for original size


Please note that the overnight spike was exactly to the warning line of our downsloping set
JA
jarek
Rep: 94
Posts: 3,474
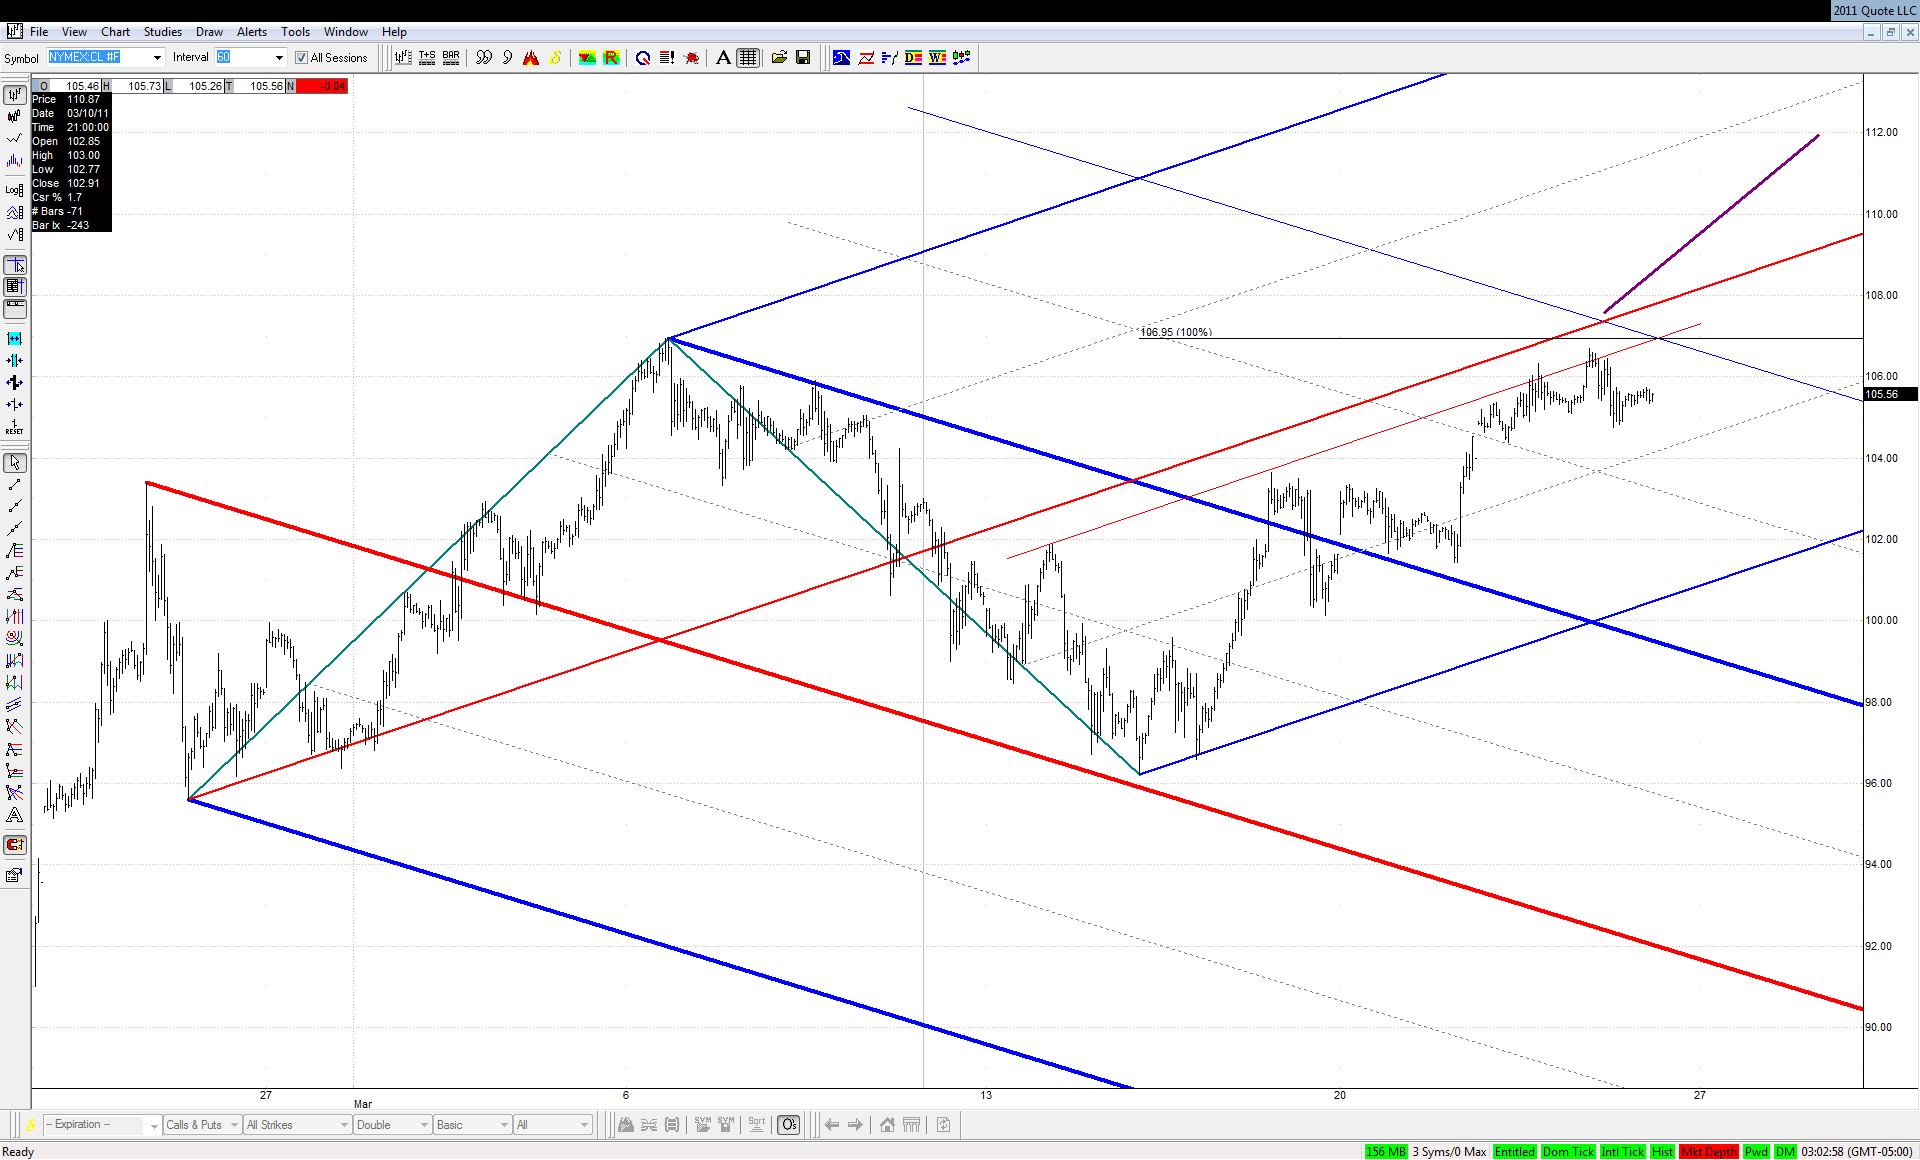
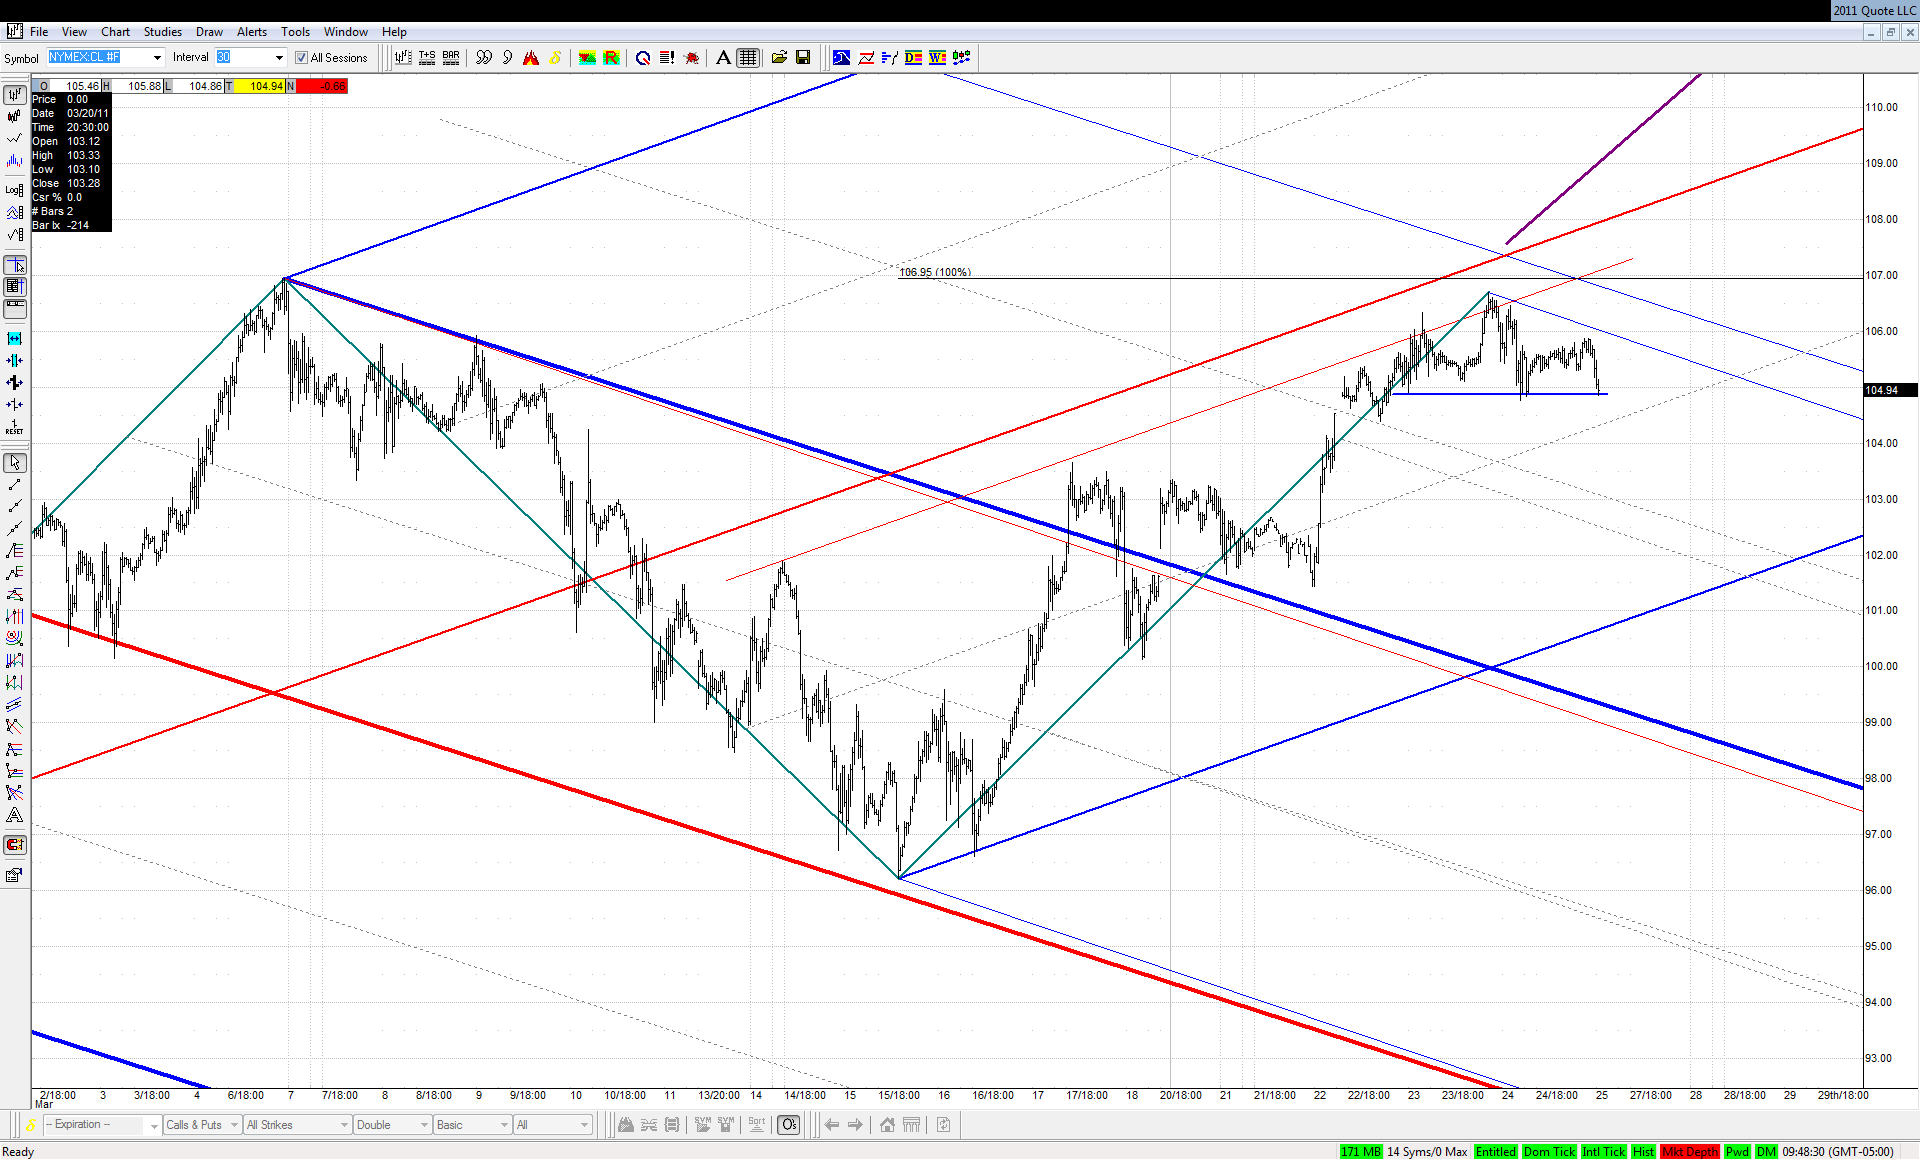
This line confluence slightly above previous high in Crude was surely a strong magnet:

Click image for original size


Failure to reach it while being so close might be a sign of bulls' weakness
JA
jarek
Rep: 94
Posts: 3,474
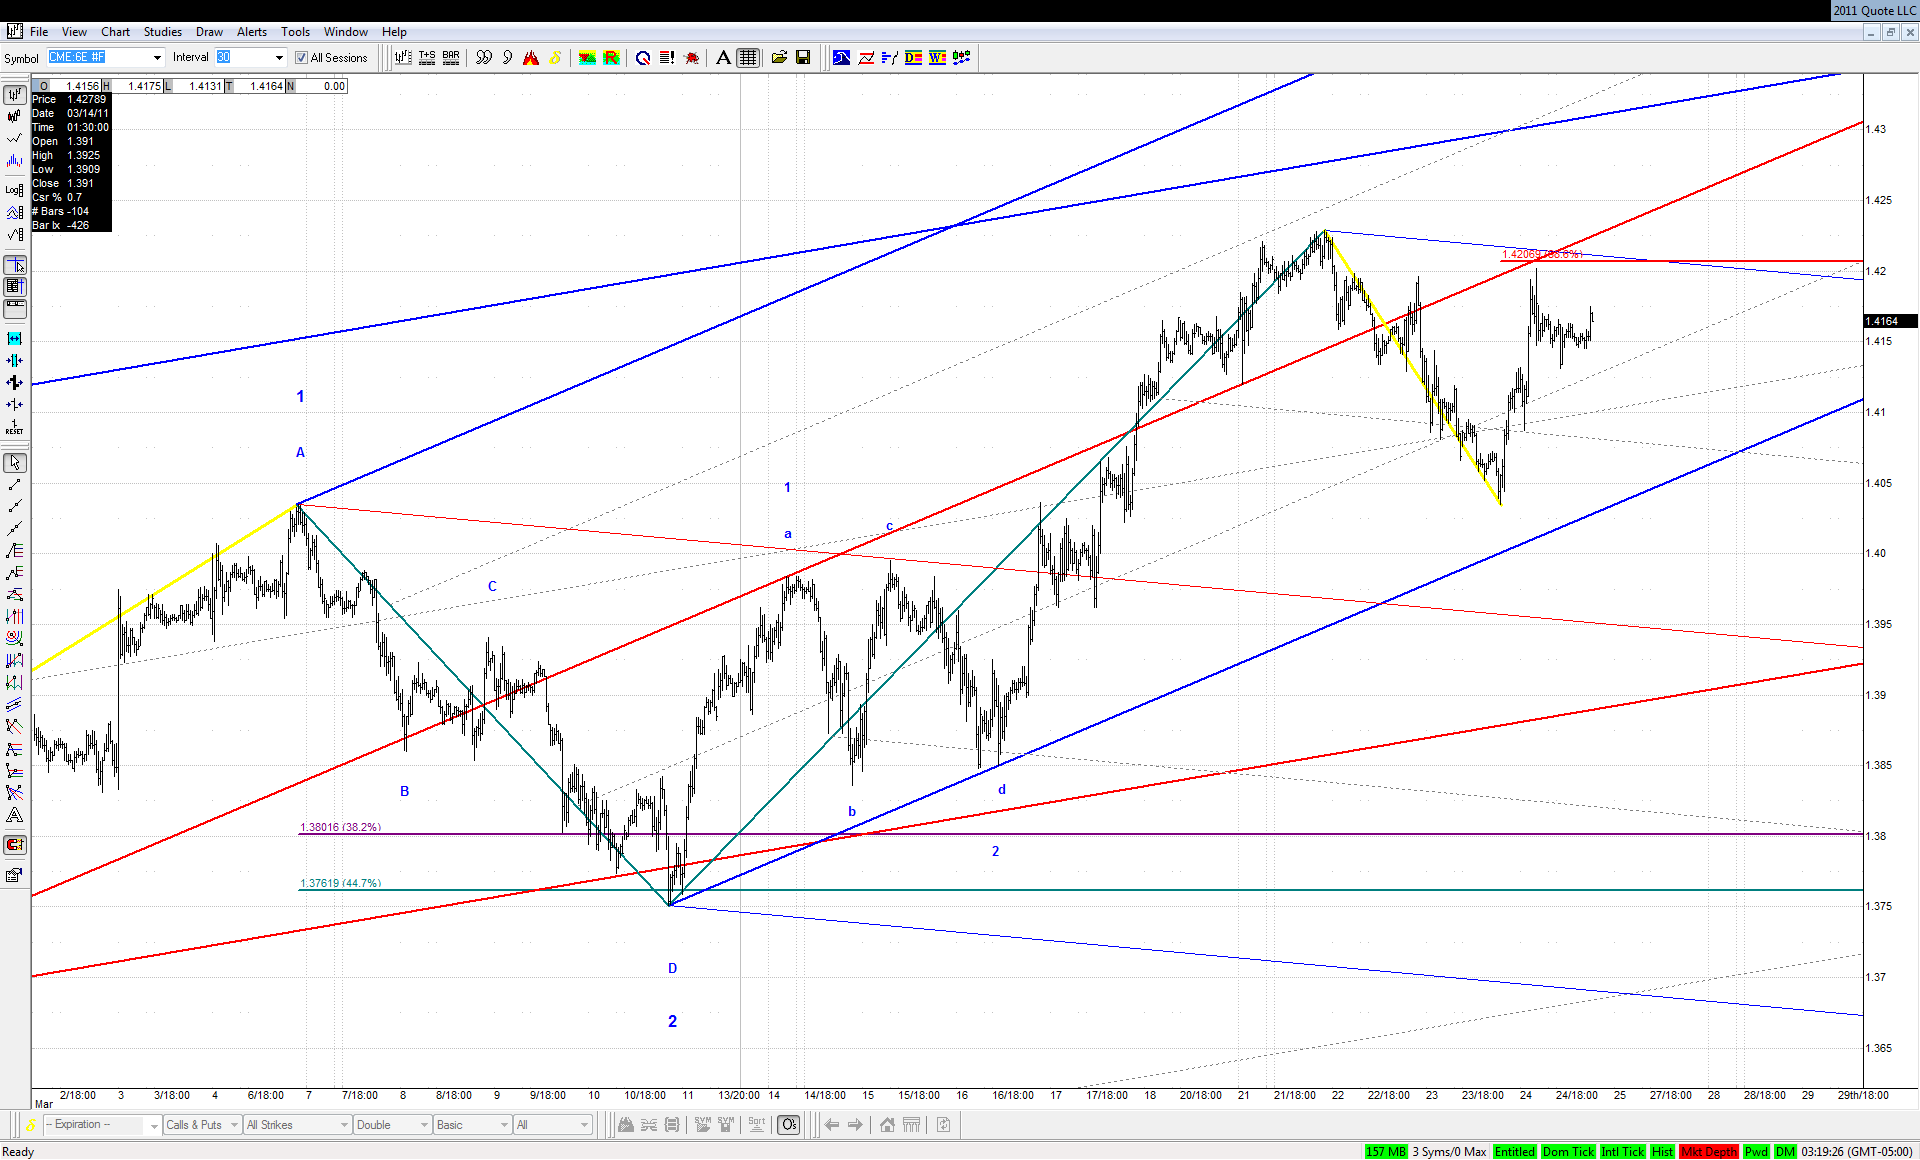
If EUR is still in its big W3 up then this .886 at lines confluence should be blown away to the upside:

Click image for original size
JA
jarek
Rep: 94
Posts: 3,474
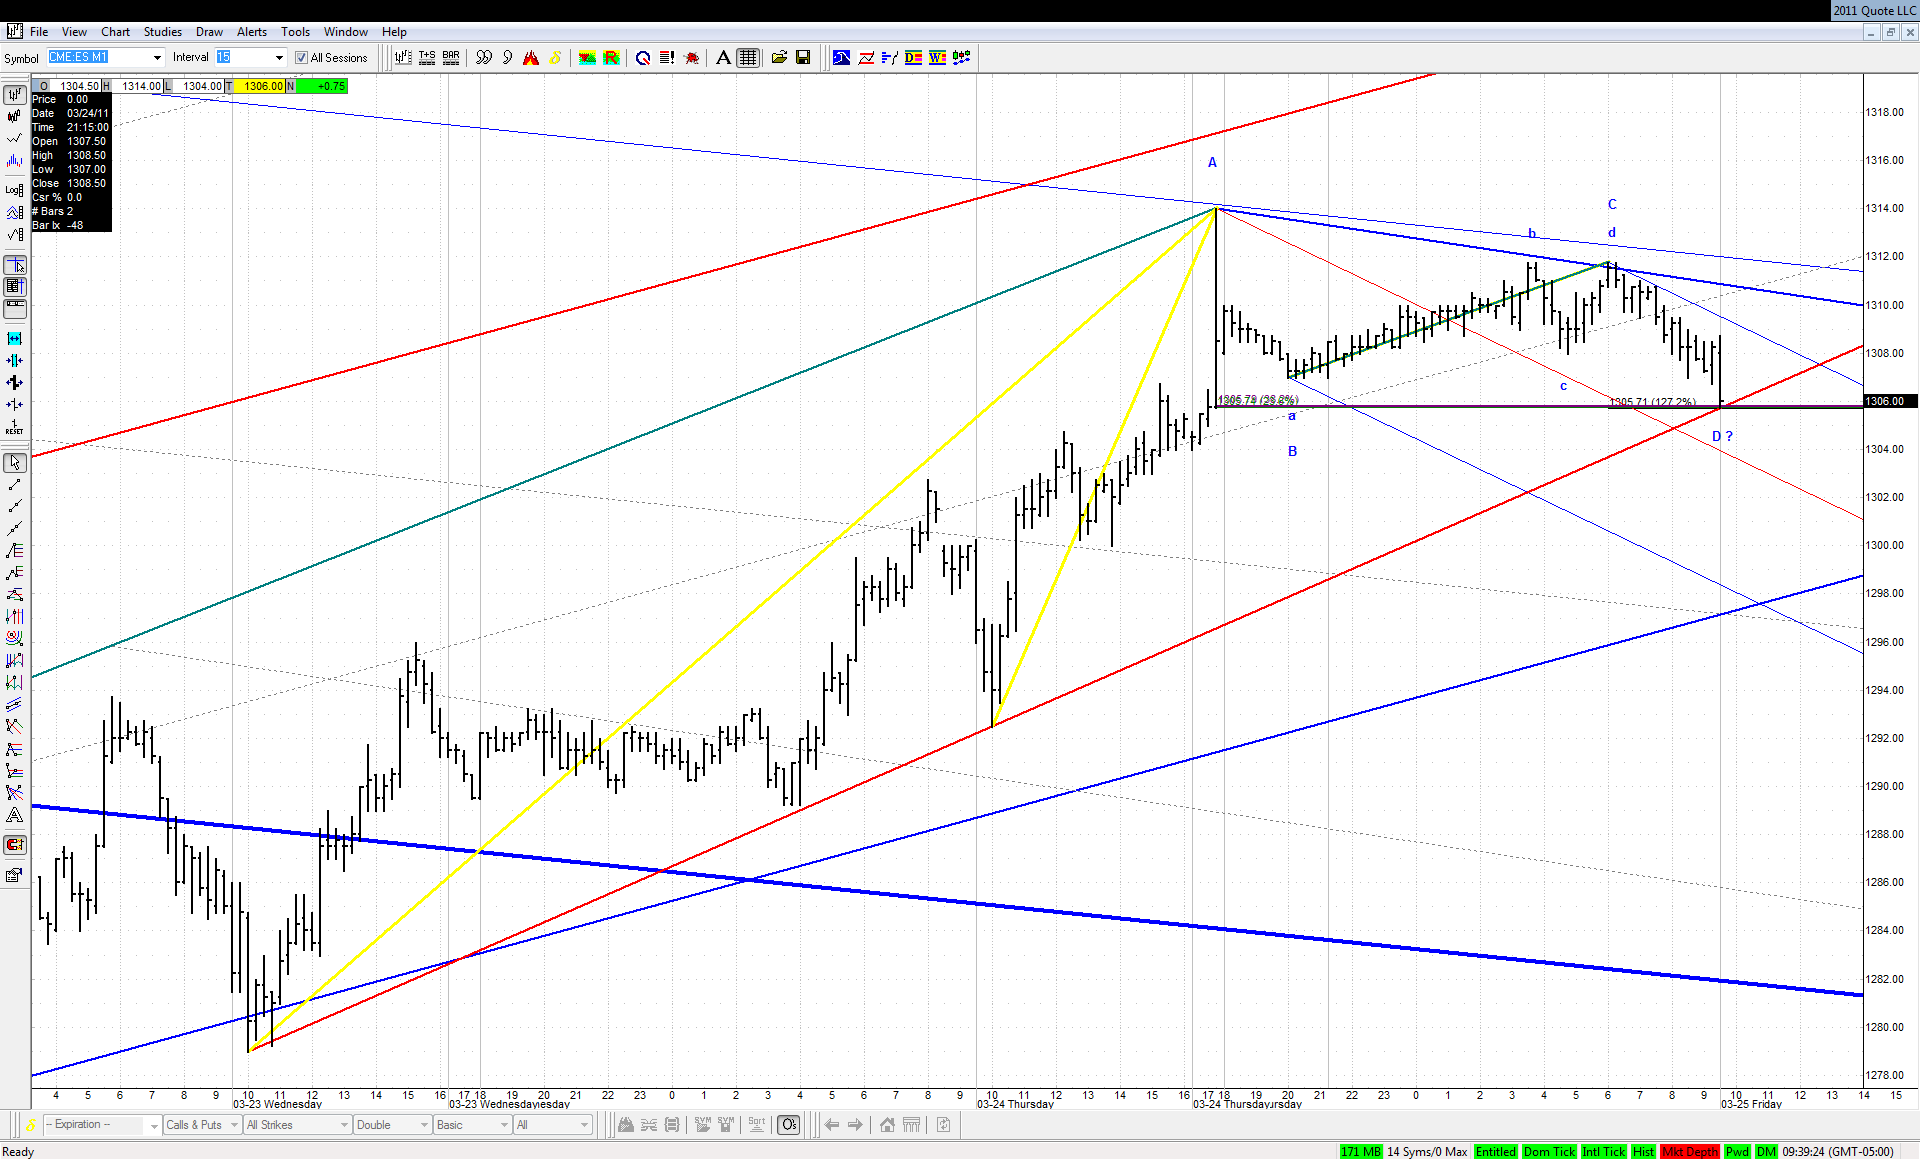
Maybe not very proportional, but still a bearish ABCD at lines for a possible test and retest:

Click image for original size


ES has problems with taking out this overnight spike's high. Has this climax move set a top of some importance?
JA
jarek
Rep: 94
Posts: 3,474
This move was very labored, but it finally reached the first target for the move off this bearish ABCD:

Click image for original size


At the same time it has formed a bullish ABCD at TL and reaction to it shall tell us something
JA
jarek
Rep: 94
Posts: 3,474
Originally posted by jarek

...Failure to reach it while being so close might be a sign of bulls' weakness

Break below the neckline should confirm at least a short term top in Crude:

Click image for original size
RA
rat89
Rep: 0
Posts: 7,015
you mean white bg vs blue? interesting...

Originally posted by tx_ches

rat89,
I like the color contrast on your last charts -easier on my eyes.