MyPivots
Sign In
JA
jarek
Rep: 94
Posts: 3,474
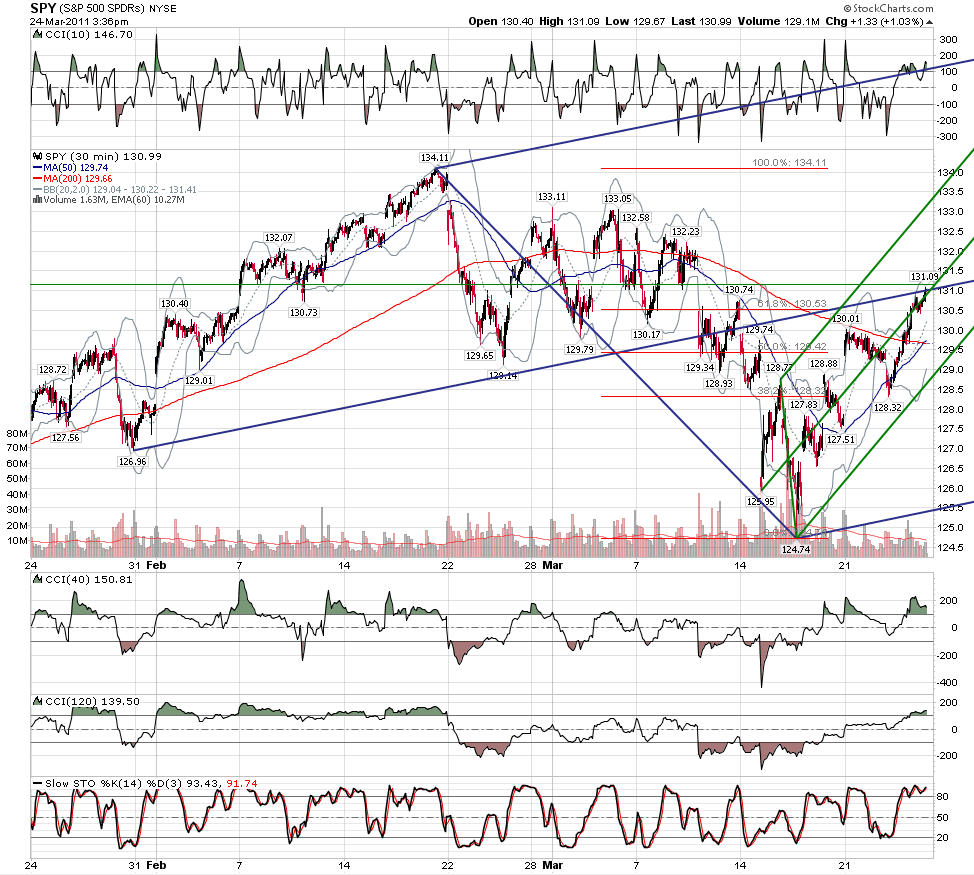
Can the recent high in February stay with us for quite longer than almost everybody is expecting at this point?

Click image for original size
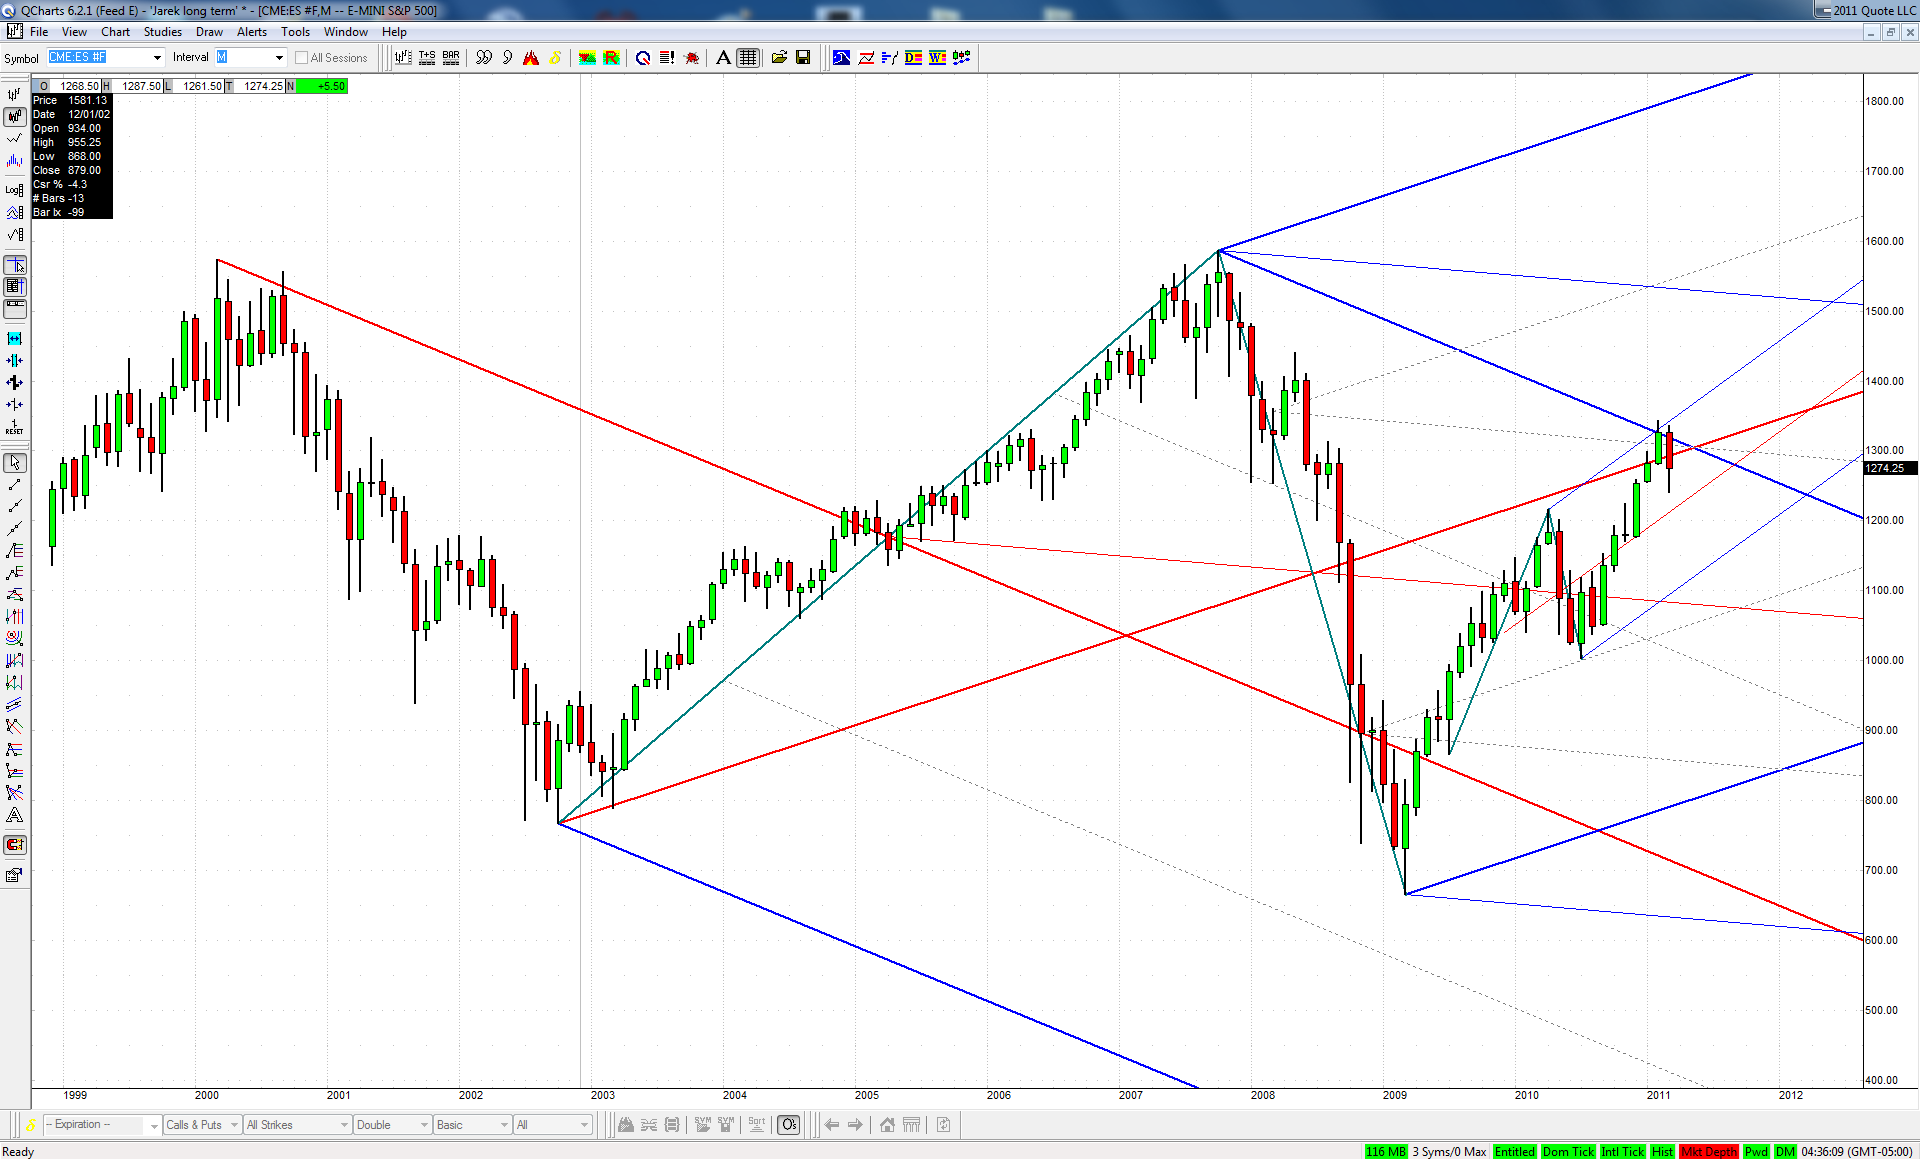

We may not know the answer to this question for some time to come, but in my opinion this is a viable alternative to consider!
ER
EricD
Rep: 63
Posts: 692
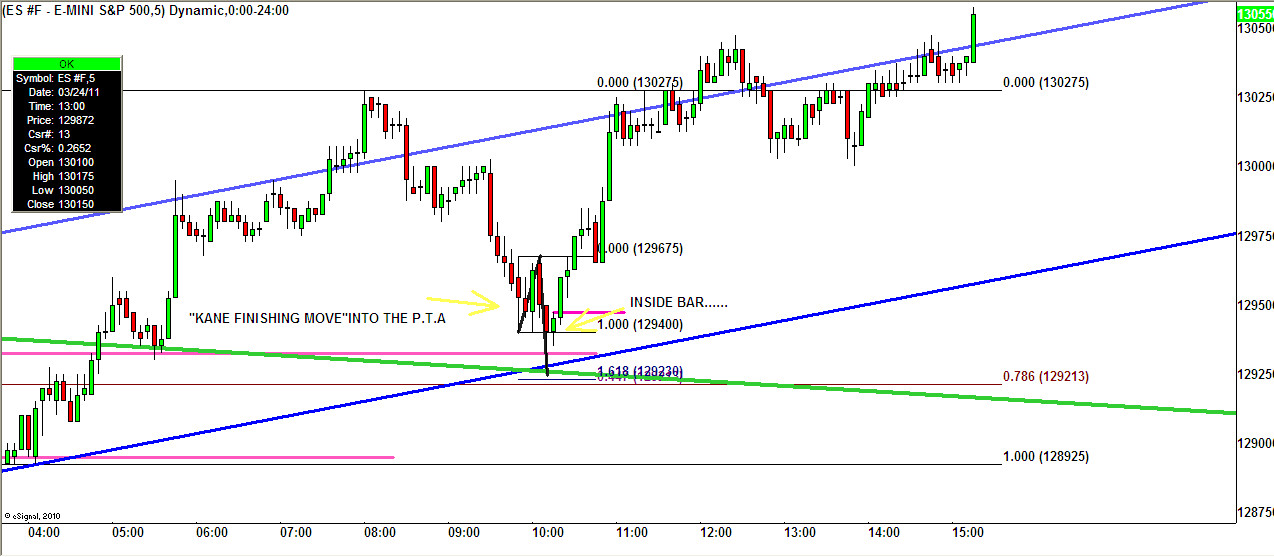
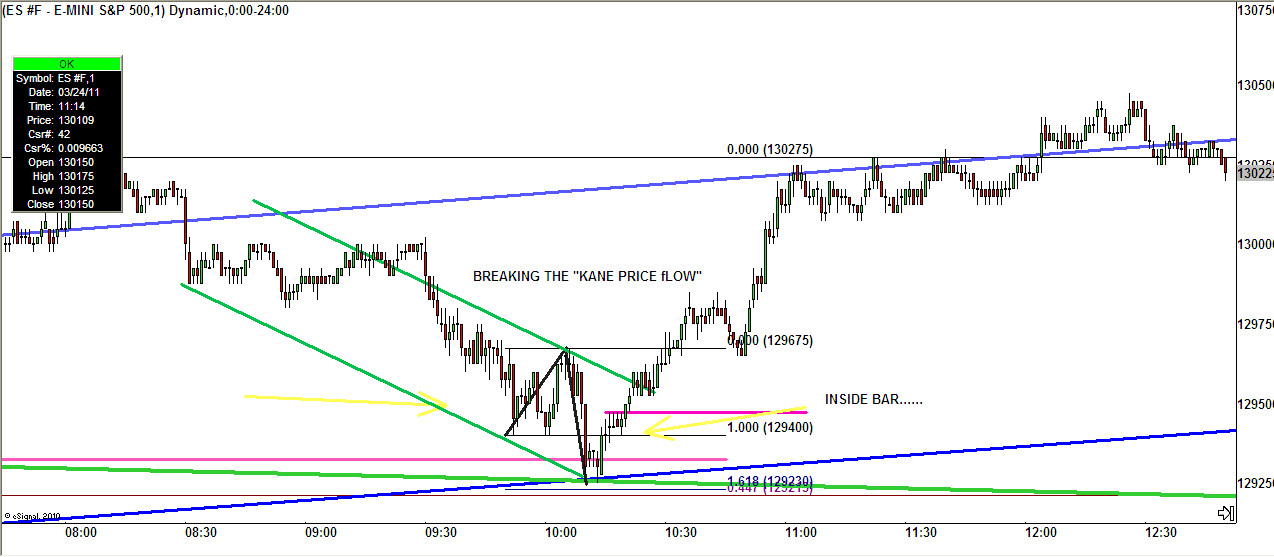
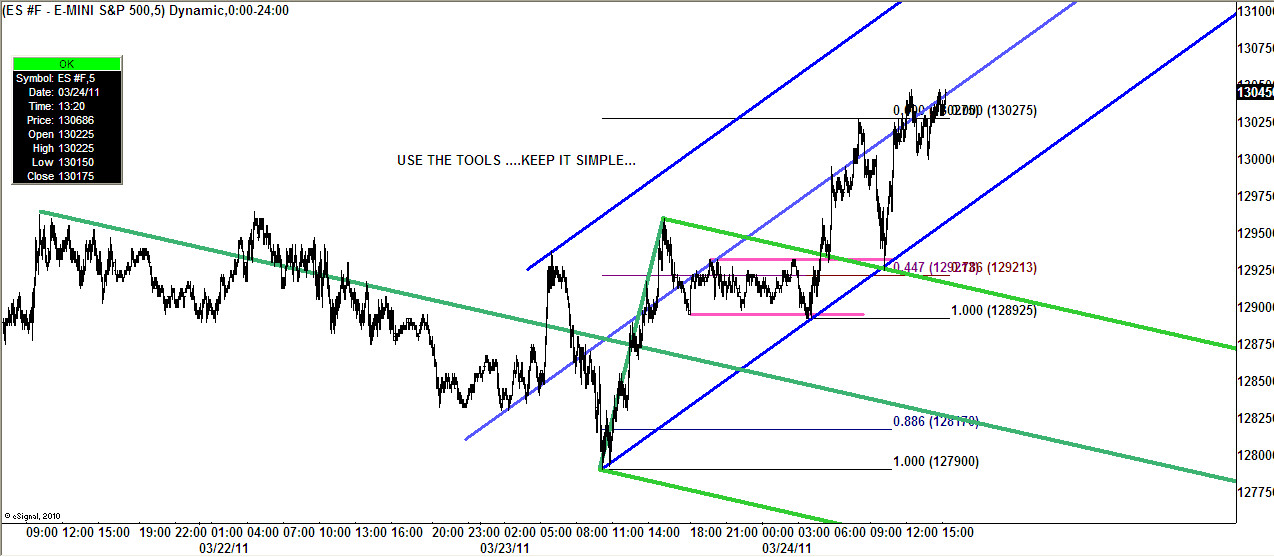
Click image for original size

Click image for original size

Click image for original size
ER
EricD
Rep: 63
Posts: 692
Originally posted by jimkane

Boy, did I read that little oinker just right (in my opinion)...
I would say more times than not.....
JI
jimkane
Rep: 3,058
Posts: 33,089
Ah, you had posted crude charts right before my comments. So, what it is doing on the tick chart has some 'context' for the readers. I suspect, tick chart only, that 104.85 may be it for that little flush.
ER
EricD
Rep: 63
Posts: 692
commodities giving back some........
ER
EricD
Rep: 63
Posts: 692
Jim...even though you had "DRAMA" these last couple of days....all your fellow traders in here are using the tools.
JI
jimkane
Rep: 3,058
Posts: 33,089
SLW is just fascinating. Notice the move off that overextended bearish ABCD Eric showed. That is now right into a key area. So, it gaps up over the immediate area it had (although joed's shown area is so wide it was still within that zone, I wish he'd post how he got in that short, with such a big jump up), then sells off hard, as somewhat expected. Now it is primed for a leg up to the upper area. But, silver did push up to its SL, and really, really needs a bigger checkback. But, if a slow, grinding short squeeze is on, it may keep going. What SLW does right in here, at this 43.38 low (and also possibly it may shoot for the key .382 area at 42.81-.42.89), that's the key. This will tell me a lot, and a lot way beyond the one stock, SLW...
ER
EricD
Rep: 63
Posts: 692
that is why in my opinion the thoughts that you and Roofer evoke are so much deeper into the foundation of trading in real life situations. Thanks for pointing it out...
RA
rat89
Rep: 0
Posts: 7,015
green line is the .685....you have to wonder what's in the cards here...whether that's the b

Click image for original size
JI
jimkane
Rep: 3,058
Posts: 33,089
Thanks, yes, there are a handful in here really getting it done. And that's what I need to focus on. I do feel a big burden lifted now that I no longer post 'out there', or read 'out there', both here at MyPivots or anywhere else. Just no burden that any second someone may shred me. Try to make me feel like I'm scum. If they could only see what we do in here, what we know, how we act... But they never will. And for that I'm actually becoming thankful, not resentful.


Originally posted by EricD

Jim...even though you had "DRAMA" these last couple of days....all your fellow traders in here are using the tools.
JI
jimkane
Rep: 3,058
Posts: 33,089
And up it goes, right off that low. Basis K1.


Originally posted by jimkane

Ah, you had posted crude charts right before my comments. So, what it is doing on the tick chart has some 'context' for the readers. I suspect, tick chart only, that 104.84 may be it for that little flush.
RA
rat89
Rep: 0
Posts: 7,015
you mean white bg vs blue? interesting...

Originally posted by tx_ches

rat89,
I like the color contrast on your last charts -easier on my eyes.