ES numbers for 3-29-11
Numbers generated from todays trade based on volume
1312.50 volume spikes ****
1310.25 Volume spikes ****
1307 Volume spikes
Old ones you should have on your radar from previous days:
1300 - 1301
1295.50
1291 - minor
1287.50 ****** major number
1282.25 ******
1312.50 volume spikes ****
1310.25 Volume spikes ****
1307 Volume spikes
Old ones you should have on your radar from previous days:
1300 - 1301
1295.50
1291 - minor
1287.50 ****** major number
1282.25 ******
here's the chart i was supposed to show in my previous psot
Click image for original size
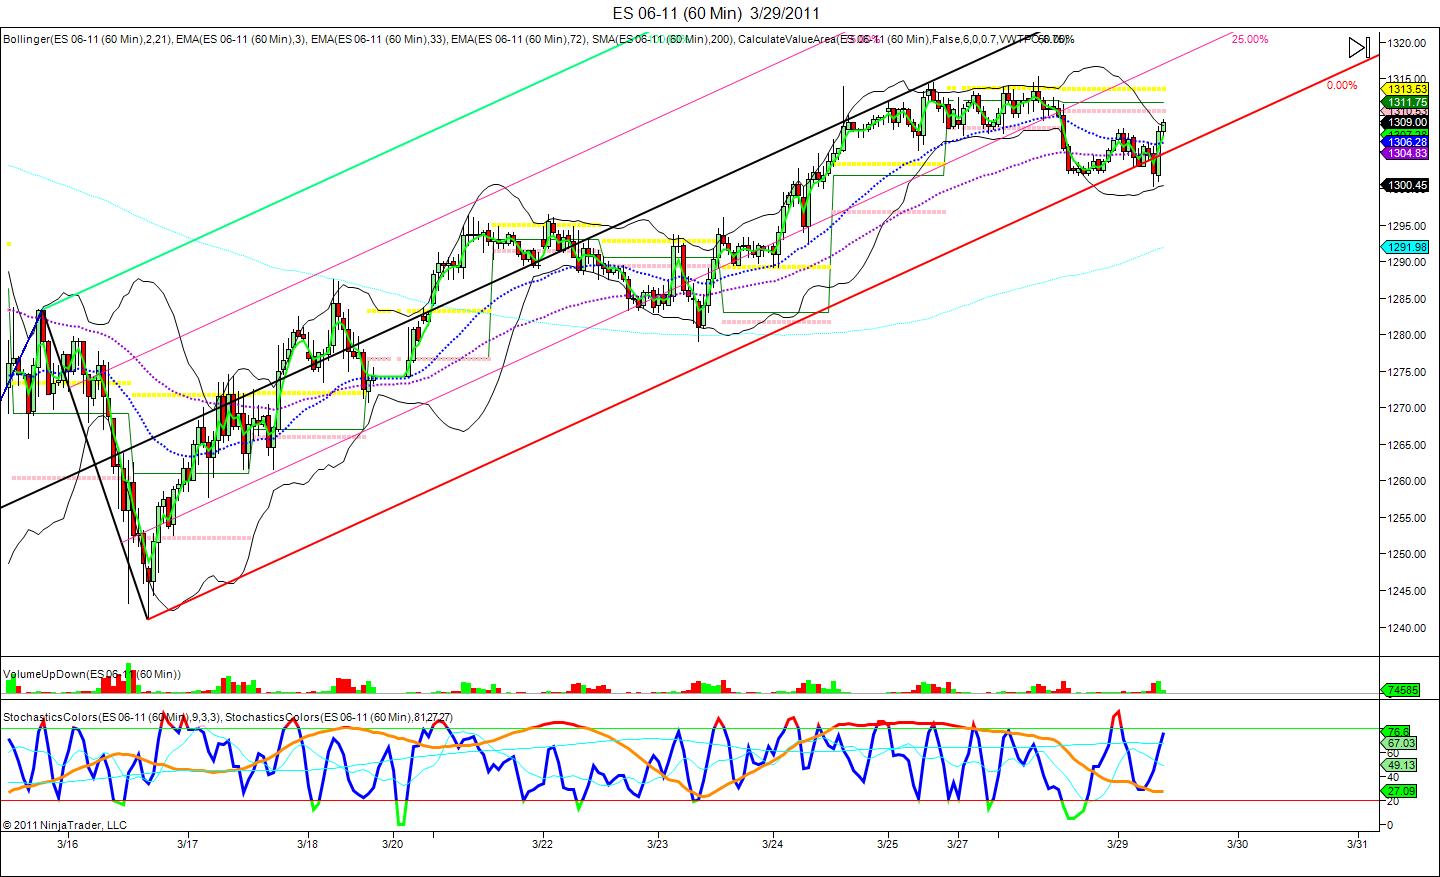
we should hit some hit some resistance here at 10.50 but if they can move through it, i would think we are on to 1314 next
short to sell above the current high in the 1311.25 to target 09.25......12.50 is next magnet up....to lean on
new highest volume bar is at 1310.75 price so we sell above that looking for the retest...so adding at 1312.50 if it comes....keeping this relatively small...would like to see trade get below that node...09.75 is now first target for me
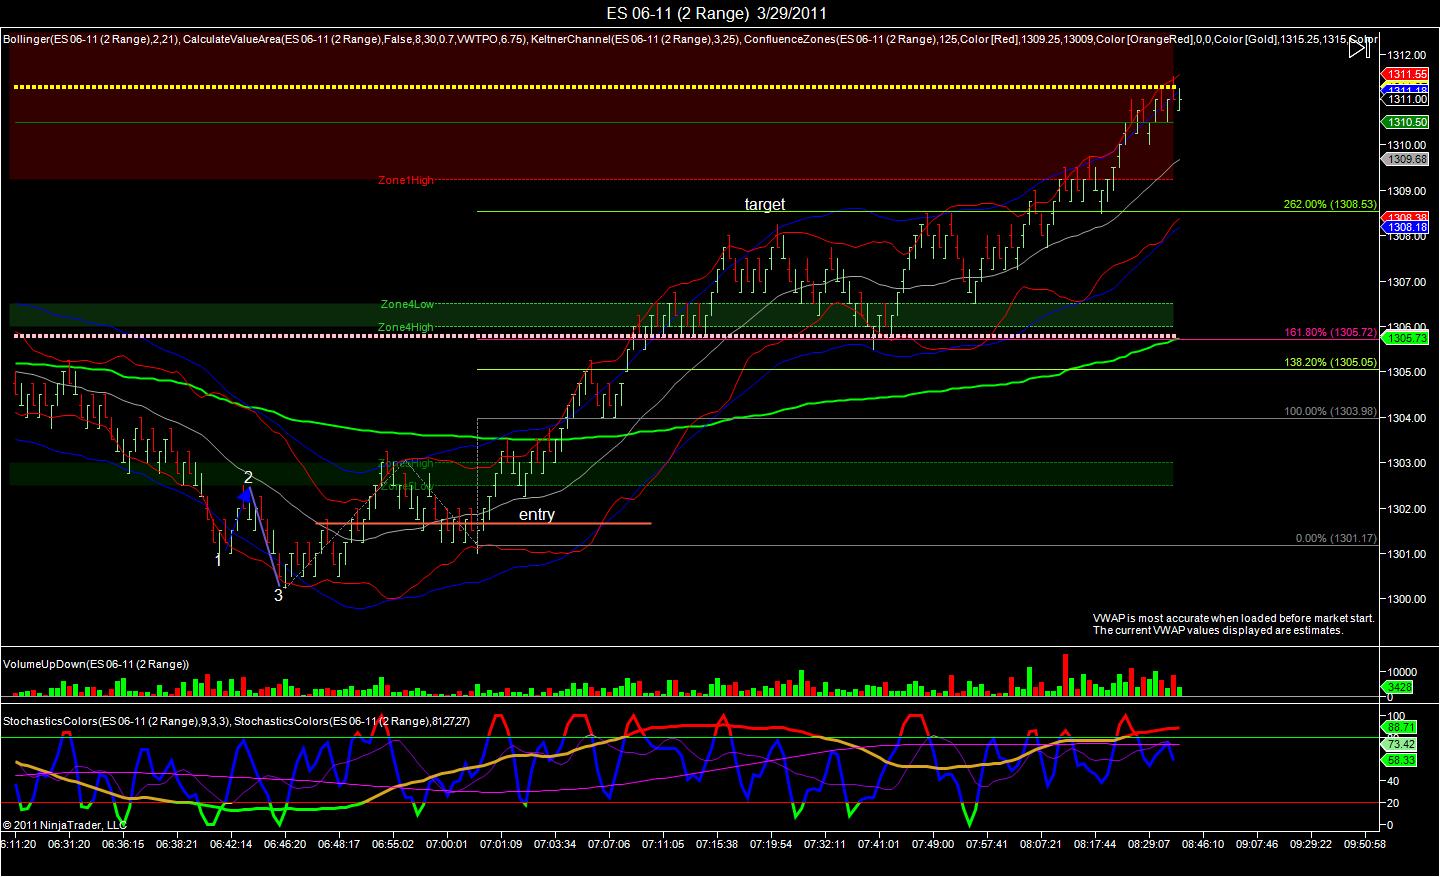
i agree.. here's my scalp chart it is a 2 range chart, showing value is topped today at 1311.25 and poc 10.50 i am trying a short here @ 11.50 or where i can get in with a target of 1308.50 or the otherside of the keltner channel
Click image for original size
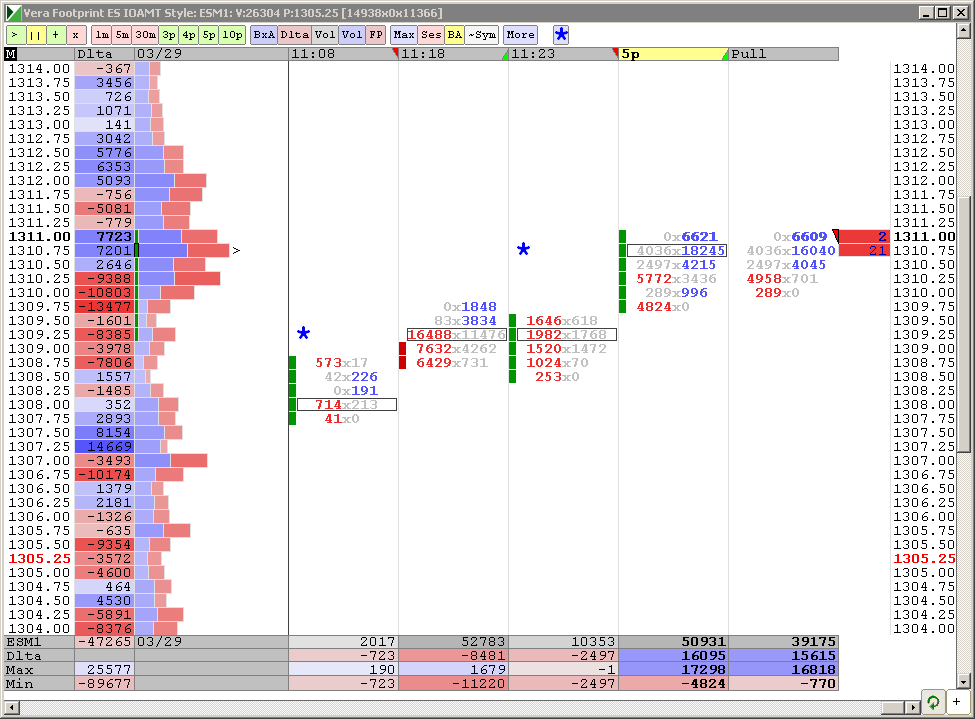
cool to watch how the volume is trying to build at 10.75...Lisa I'm showing 07.50 as POC from TOdays trade only but 1310.25 is POC from Yesterday....and we both have IB data...interesting
nice volume and delta divergence up here but still not convinced 12.50 is out of the question...just don't like the way they are letting 09.75 go unfilled....I need that to print ...lunch time...but the delta is showing less green and more red up here....so in theory buyers are less agressive than sellers....and I'm only typing this in here because it helps me to remember...I'm sure this is old stuff to u delta pro's..LOL
I find the difference in Delta reading from different posters very confusing. Bruce and I should have similar numbers, considering we both use IB, but that is not the case. Maybe our charts set up differently. Would be good to discuss .
Originally posted by BruceM
cool to watch how the volume is trying to build at 10.75...Lisa I'm showing 07.50 as POC from TOdays trade only but 1310.25 is POC from Yesterday....and we both have IB data...interesting
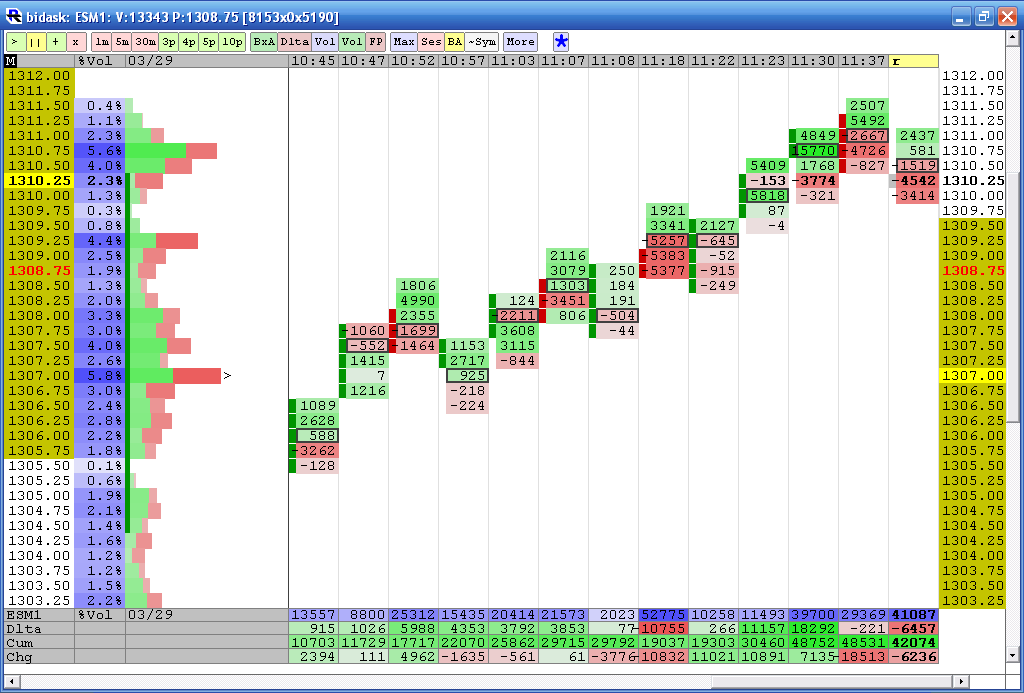
here is what I'm looking at lisa...it's a 4 tick range chart ala PT emini.....but look at the left side.....POC at 1307 but they are trying to make 1310.75 the new POC...and look at the WHOLE at 09.75...only .3 % volume there....Look what happened at the Whole at 05.75...only ,1 % volume there and we rallied....so I want to see 09.75 fill in before new highs...
you can also see green getting lighter as red gets brighter at highs...I know you know that stuff Lisa so that is really for anyone who is a newbie like me to Delta
you can also see green getting lighter as red gets brighter at highs...I know you know that stuff Lisa so that is really for anyone who is a newbie like me to Delta
Click image for original size
closed my short. took 1 pt loss.
Emini Day Trading /
Daily Notes /
Forecast /
Economic Events /
Search /
Terms and Conditions /
Disclaimer /
Books /
Online Books /
Site Map /
Contact /
Privacy Policy /
Links /
About /
Day Trading Forum /
Investment Calculators /
Pivot Point Calculator /
Market Profile Generator /
Fibonacci Calculator /
Mailing List /
Advertise Here /
Articles /
Financial Terms /
Brokers /
Software /
Holidays /
Stock Split Calendar /
Mortgage Calculator /
Donate
Copyright © 2004-2023, MyPivots. All rights reserved.
Copyright © 2004-2023, MyPivots. All rights reserved.