ES 4-7-11
ghost town today..starting short s at 34.50..Volume spike.....into old VPOC...33 is inititial target
here is one last video...again please let me know if there are some basic truths I am missing...Lisa , I hear your comments about the block traders etc....I am in the process of comparing the readings with the way I am looking at the footprint to see if there are different readings...thanks for the input
thanks bruce for taking the time to do these videos...they are of great help !
There is a software thread somewhere so I'd post your question there too....I'm surprised more haven't responded...must be a slow day...I just use a basic version of Investor R/t that I have had for a few years......I guess it all comes down to what you like visually and how much you want to spend on software. Many Like Ninja and I think you can get a lifetime MP license for $249....
Originally posted by Boola
In the spirit of Bruce's questions about Mkt Delta, I would like to know where I should post questions I have with respect to the various charting packages and data providers you are all using for Mkt Profile analysis. Is this the place to post those questions, or should I post them in some other part of the Forum?
I have been trading for years, and late last fall I began to take an interest in learning more about Mkt Profile. I have conducted a ton of research, such as the use of Mkt Delta Charting with Data from Infinity, or using Investor RT with DTN data, etc, etc. I am sure you who have been trading Mkt Profile for a long time have also done your homework, so I would love to hear "why" you made the choices you made, what you would do different if anything, etc.
Thanks again for any sharing you can provide here.
looks like lots are trying to get short above 27.75...it will be interesting to see what happens near this peak volume price....I'm always wondering what happens when all these folks have it wrong....what are the MD clues that the selling isn't real..?
Thanks Bruce, I appreciate your response.
I currently use Ninja as a Simulator and Replay front end, for some of the deficiencies that exist in TradeStation. Although TS has now made the whole Sim deal part of their platform, but still no way to "Replay" the market and do some homework, backtesting, etc, after hours so to speak. My information my be a few months old, but the last time I checked, Ninja's MP solution did not allow you to "Merge" profiles, which I am fond of doing, although still learning this myself. I may have to check them out again as perhaps that software add on has changed since the last time I looked at it.
Speaking of outdated information...I thought Market Delta was the only one who could chart the "Footprint"? I did not realize Investor RT would do this as well. I had been leaning toward using Market Delta because of this, as well as I have enjoyed their weekly videos that they do to explain how to use their platform. They are certainly the most expensive though, from what I have found anyway.
Thanks again for your input and willingness to share. Once I get my charting figured out, I will be able to post some pics and videos in here as well, to seek some feedback like you are doing.
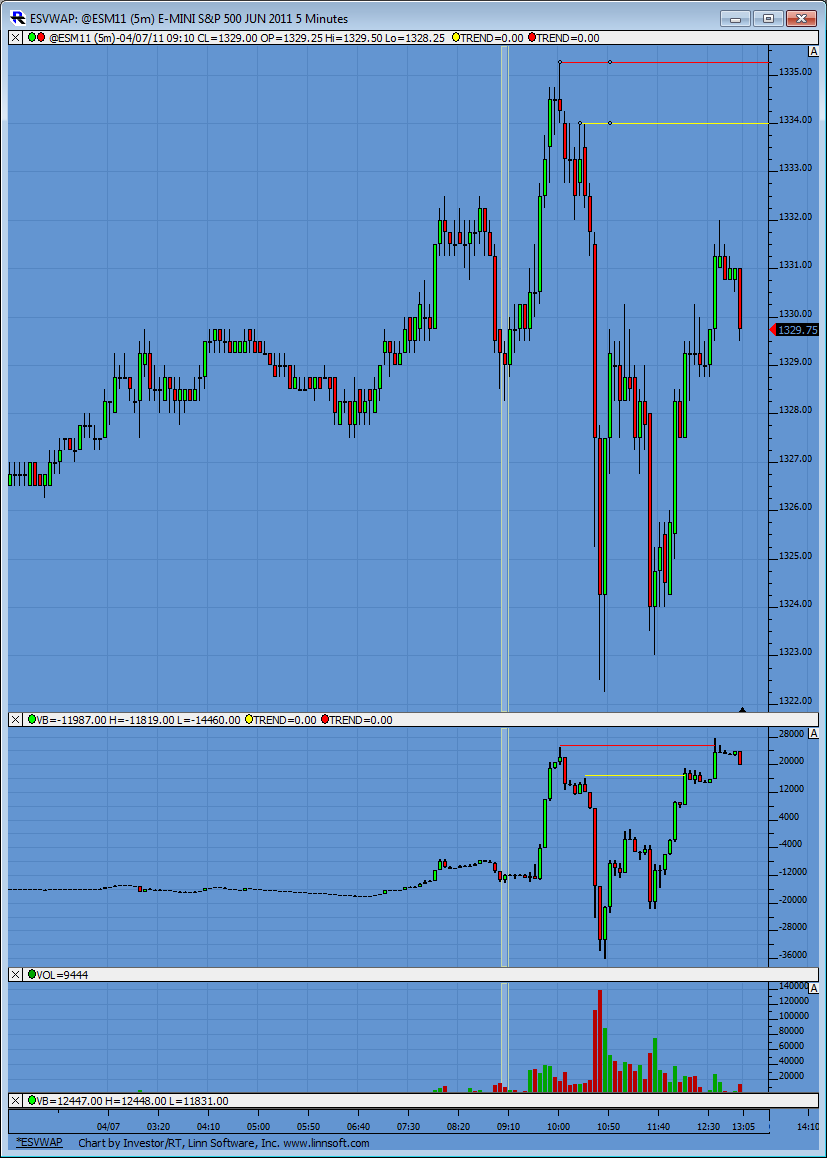
Ok Bruce here is a chart with cumulative delta plotted rather then the footprint but the two are representations of the same data.
I have put two trend lines on the chart on both price and CD. Red corresponds to red. Yellow corresponds to yellow.
So in your trade at 1330 CD had come up and challenged the yellow trend line but not on price. Your short certainly could have worked, but like you said, some trades just don't work.
However, there was a higher level or threshold of CD above the yellow trend line I have marked by the red trend lines. This was formed by the RTH high of the day so in my view is a significant level of interest.
When the red trend line on CD was taken out but price still remained lower this is where I watch very carefully. It's representing a serious resistance point being tested and if price is going to continue higher the CD should start to climb well above the old Red trend line threshold.
In fact, in did just the opposite as you observed nicely in the footprint video....
Let me know if I can explain it better.
Click image for original size
Bruce,
Even before I began to focus on the Auction Market Theory of trading, and I am still a novice at that, I was a big proponent of following "Volume" and it's rate of change. So I think you are absolutely right in your thinking, with respect to watching how Buyers and Sellers are accepting Price at various levels. I find the more Confluence I have at various areas of Price discovery, the more solid the trades tend to be. The only thing I would add to your last video, is that when Price gets back close to the day's Open, I tend to be careful, as this was where the market first began it's sense of value, where traders drew their line in the sand if you will. Again, back to Confluence, that area was also where ydy's POC and VAL sat, among other things I watch for in terms of Confluence, such as Adv Dec, vs Tick, etc.
Anyway, thanks again for the input on the software, and keep up the good work.
thanks Lorn..I get it...this is interesting up here because the Big traders seem to be getting short while the small traders seems to be pushing it up..
so here I'm just trying to see if the whales will win out over the smaller traders
so here I'm just trying to see if the whales will win out over the smaller traders
and that's one I'll be printing out Lorn...thanks for that..
that was cool how they ran it back to the OR and the whales were selling into that or so it seems....back to peak volume price of 27.25.....
Thank you very much Day Trader. I will check them out over the weekend. Appreciate the sharing nature of the forums here. Have a solid trading day and a great weekend coming up!!
Emini Day Trading /
Daily Notes /
Forecast /
Economic Events /
Search /
Terms and Conditions /
Disclaimer /
Books /
Online Books /
Site Map /
Contact /
Privacy Policy /
Links /
About /
Day Trading Forum /
Investment Calculators /
Pivot Point Calculator /
Market Profile Generator /
Fibonacci Calculator /
Mailing List /
Advertise Here /
Articles /
Financial Terms /
Brokers /
Software /
Holidays /
Stock Split Calendar /
Mortgage Calculator /
Donate
Copyright © 2004-2023, MyPivots. All rights reserved.
Copyright © 2004-2023, MyPivots. All rights reserved.