MyPivots
Sign In
JA
jarek
Rep: 94
Posts: 3,474
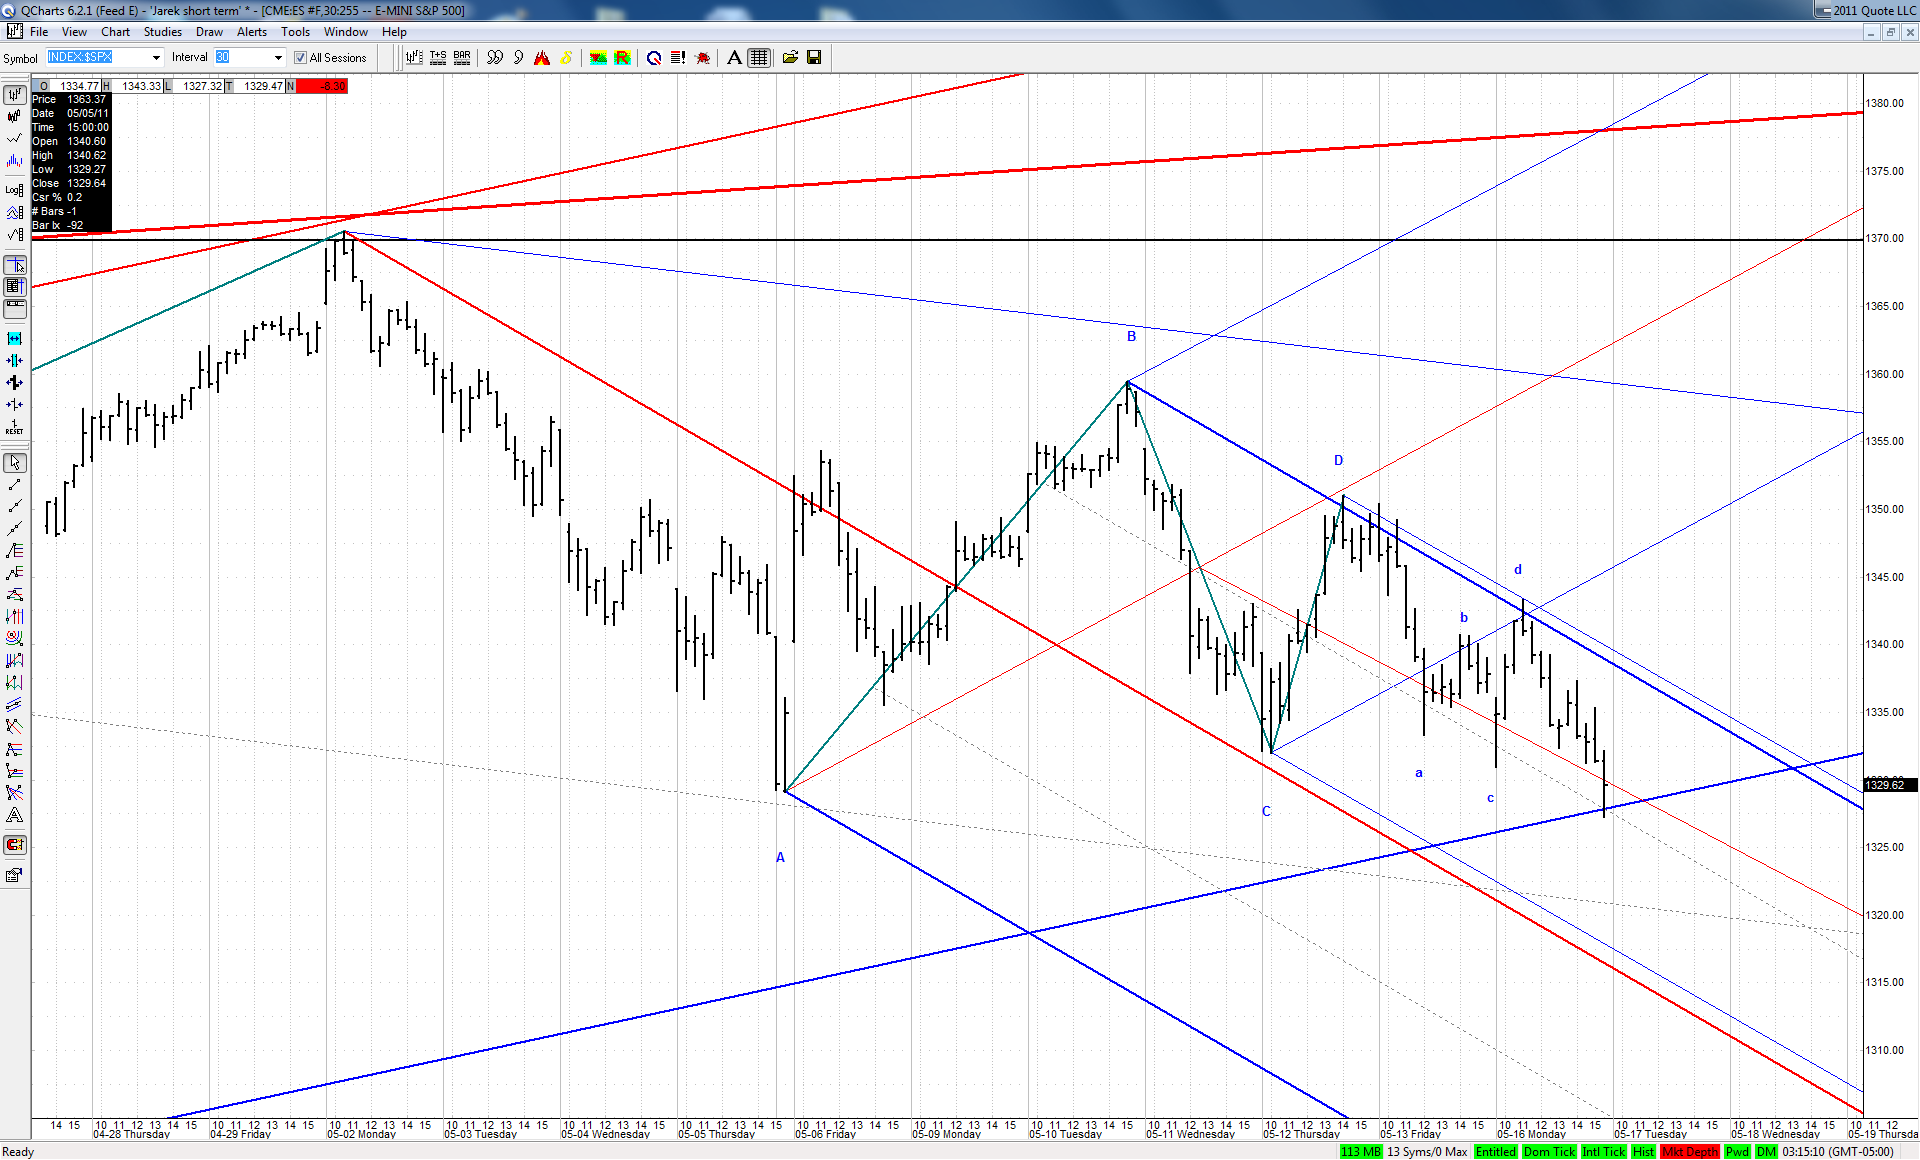
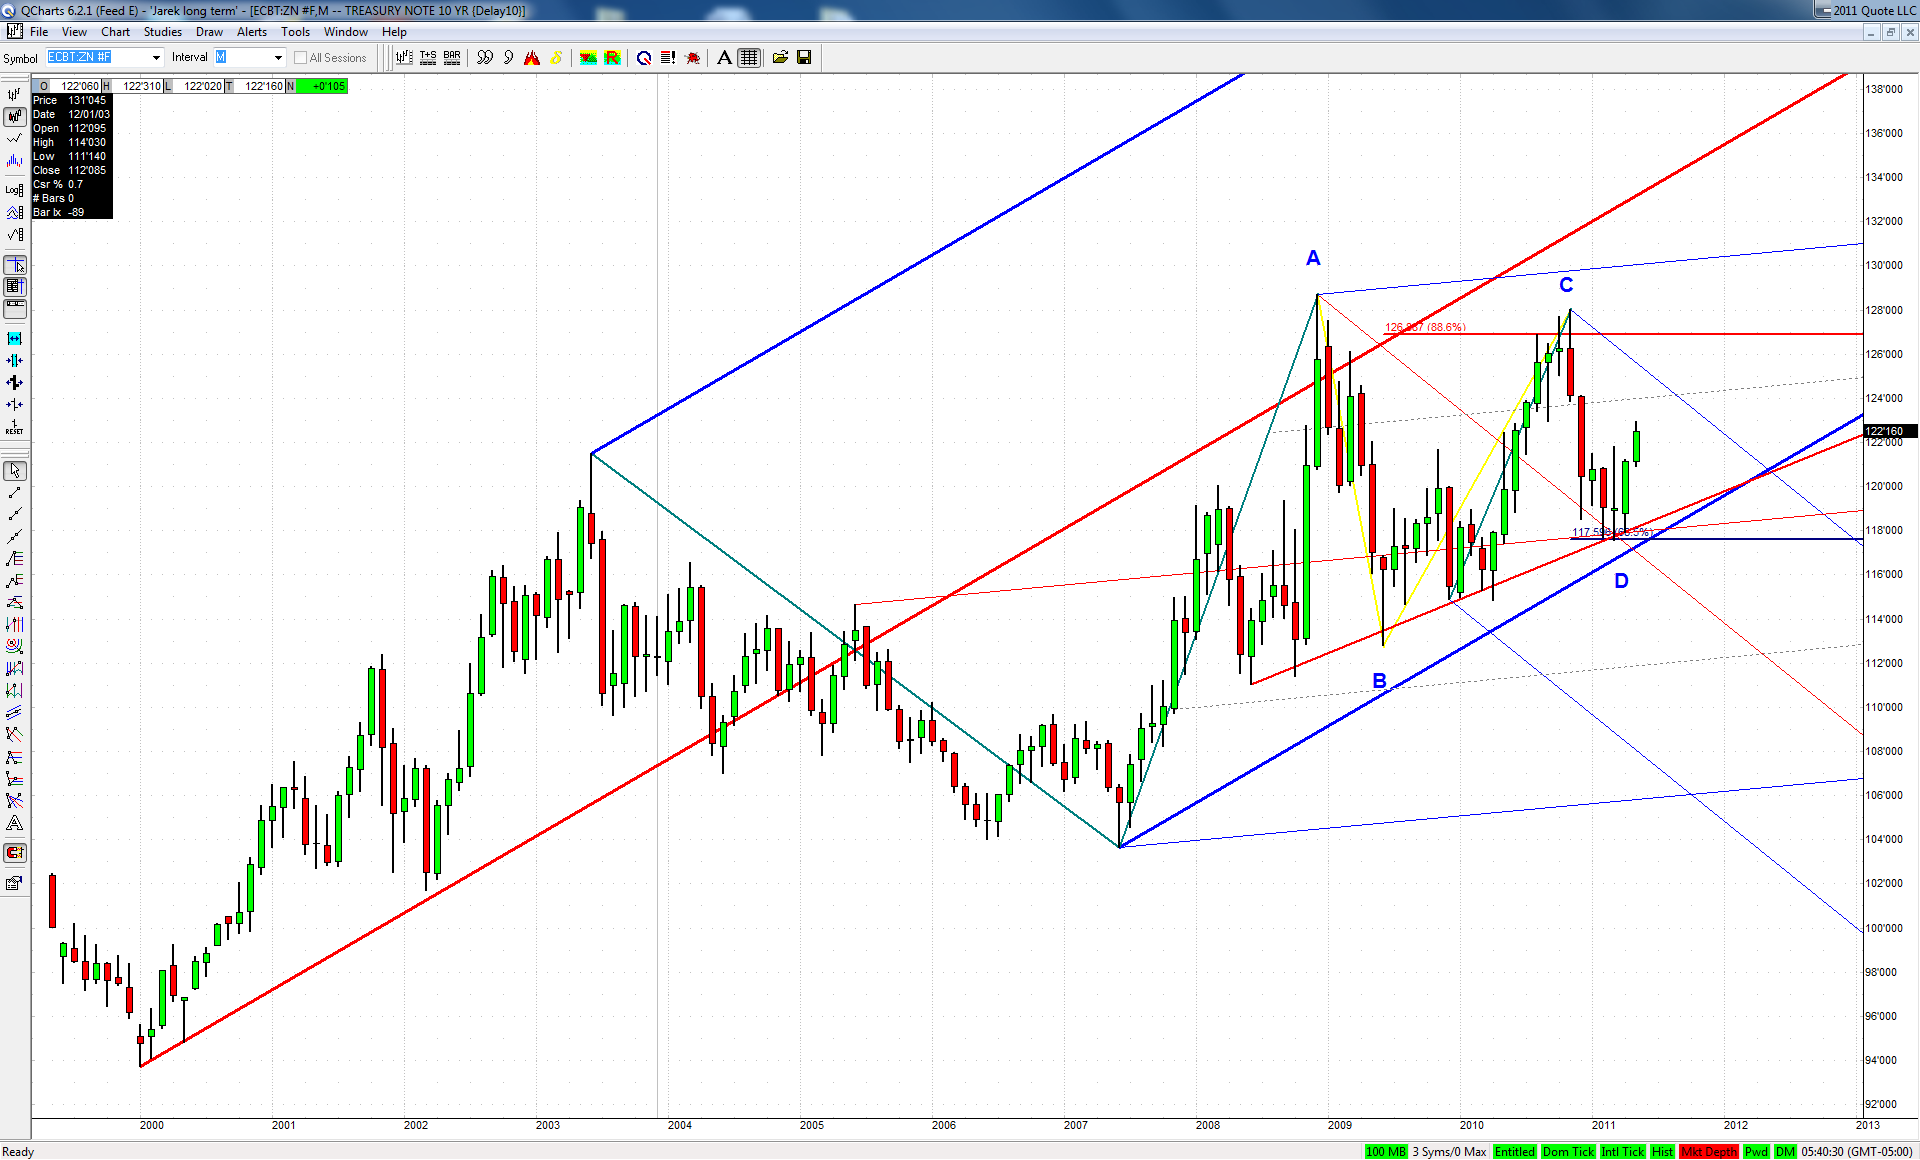
With the bearish case on Bonds being so touted recently I'm wondering whether it's not a big smokescreen suggesting that quite opposite may happen... Especially after looking at the following charts:

Click image for original size
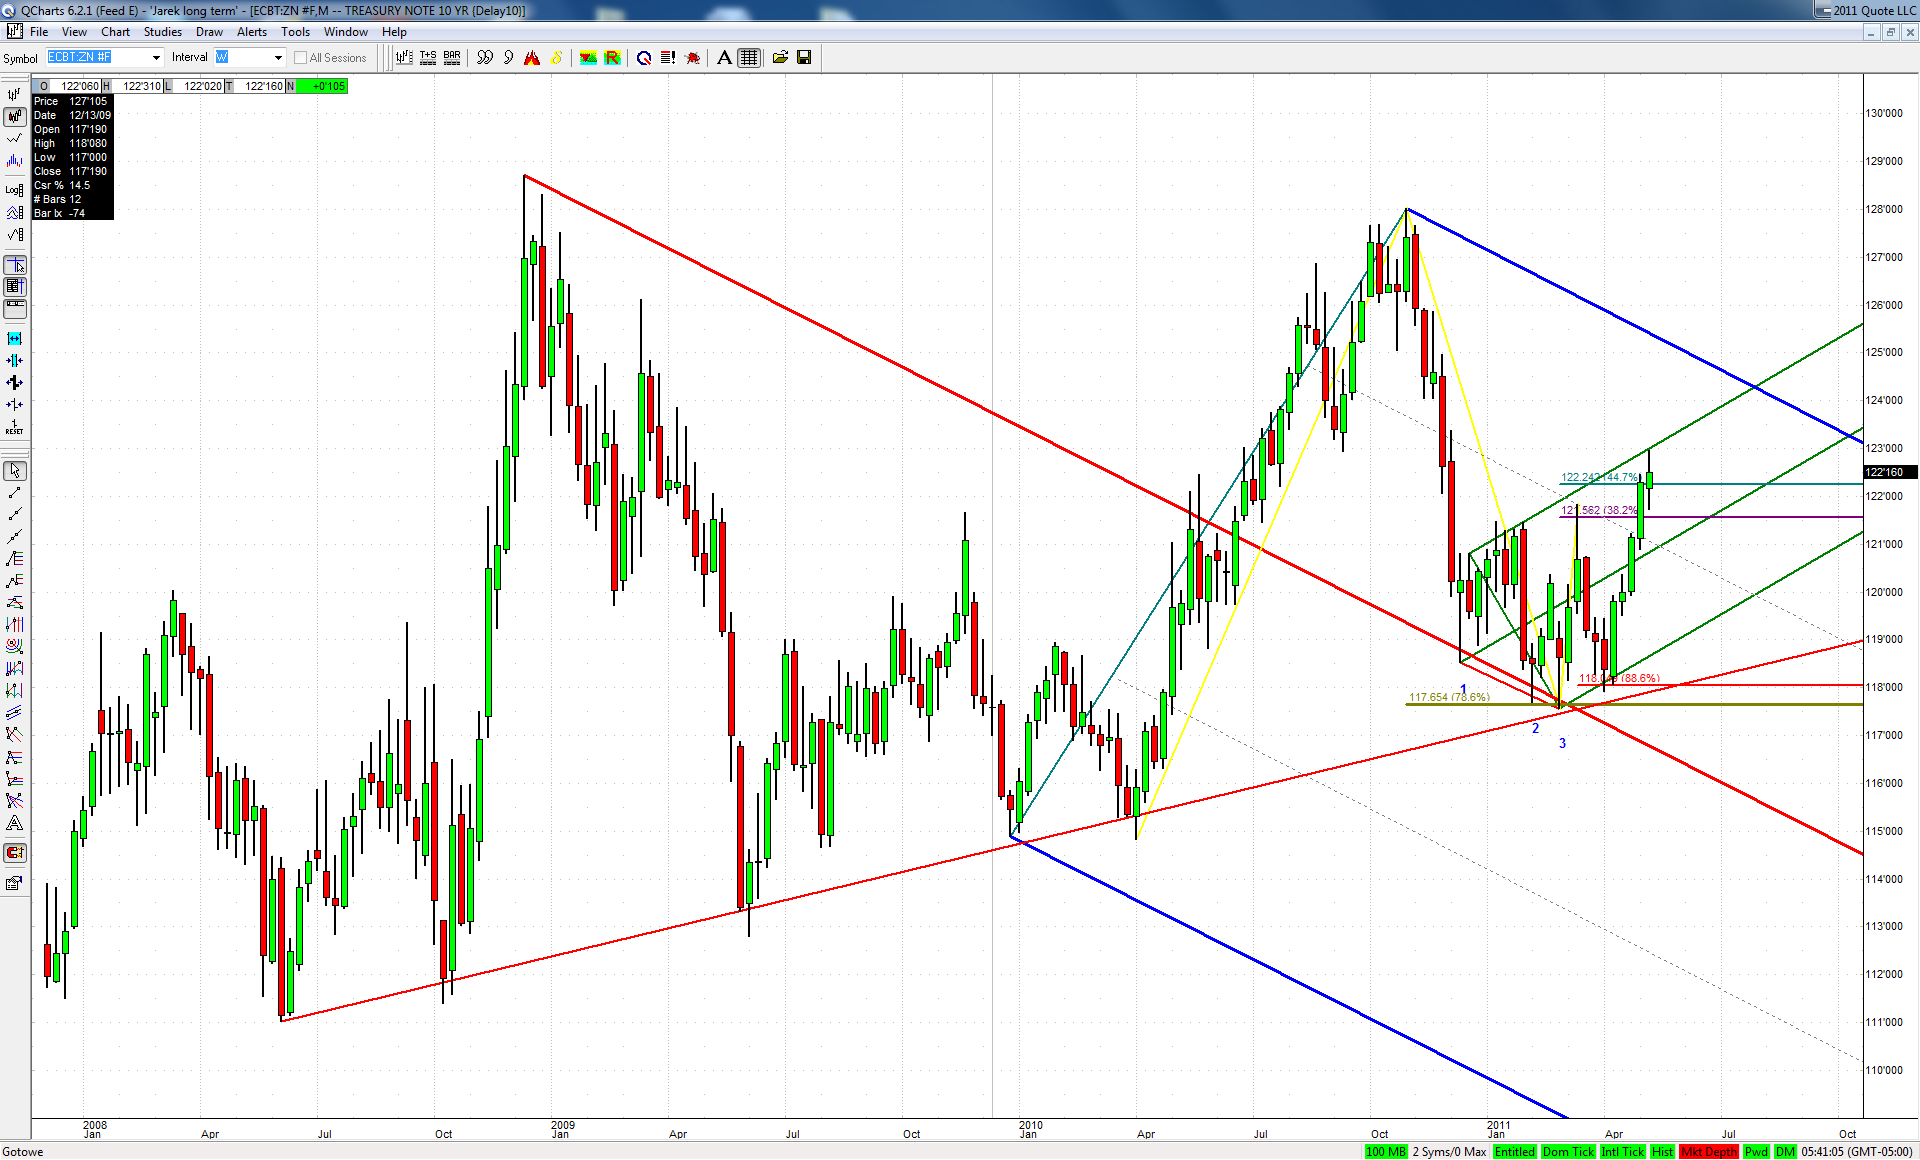

Click image for original size
RA
rat89
Rep: 0
Posts: 7,015
I hope you included the picture


Originally posted by jimkane

While waiting on this to collapse, and giving my short-side bias a chance to fully play out, I updated the terminology page with 'WAG' as per jarek's request, and also 'Too easy'.
JI
jimkane
Rep: 3,058
Posts: 33,089
That was an incredibly pathetic 'up' effort (right to the .382 of the first possible KZ). This thing is soooooo weak. That tells me the crush may be in the plans after all.


Originally posted by jimkane

I think 'up'.
JI
jimkane
Rep: 3,058
Posts: 33,089
Wow, look at that open in the ES futures! They dumped it alright, as expected. 20.50 so far. Loving the short-side bias, and the intermediate-term put plays. Is this really headed for the 1280 area? Recall my previously posted levels in between.
JI
jimkane
Rep: 3,058
Posts: 33,089
It is worthy of note that this 'breakdown' is right to a usual completion area off the HOD bounce up, and hence this may be the 'real' stop sweep, and up it goes. I still can't see it following the obvious top pattern I discussed... Watch the small bearish ABCD this may form in here for clues. I just take in the information it gives me at every step, and come up with a few scenarios to play against. That's really all I can do, I feel.
JI
jimkane
Rep: 3,058
Posts: 33,089
You know, when I look at that wedge/triangle (not defined in the classical technical sense) in gold, on say a 120-min chart, I can't imagine that breaking any way but down. With the manipulation games they play nowadays anything is possible, but technically, this 'should' break to the downside, I'd think.
JA
jarek
Rep: 94
Posts: 3,474
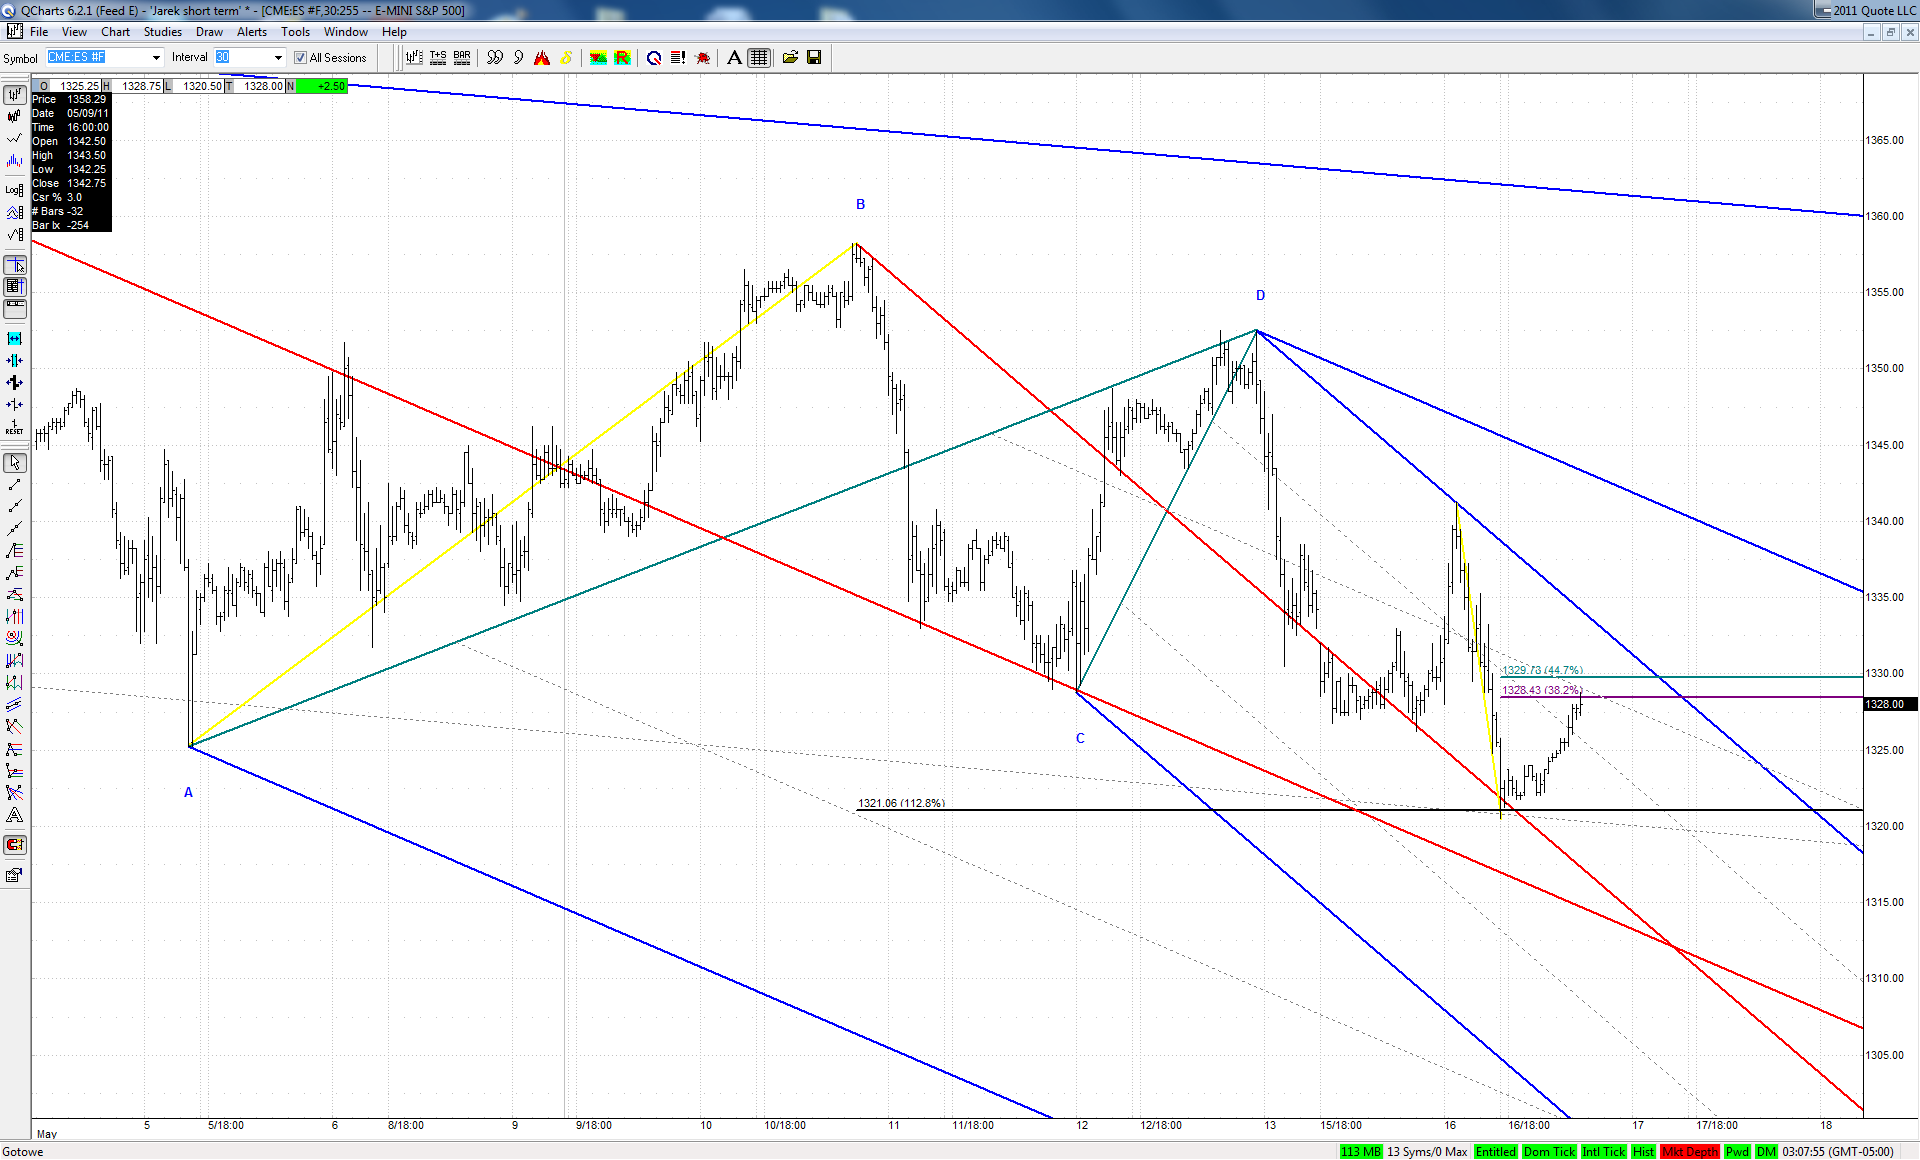
As a matter of fact we may already say that our big bearish ABCD in ES has ... fully play out
Just to 1.128, but it has:

Click image for original size
JA
jarek
Rep: 94
Posts: 3,474
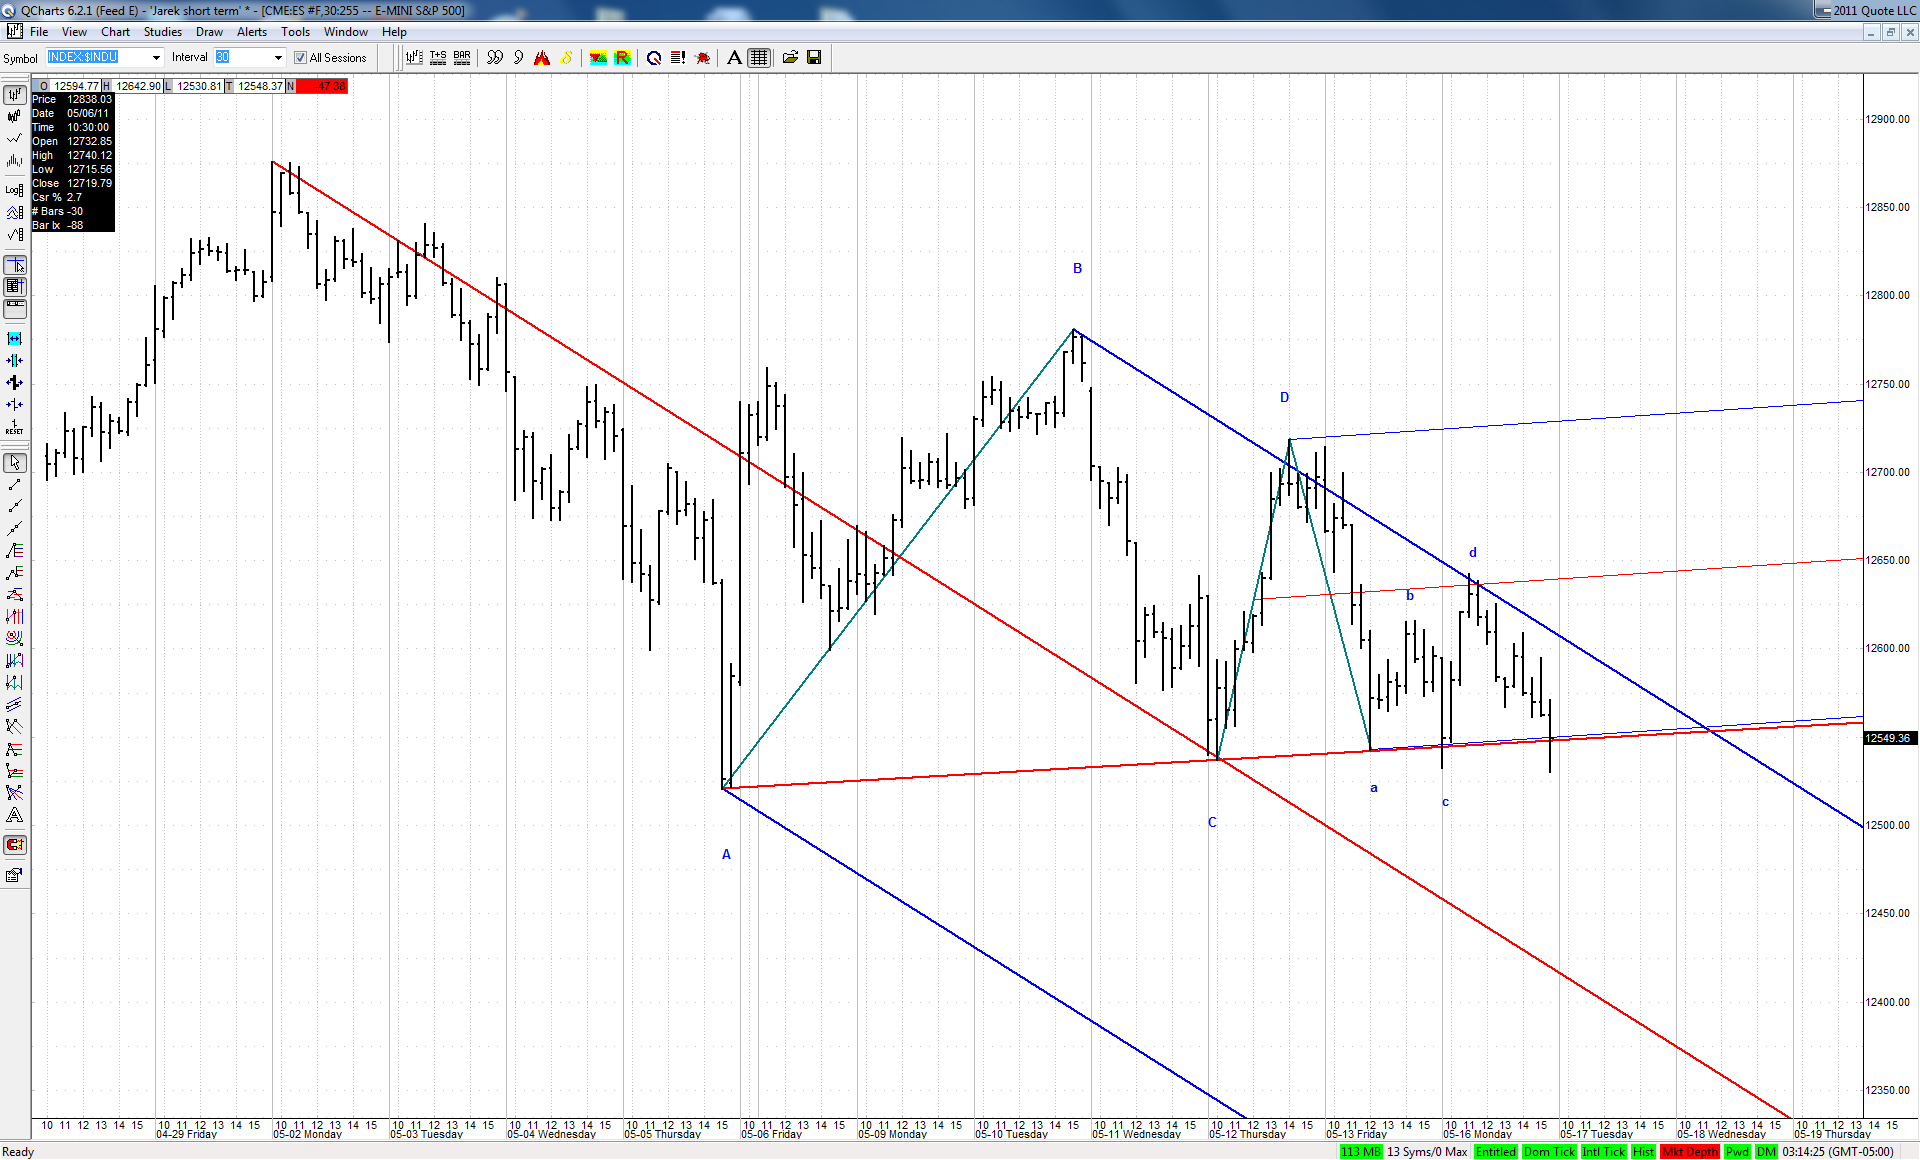
Of course we could expect much more downside, especially with main indexes positioned well for a downside acceleration:

Click image for original size


Click image for original size


But if it turned up here, we could not blame Kane methodology for leading us astray
JA
jarek
Rep: 94
Posts: 3,474
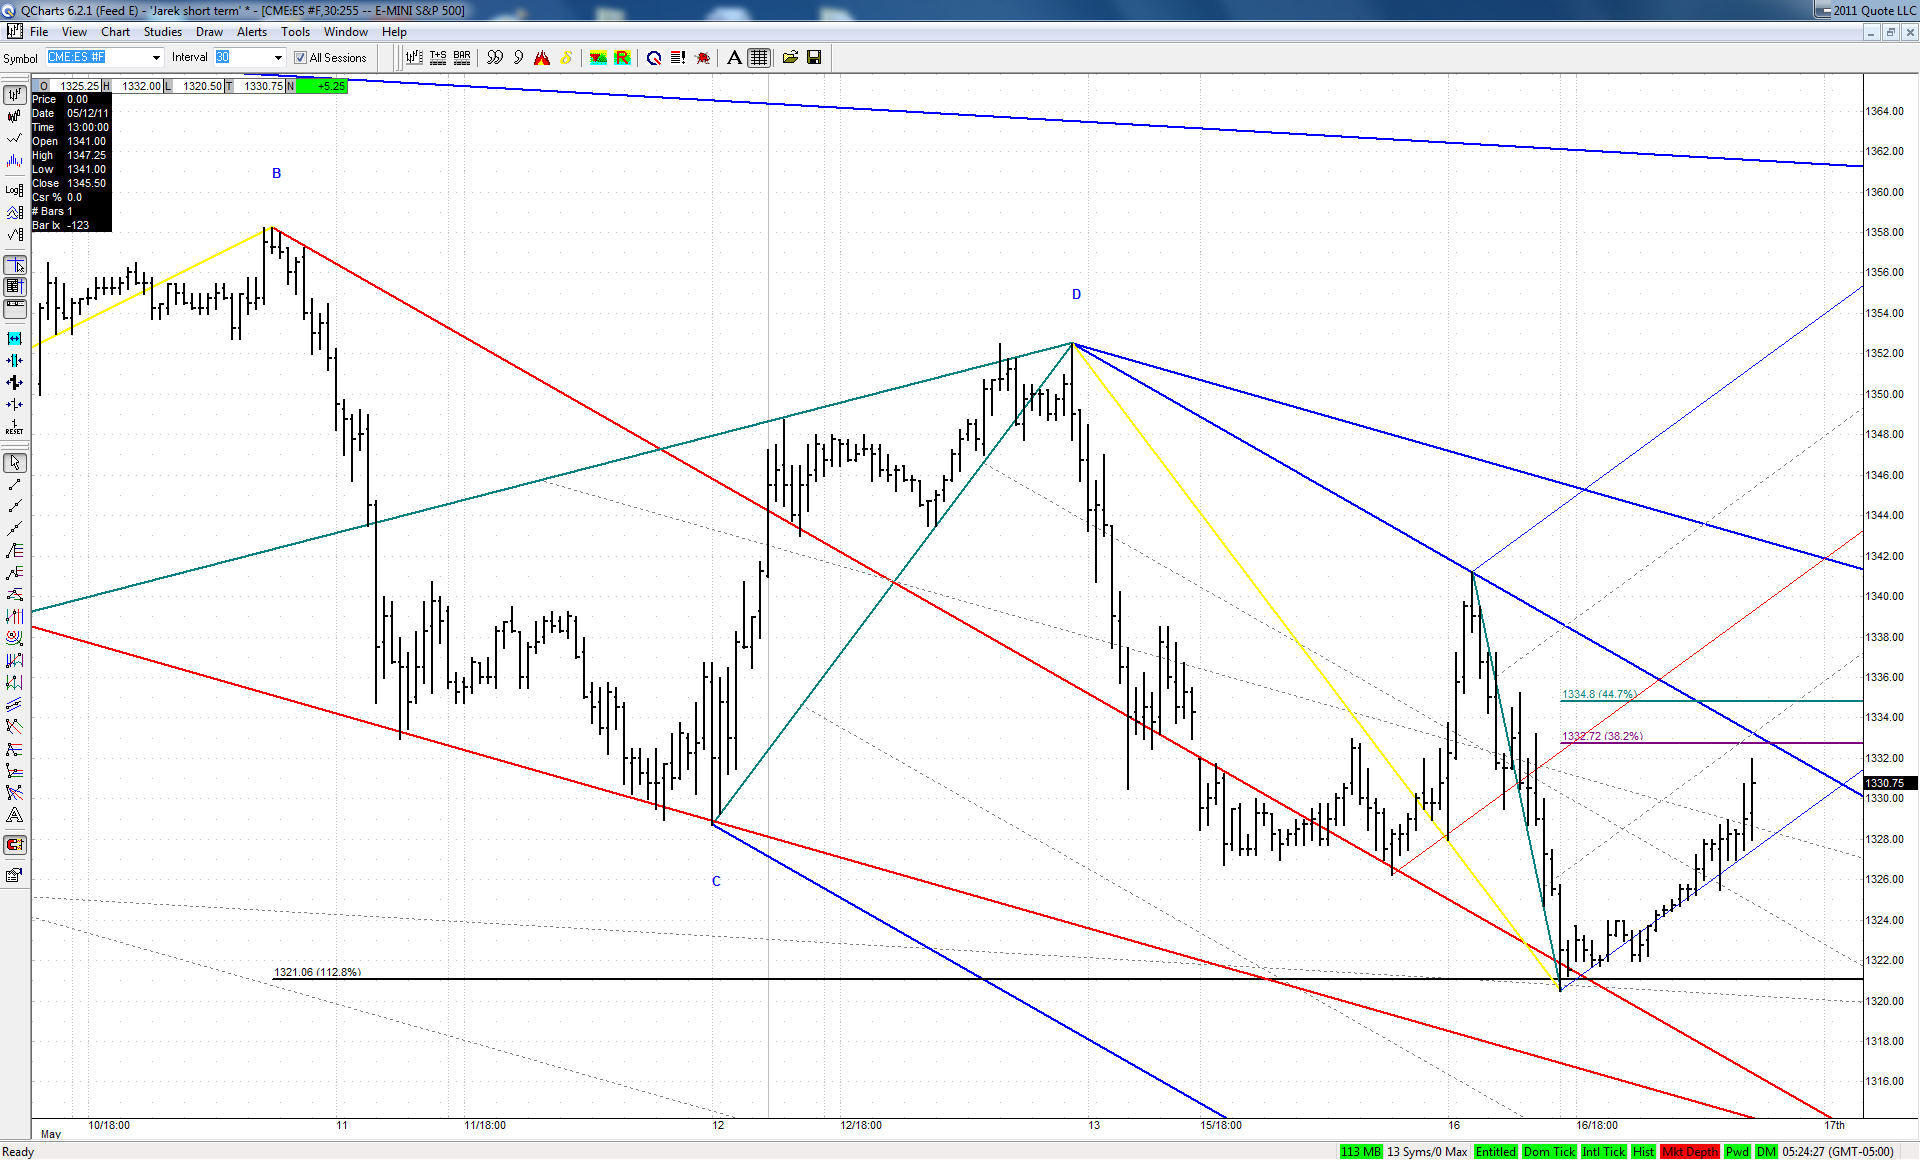
TL creep ends up with upside acceleration instead of a downside breakout:

Click image for original size


How about the Kane Zone just above?
JA
jarek
Rep: 94
Posts: 3,474
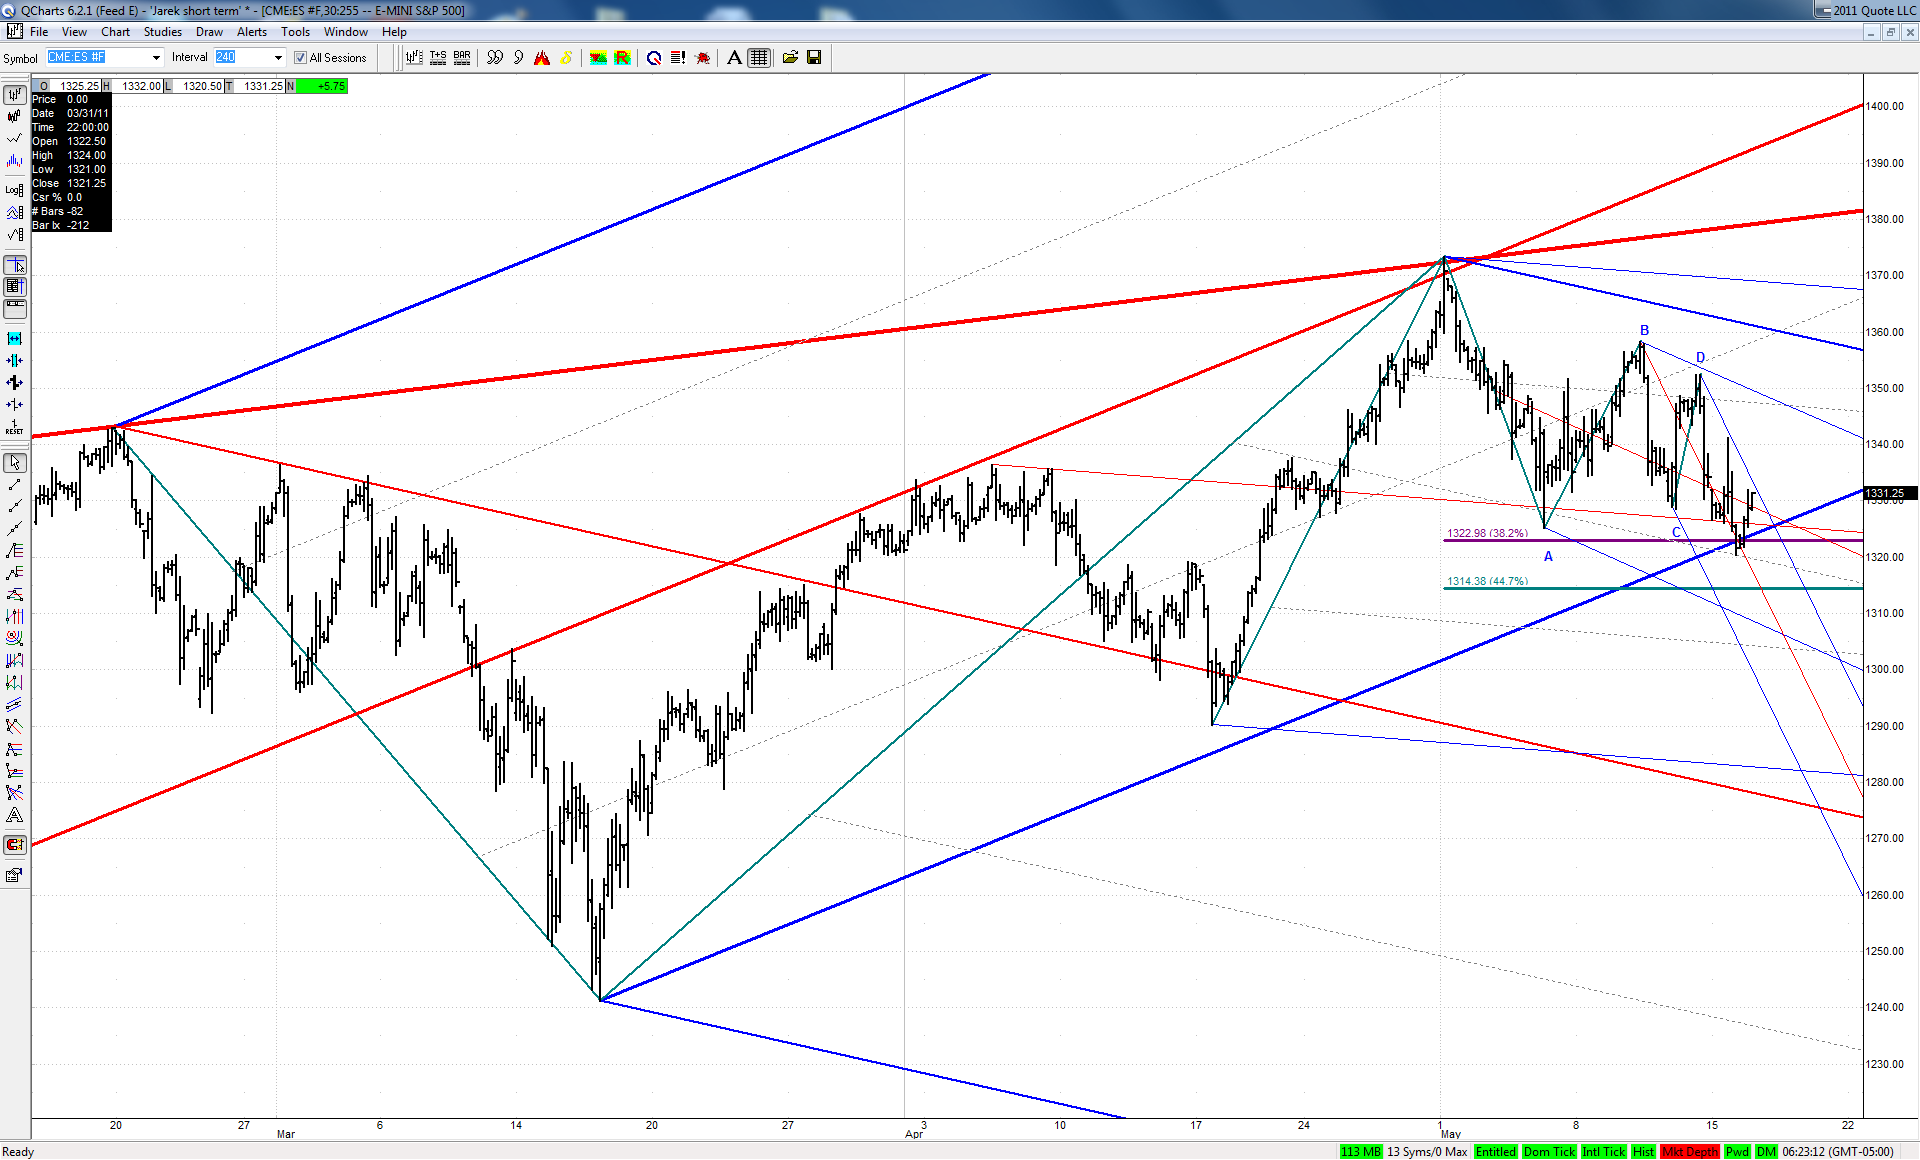
Looking longer term there should be no problem with this small Kane Zone above since today's move up is coming off an important line in much bigger Kane Zone:

Click image for original size


If there is a problem - that would be quite a clue
JA
jarek
Rep: 94
Posts: 3,474
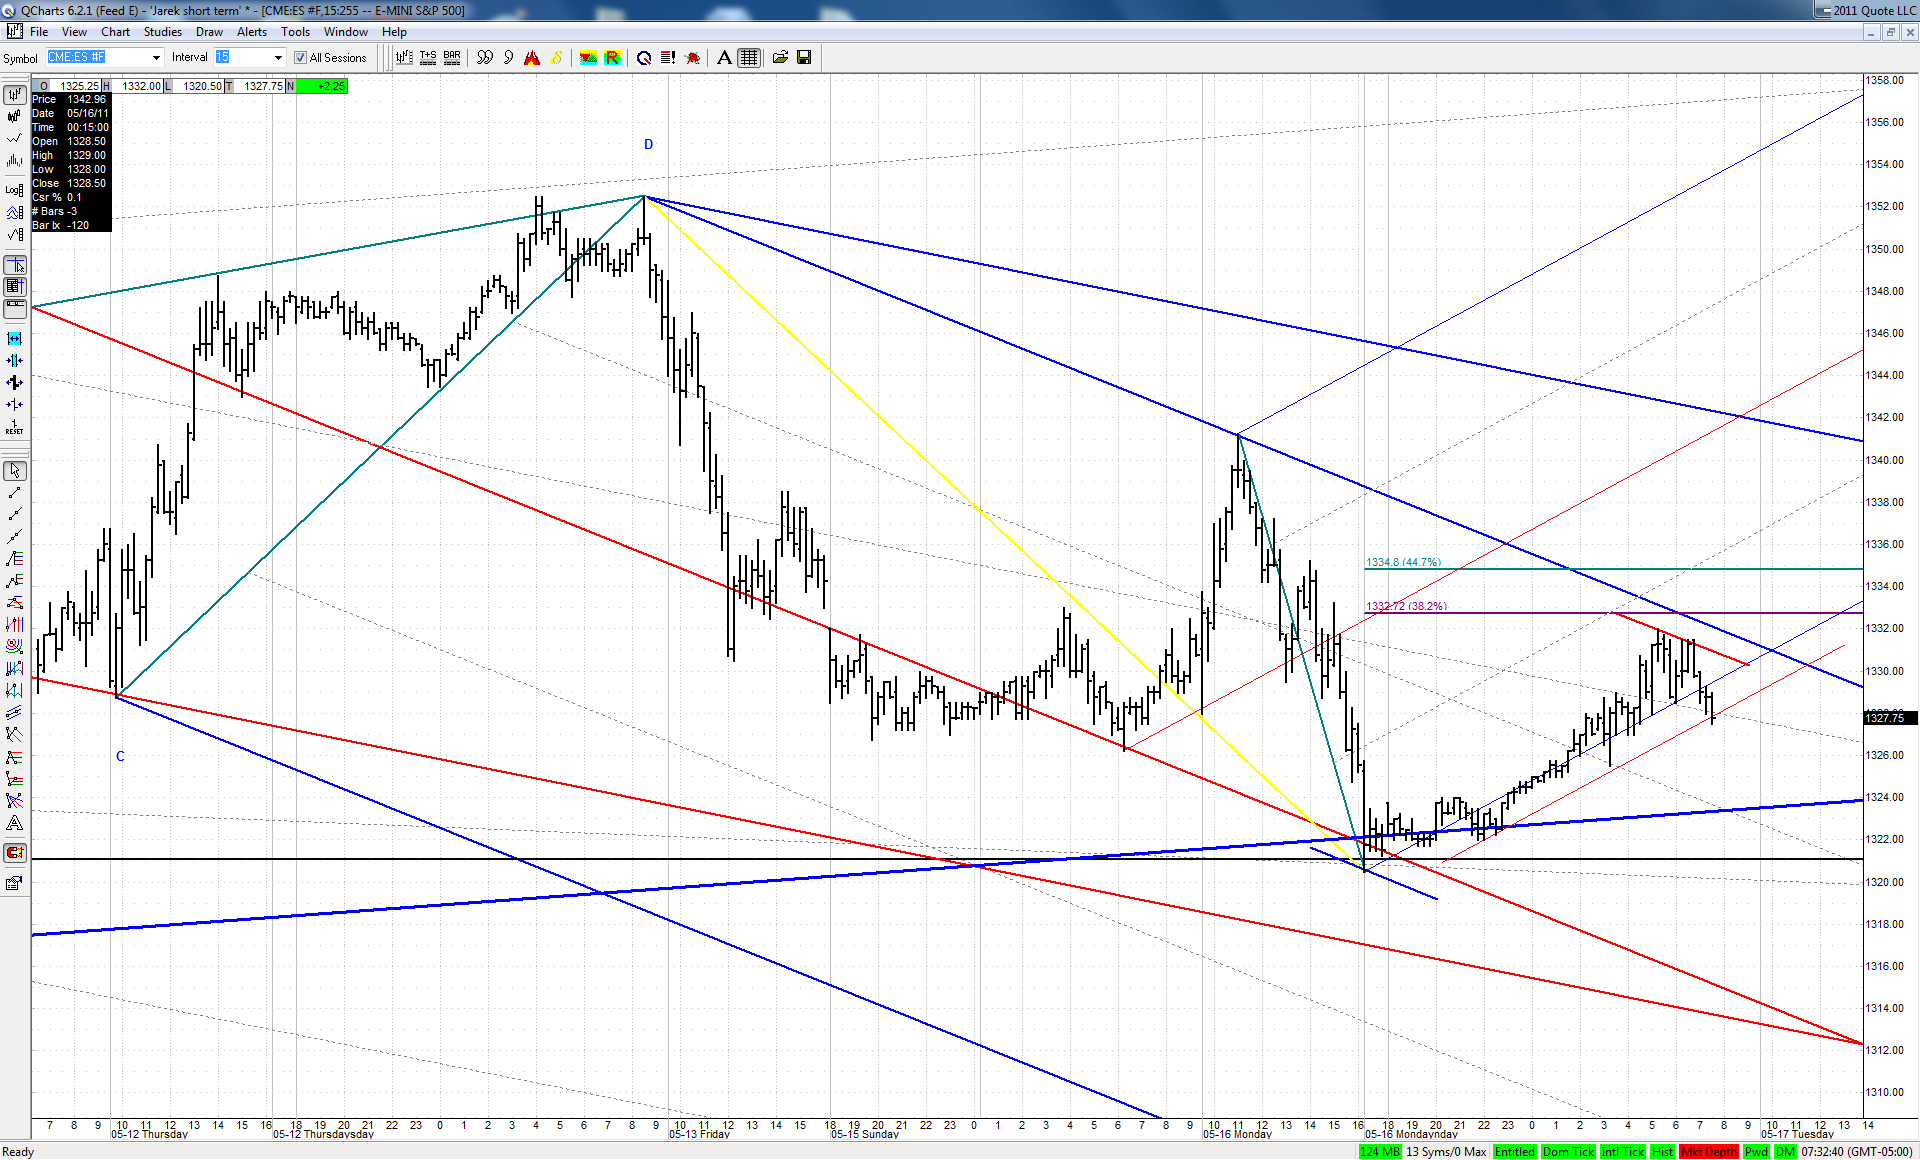
First warning for bulls - ES breaking down off a very simple geometry without even reaching the small Kane Zone:

Click image for original size
RO
roofer
Rep: 3,689
Posts: 3,574
just traders trading..... if the red line green set on yesterdays close was to be valid,in the face of the insane last hour bullishness, then OUR TOOLS, AND NOTHING ELSE.... should have pointed to RISK OFF!!! in the face of the manipulation in the indexes.... i think they did their job.... and all the way down today... they said repeatedly trend day shooting for targets...