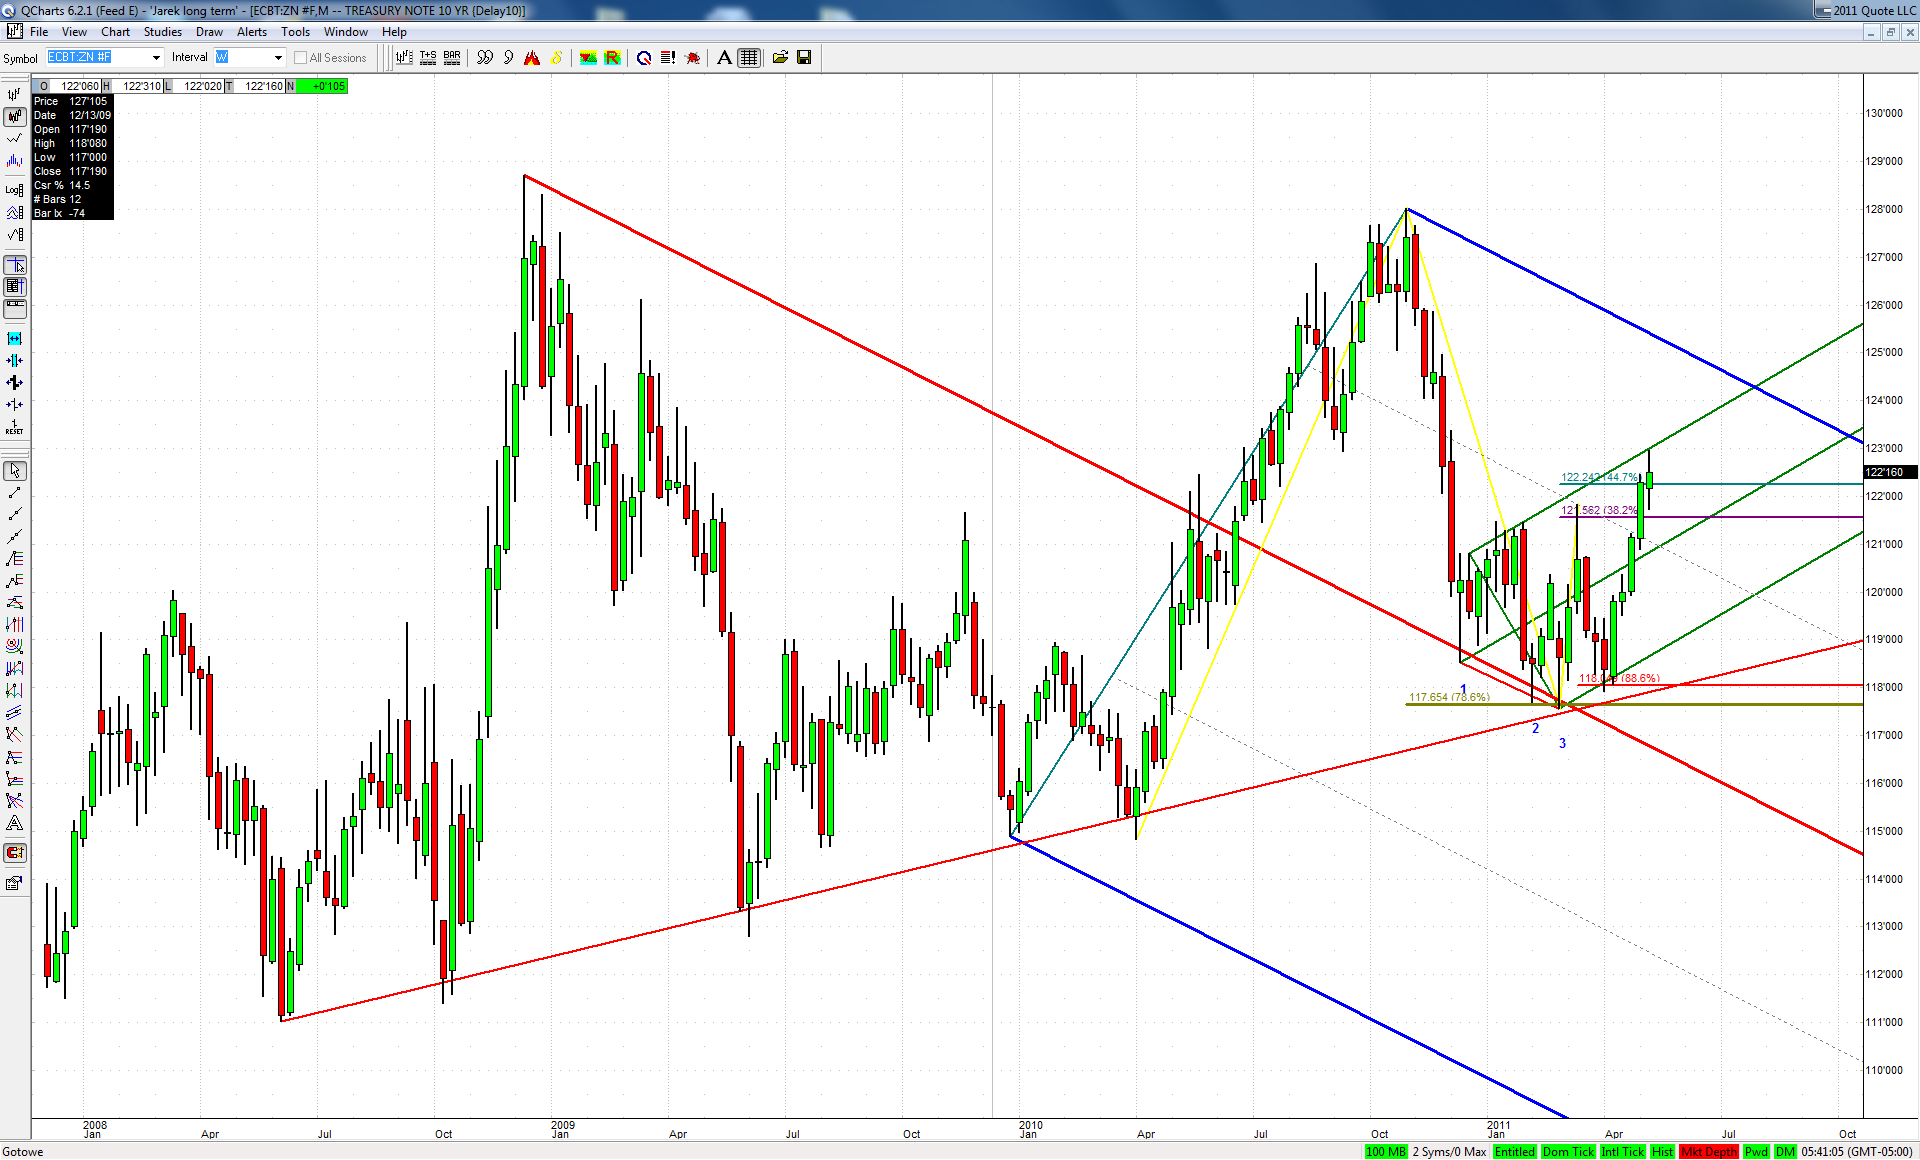
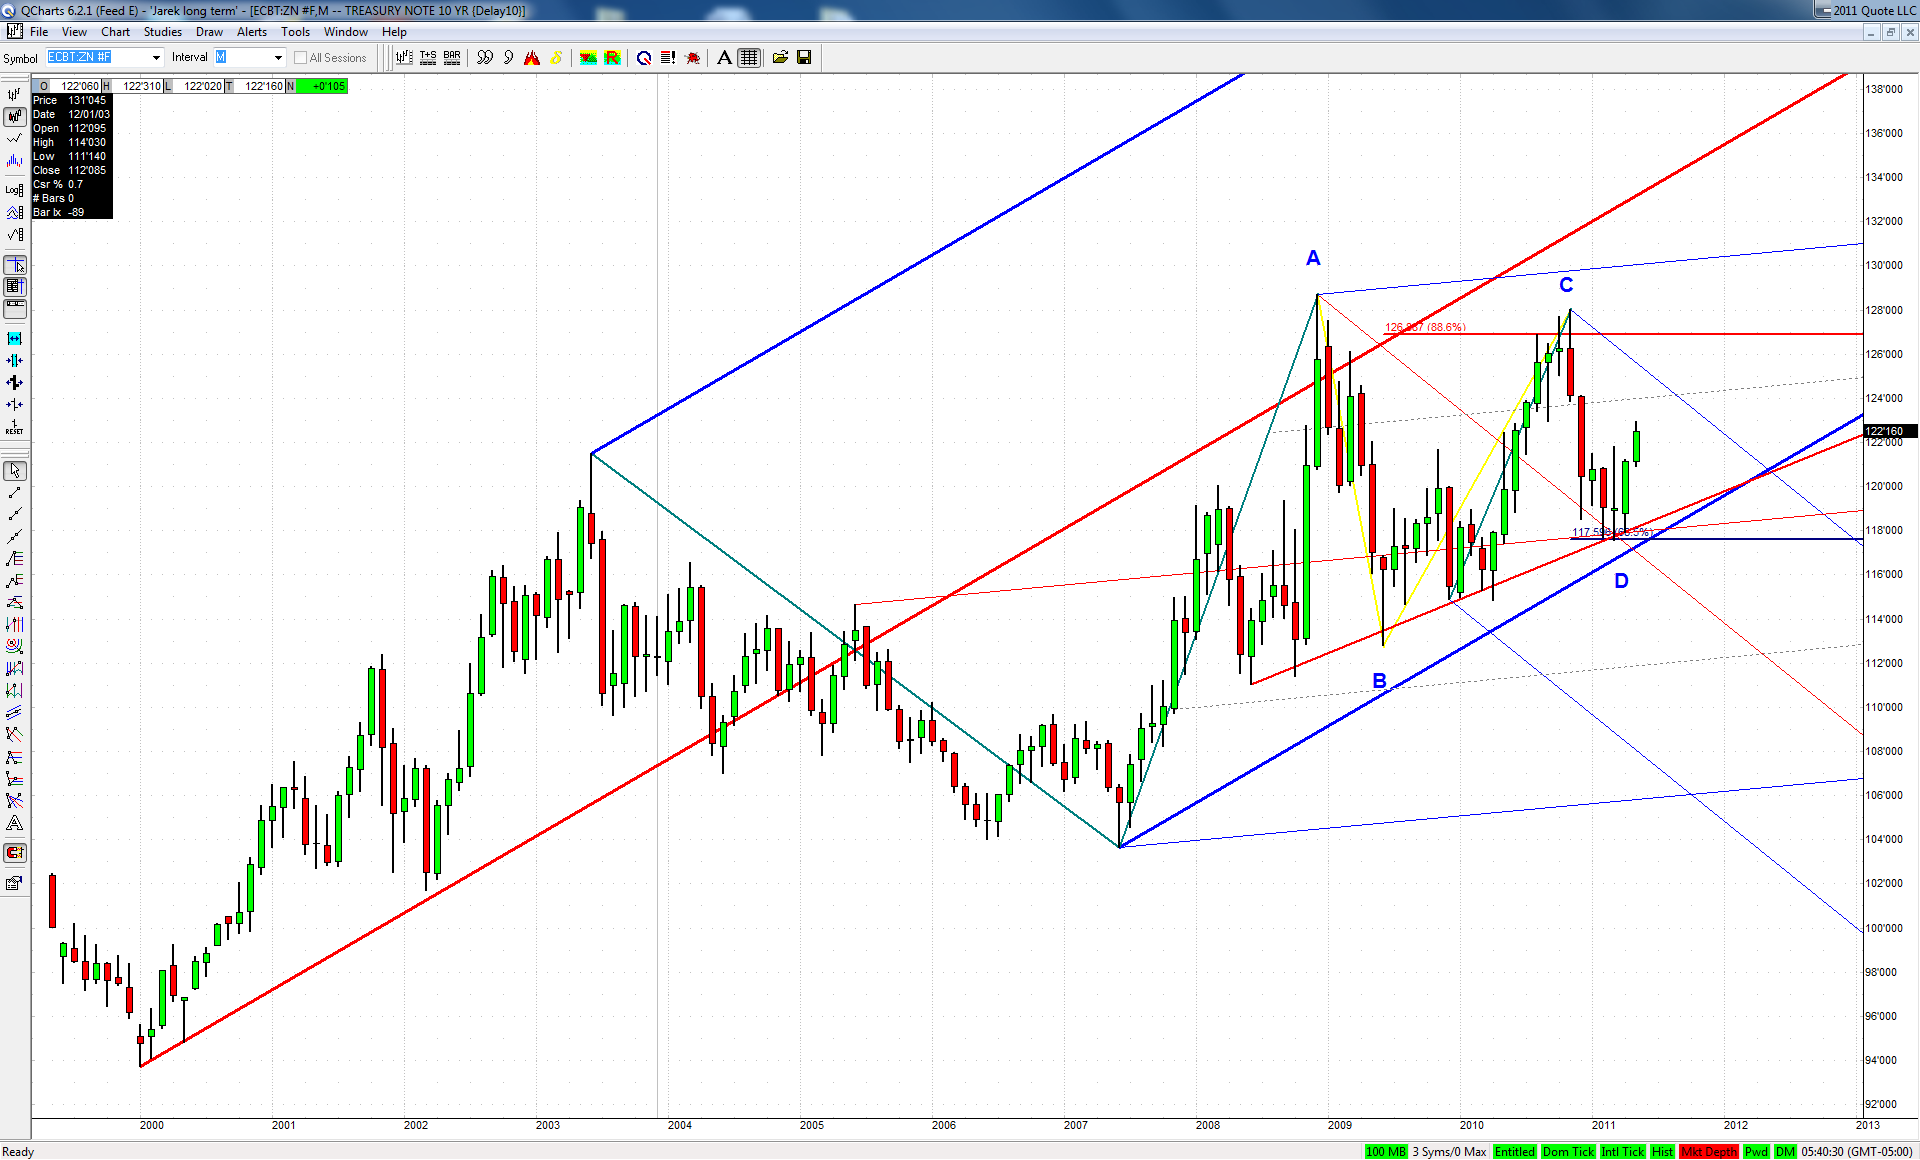
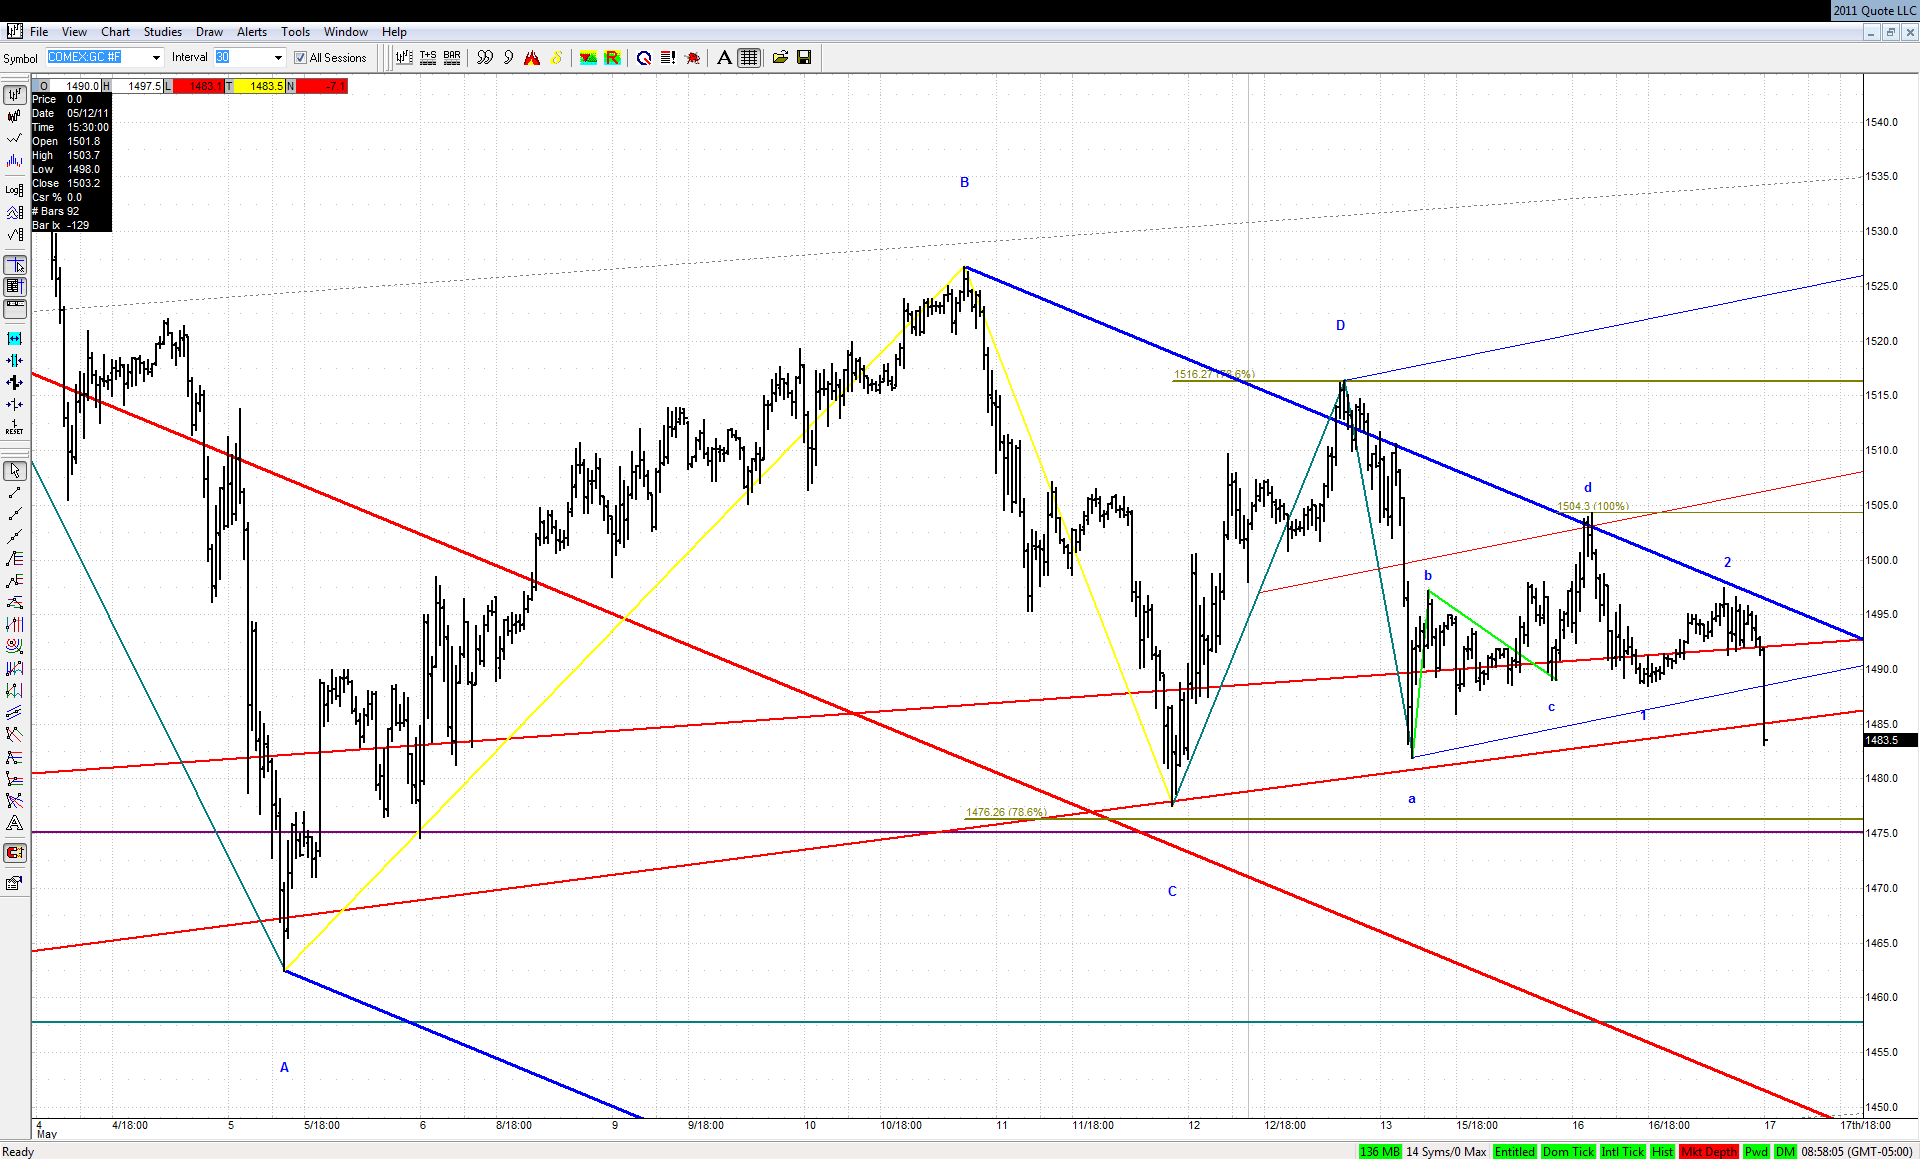
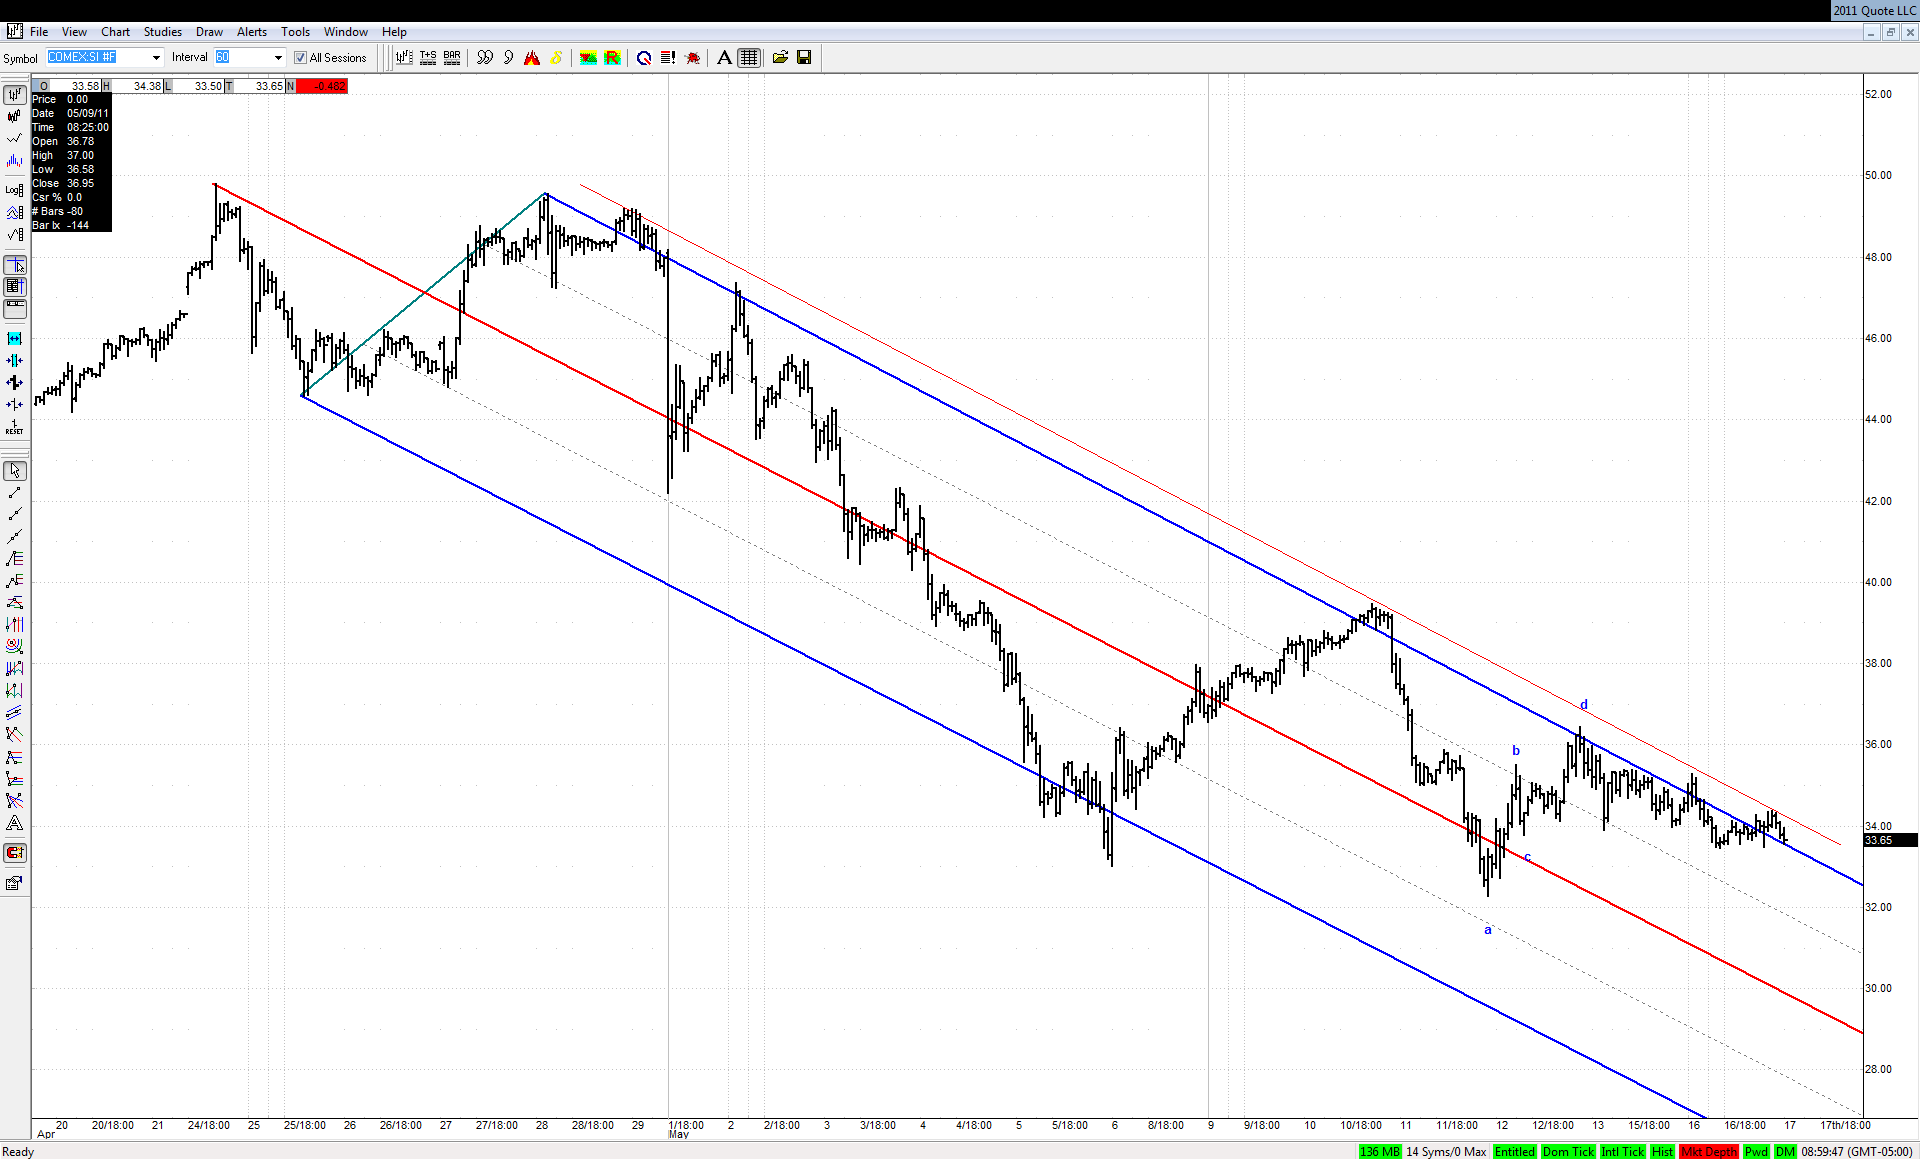
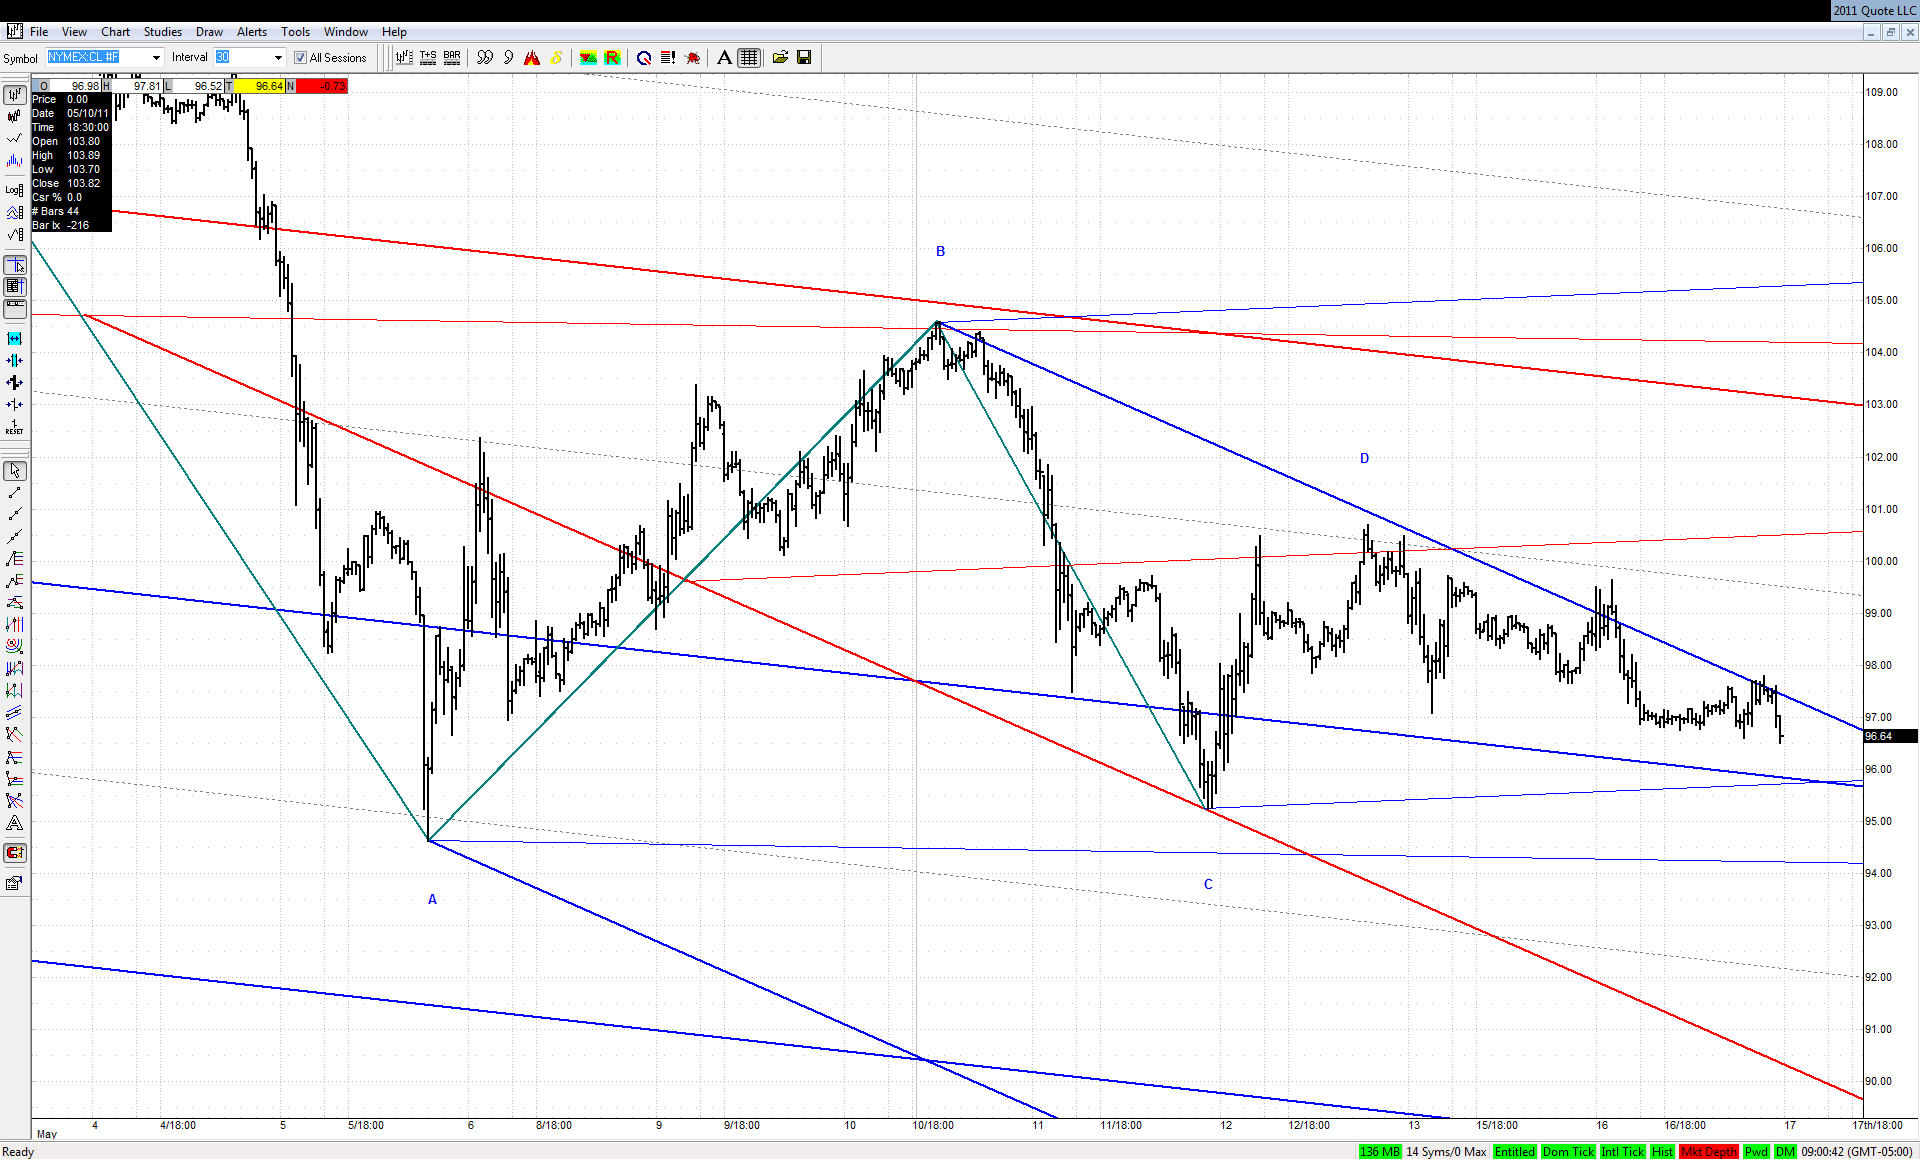
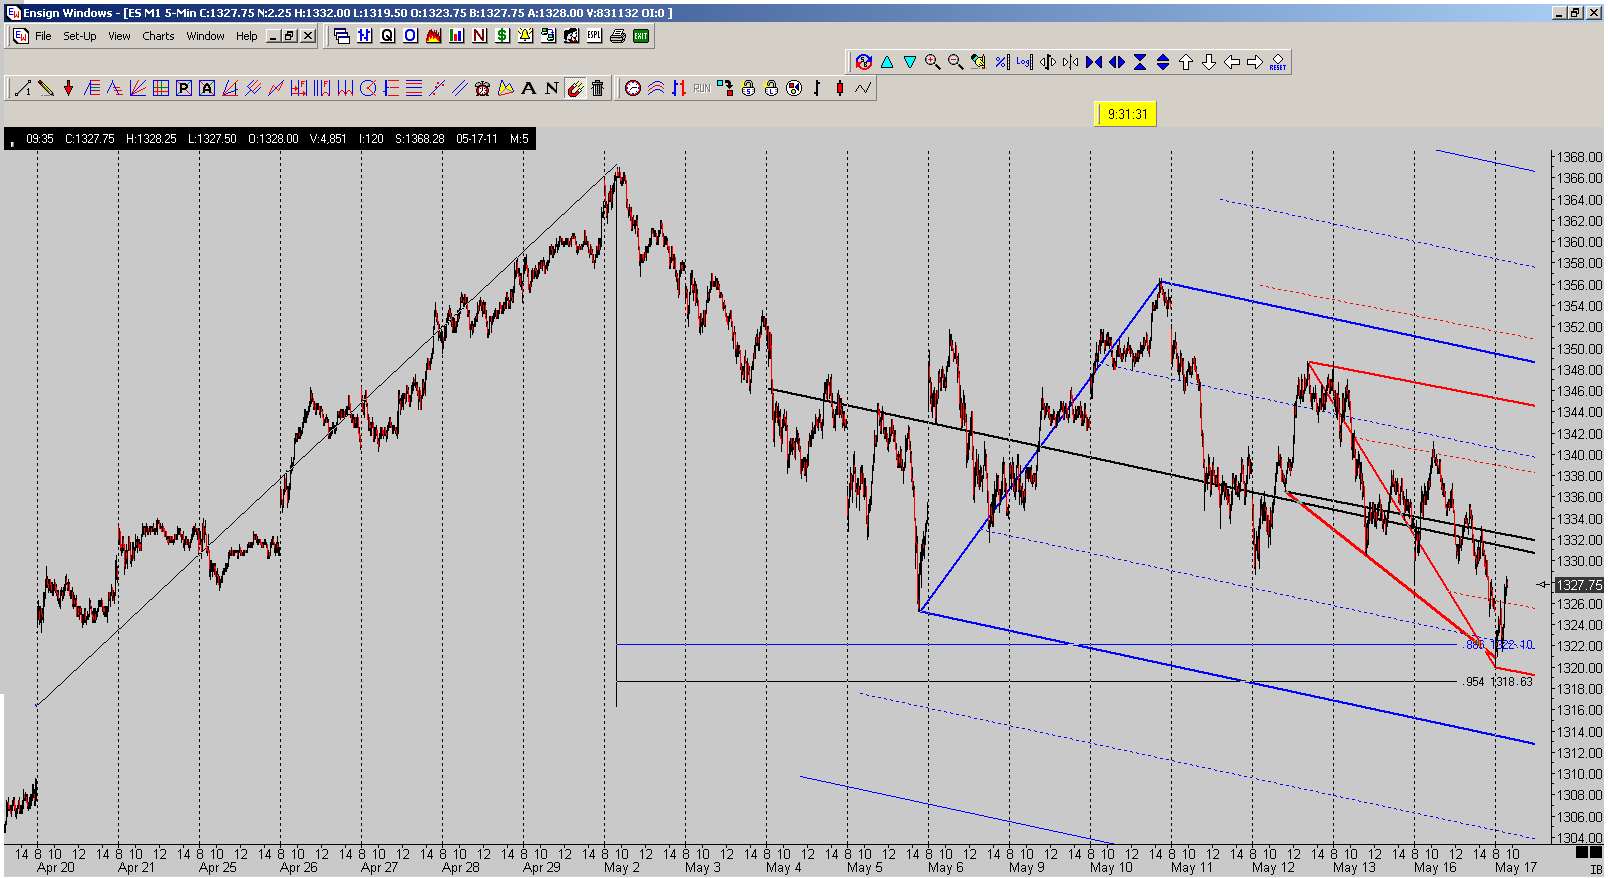
With the bearish case on Bonds being so touted recently I'm wondering whether it's not a big smokescreen suggesting that quite opposite may happen... Especially after looking at the following charts:
TX
tx_ches
Rep: -10
Posts: 514
Yes, also a 618 from a prior swing low on 4/18 and other fibs from more minor swing lows in the up leg. Will x mark the spot?
Originally posted by rat89
5681 = 447 and is in an interesting area
TX
tx_ches
Rep: -10
Posts: 514
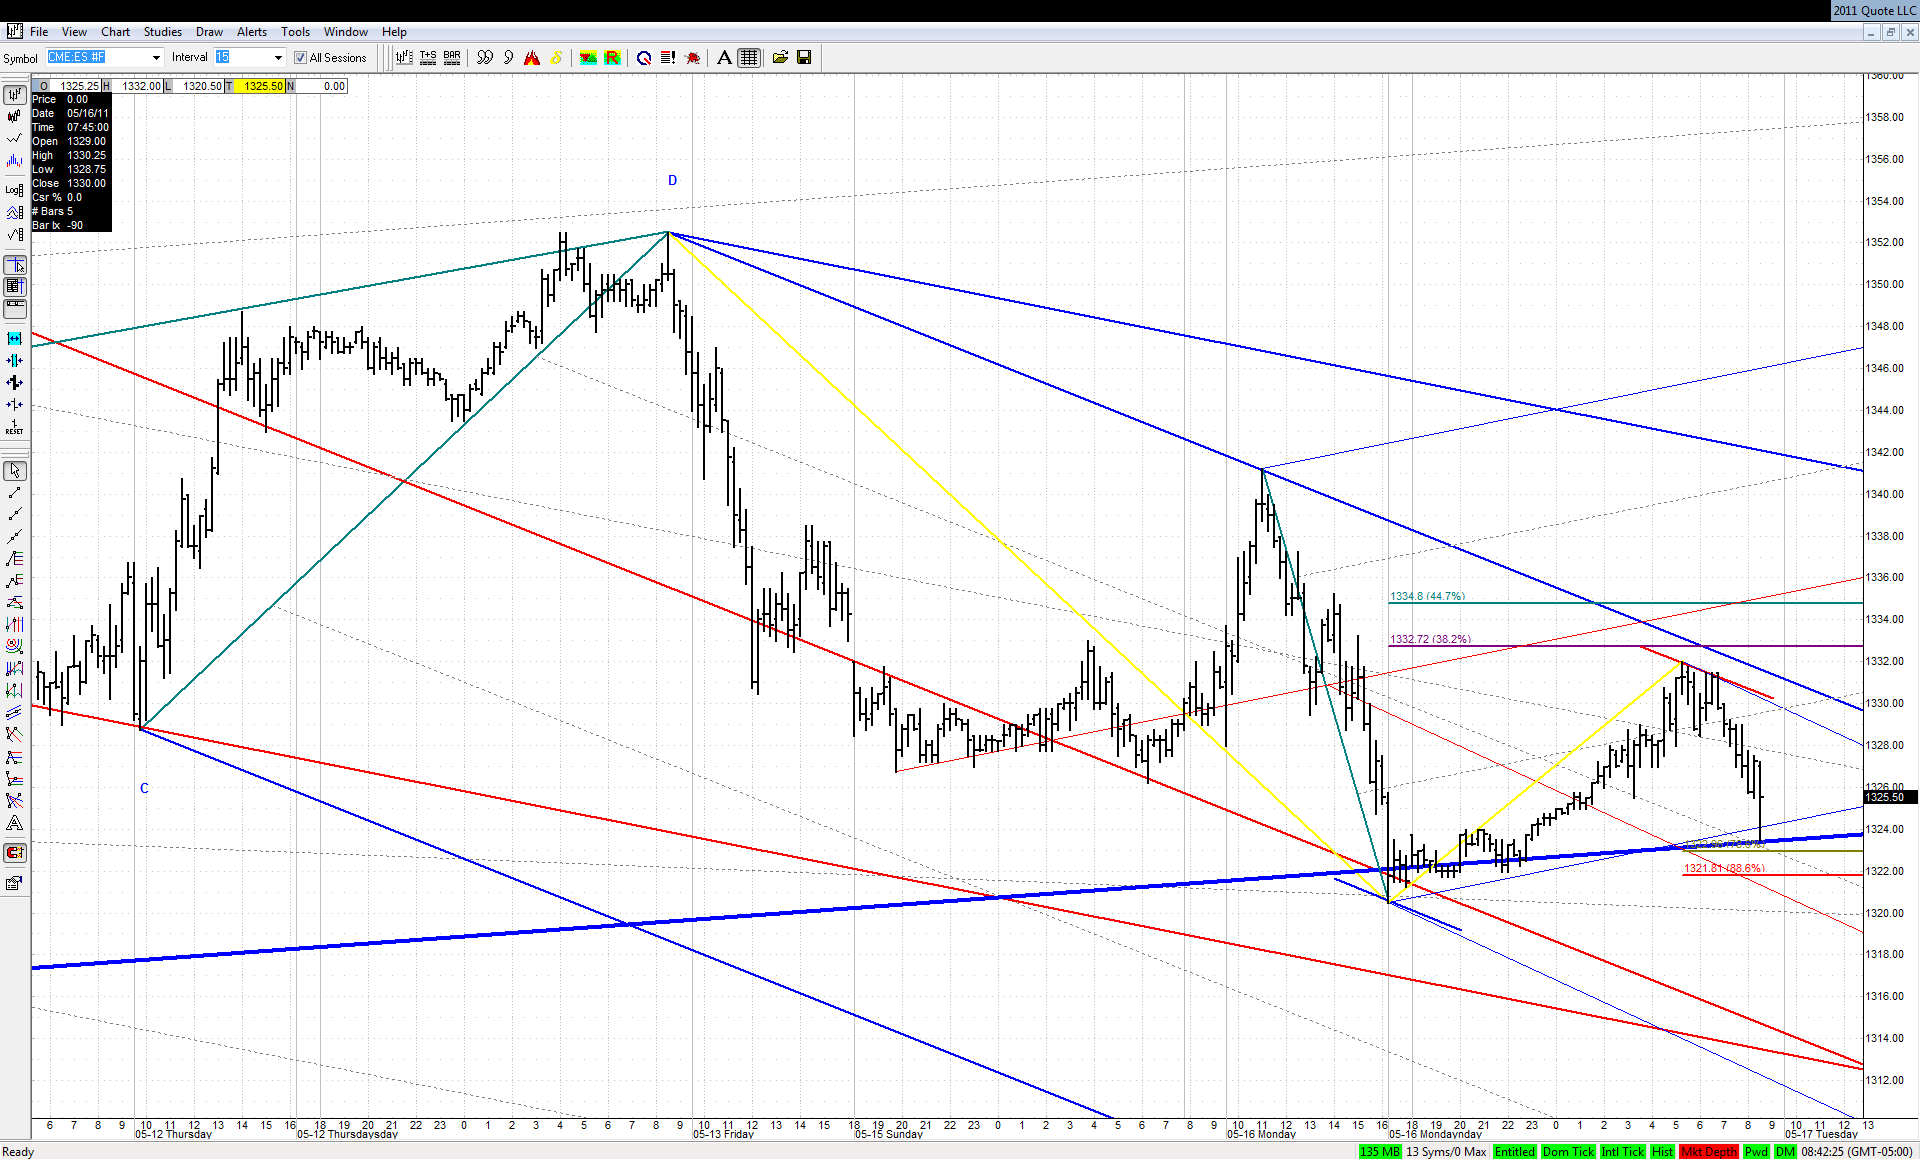
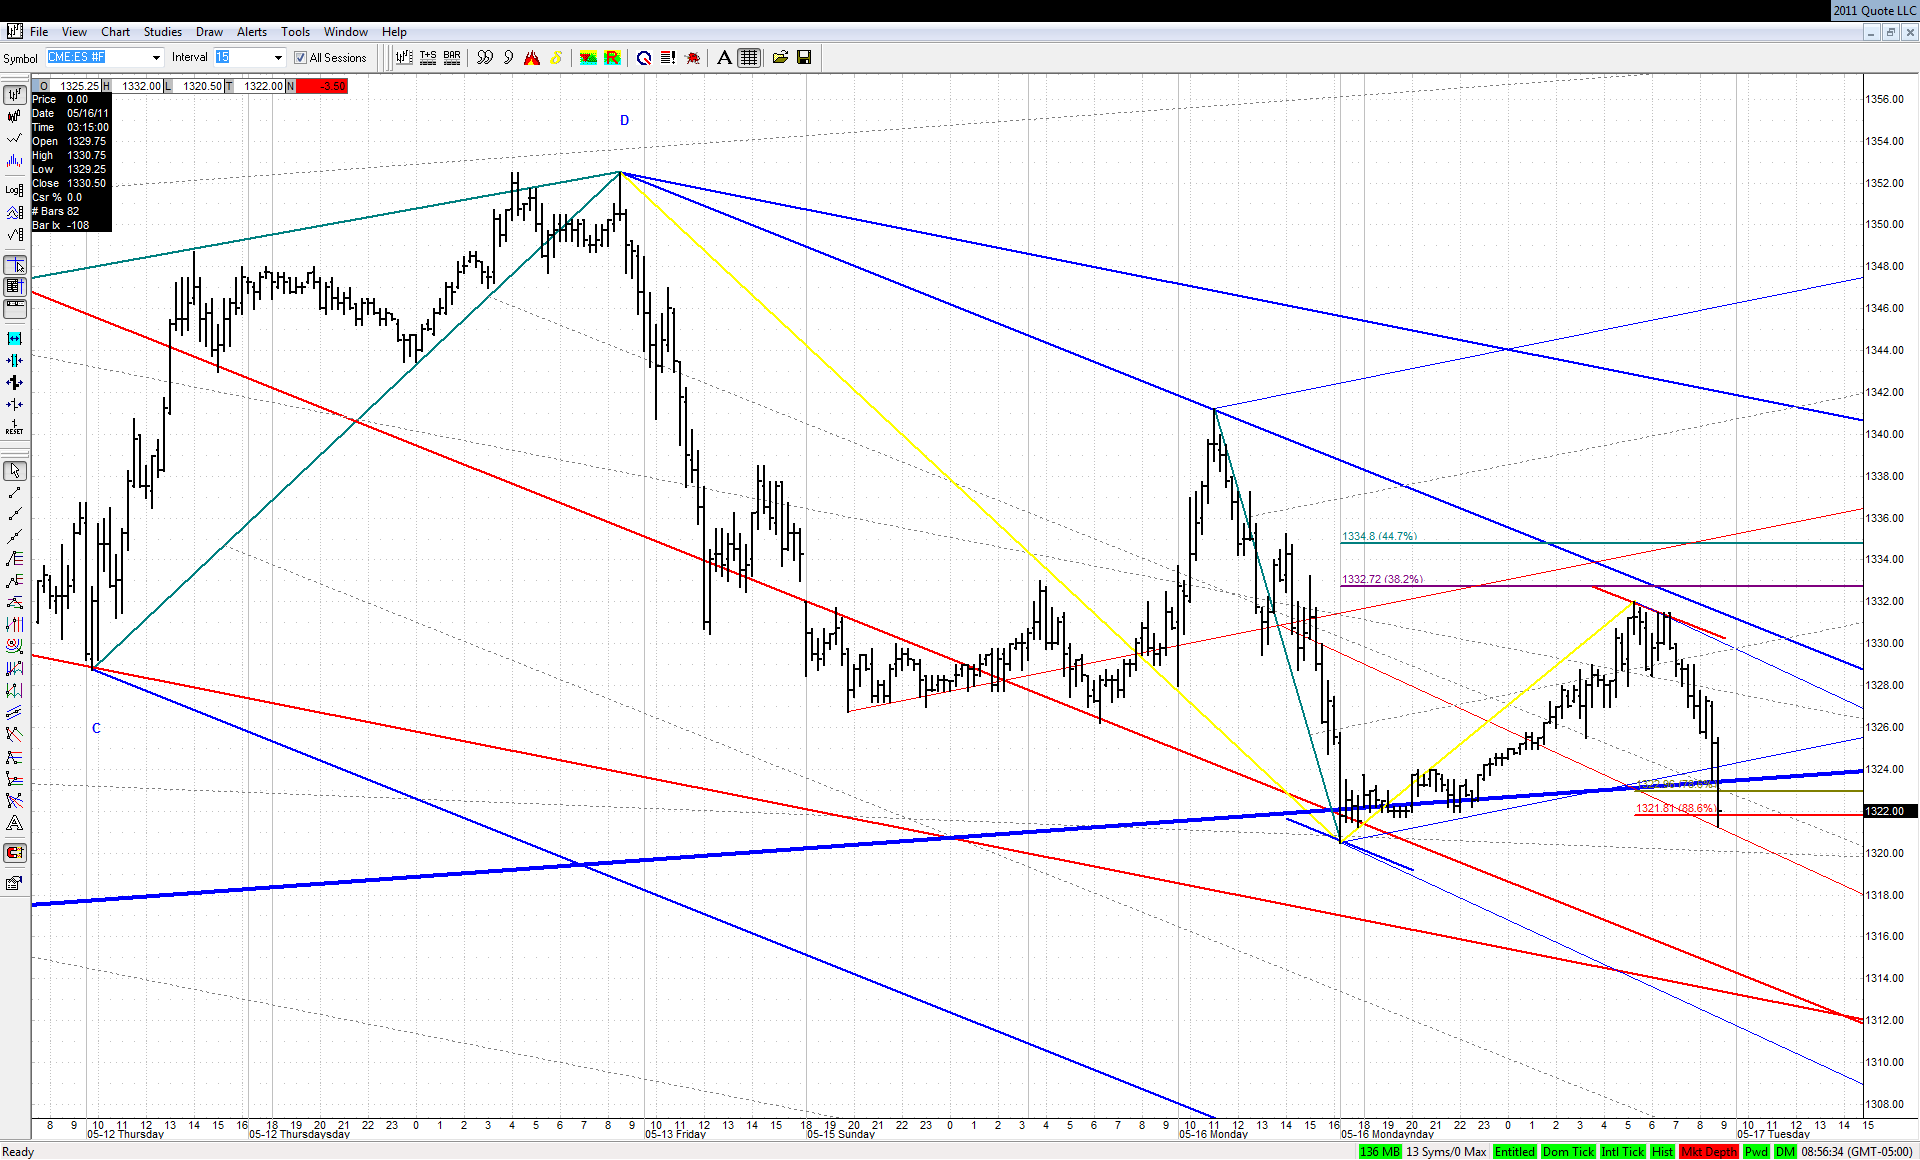
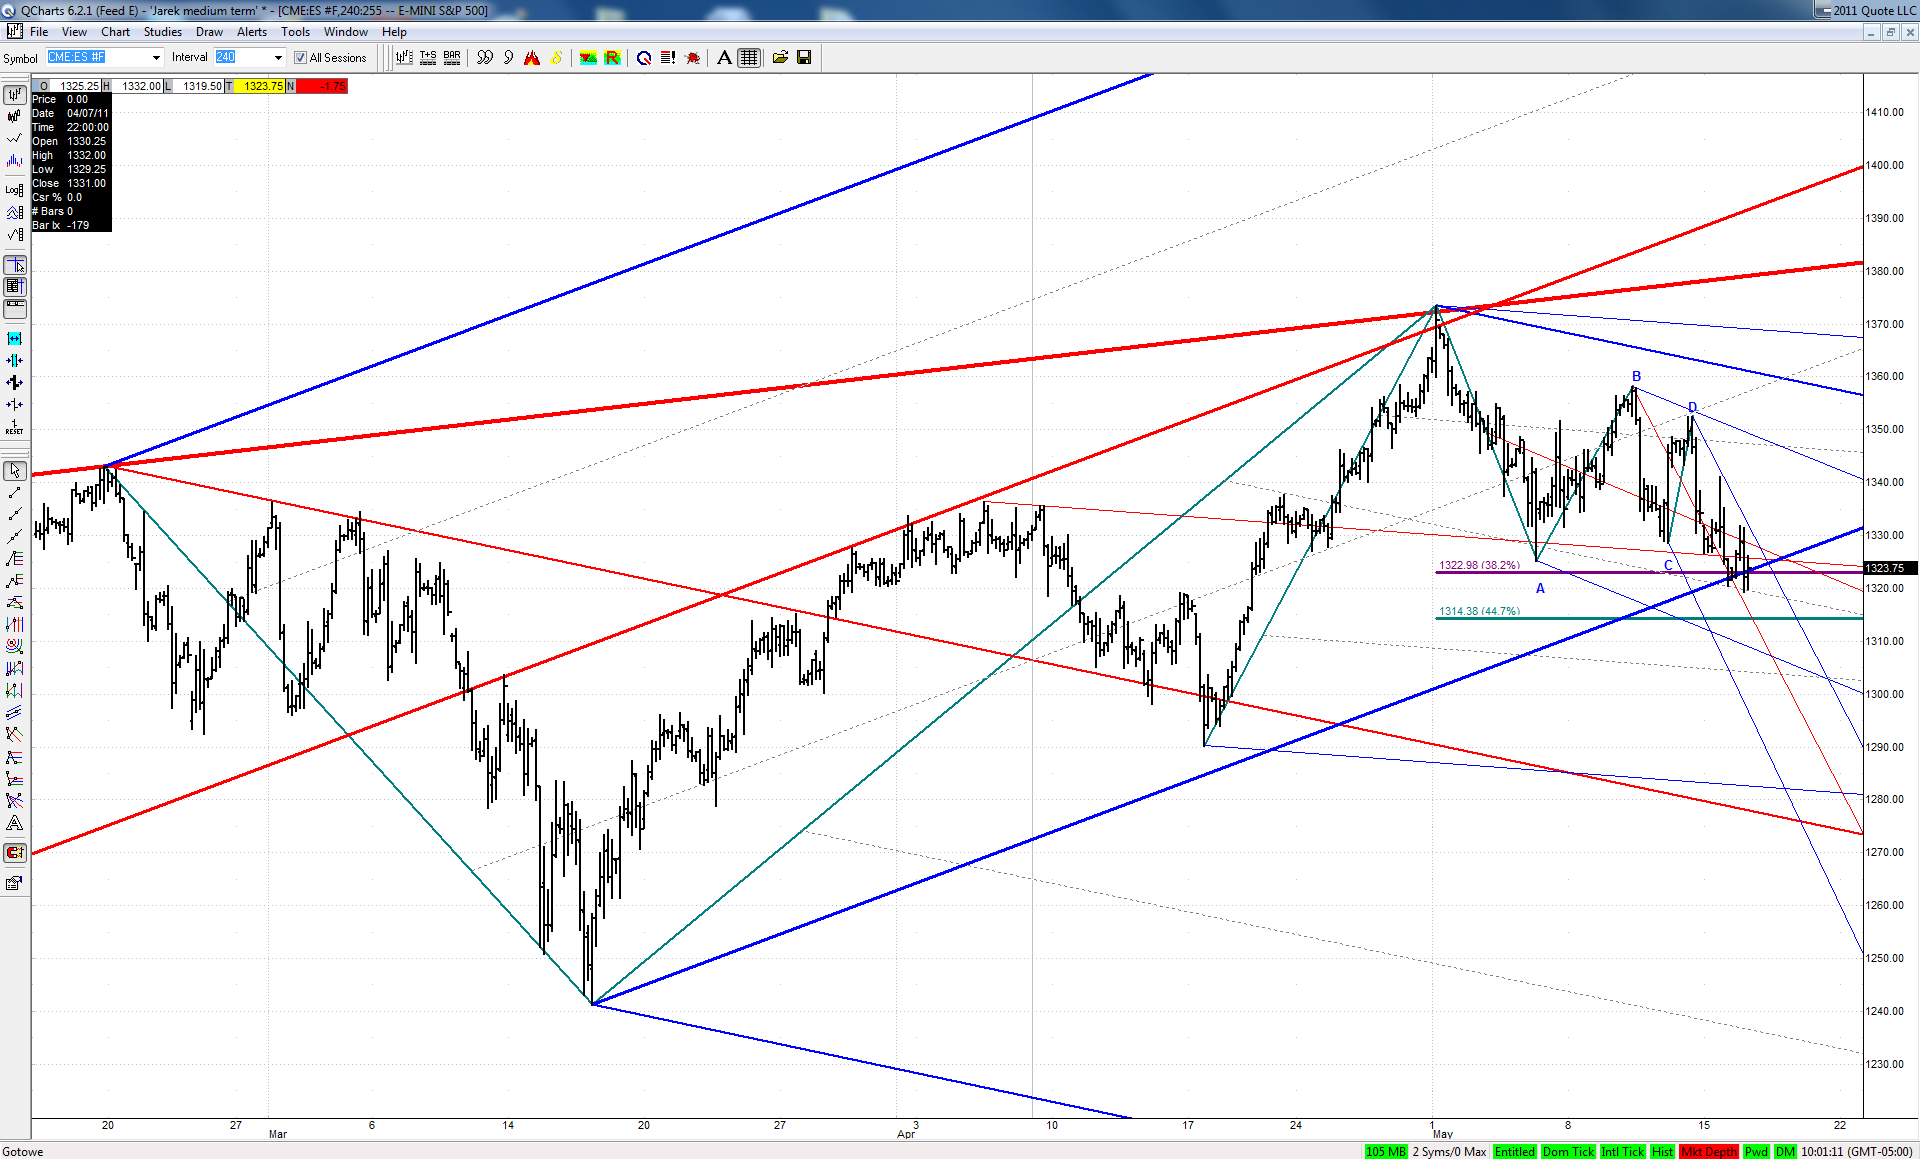
Interesting that drawing out the retrace finds the 112,127,161 levels overlapping with support/resistance lines at/near swing points. So that seems like it'd be a magnet for more down. Spy nearing its gap line at 132.79 from 4/20.
Looking like it'll be a good day for geometry.
Originally posted by jarek
Of course we could expect much more downside, especially with main indexes positioned well for a downside acceleration:
RO
roofer
Rep: 3,689
Posts: 3,574
just traders trading..... if the red line green set on yesterdays close was to be valid,in the face of the insane last hour bullishness, then OUR TOOLS, AND NOTHING ELSE.... should have pointed to RISK OFF!!! in the face of the manipulation in the indexes.... i think they did their job.... and all the way down today... they said repeatedly trend day shooting for targets...