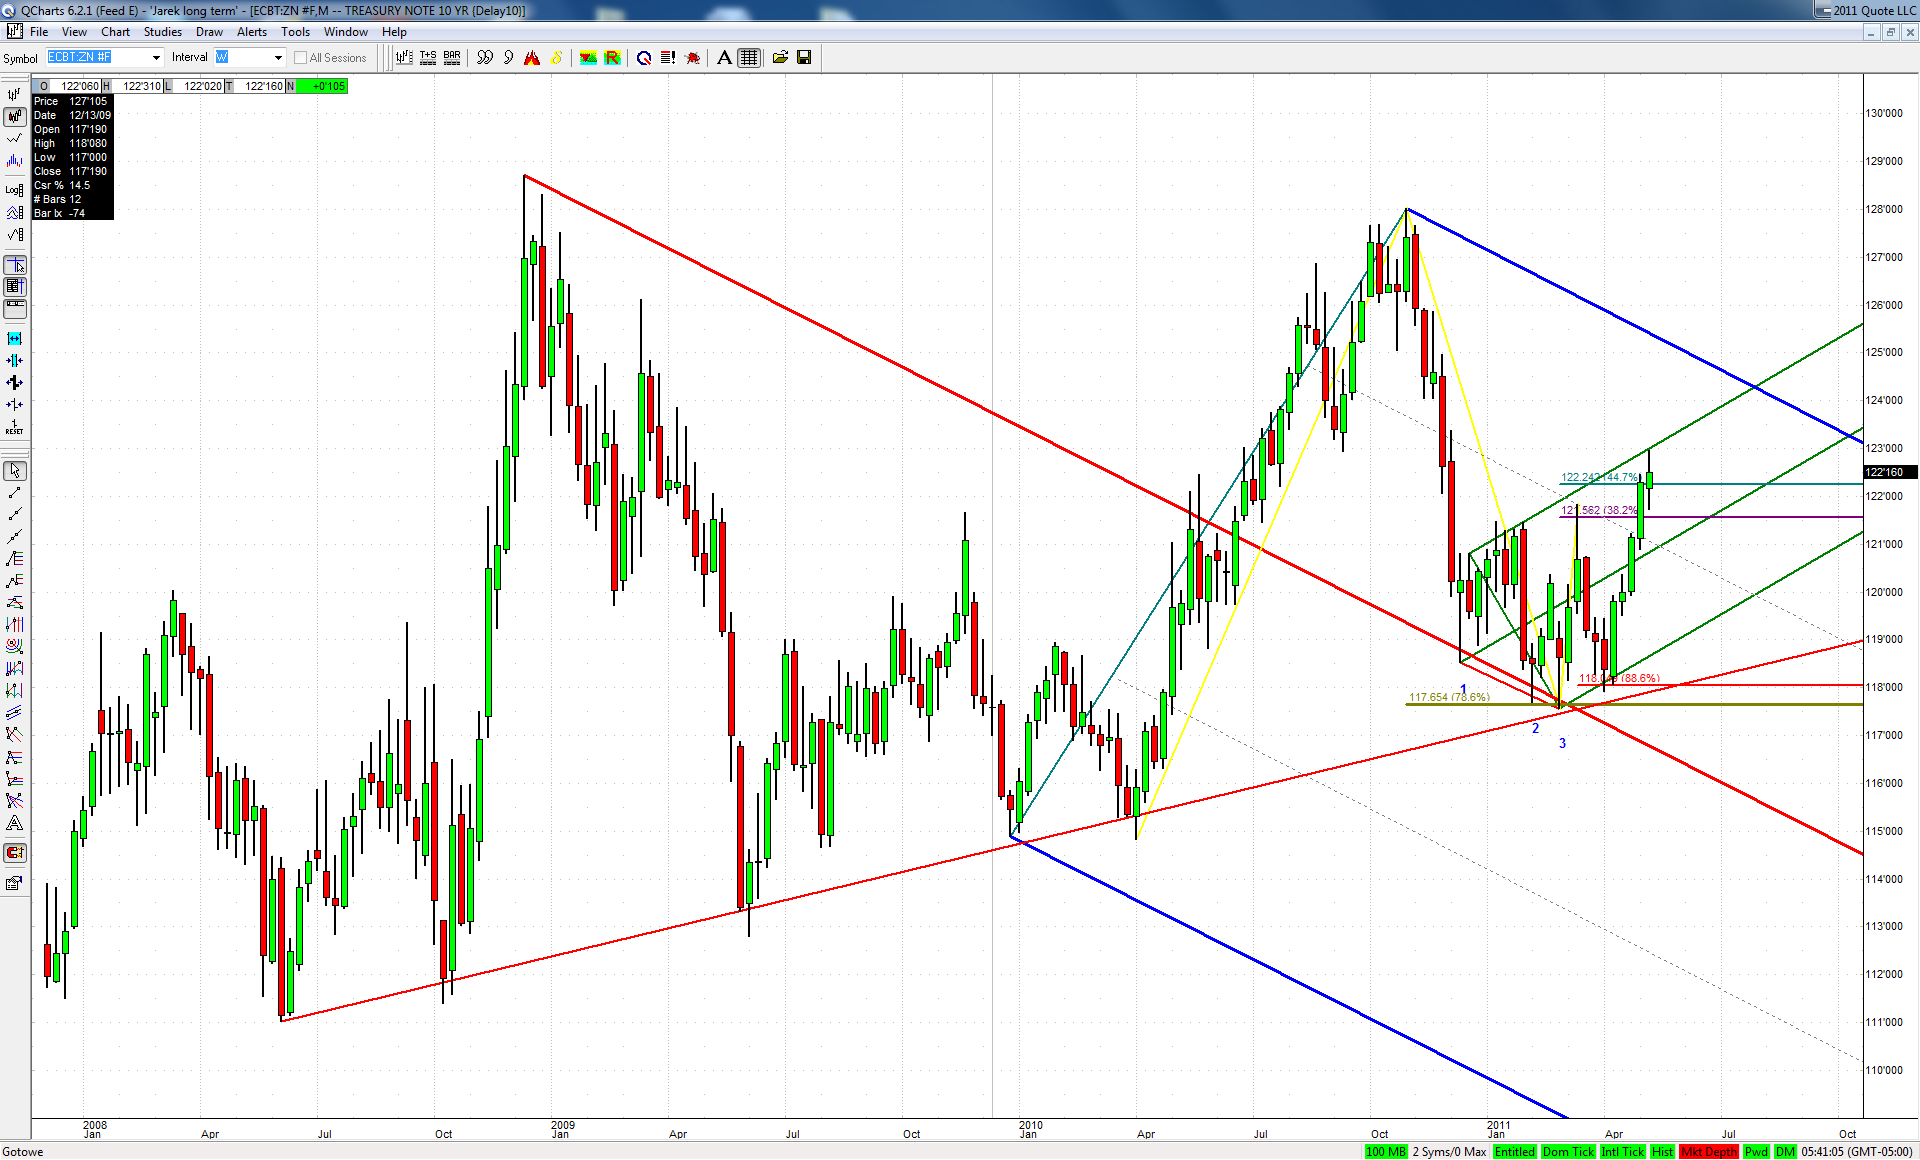
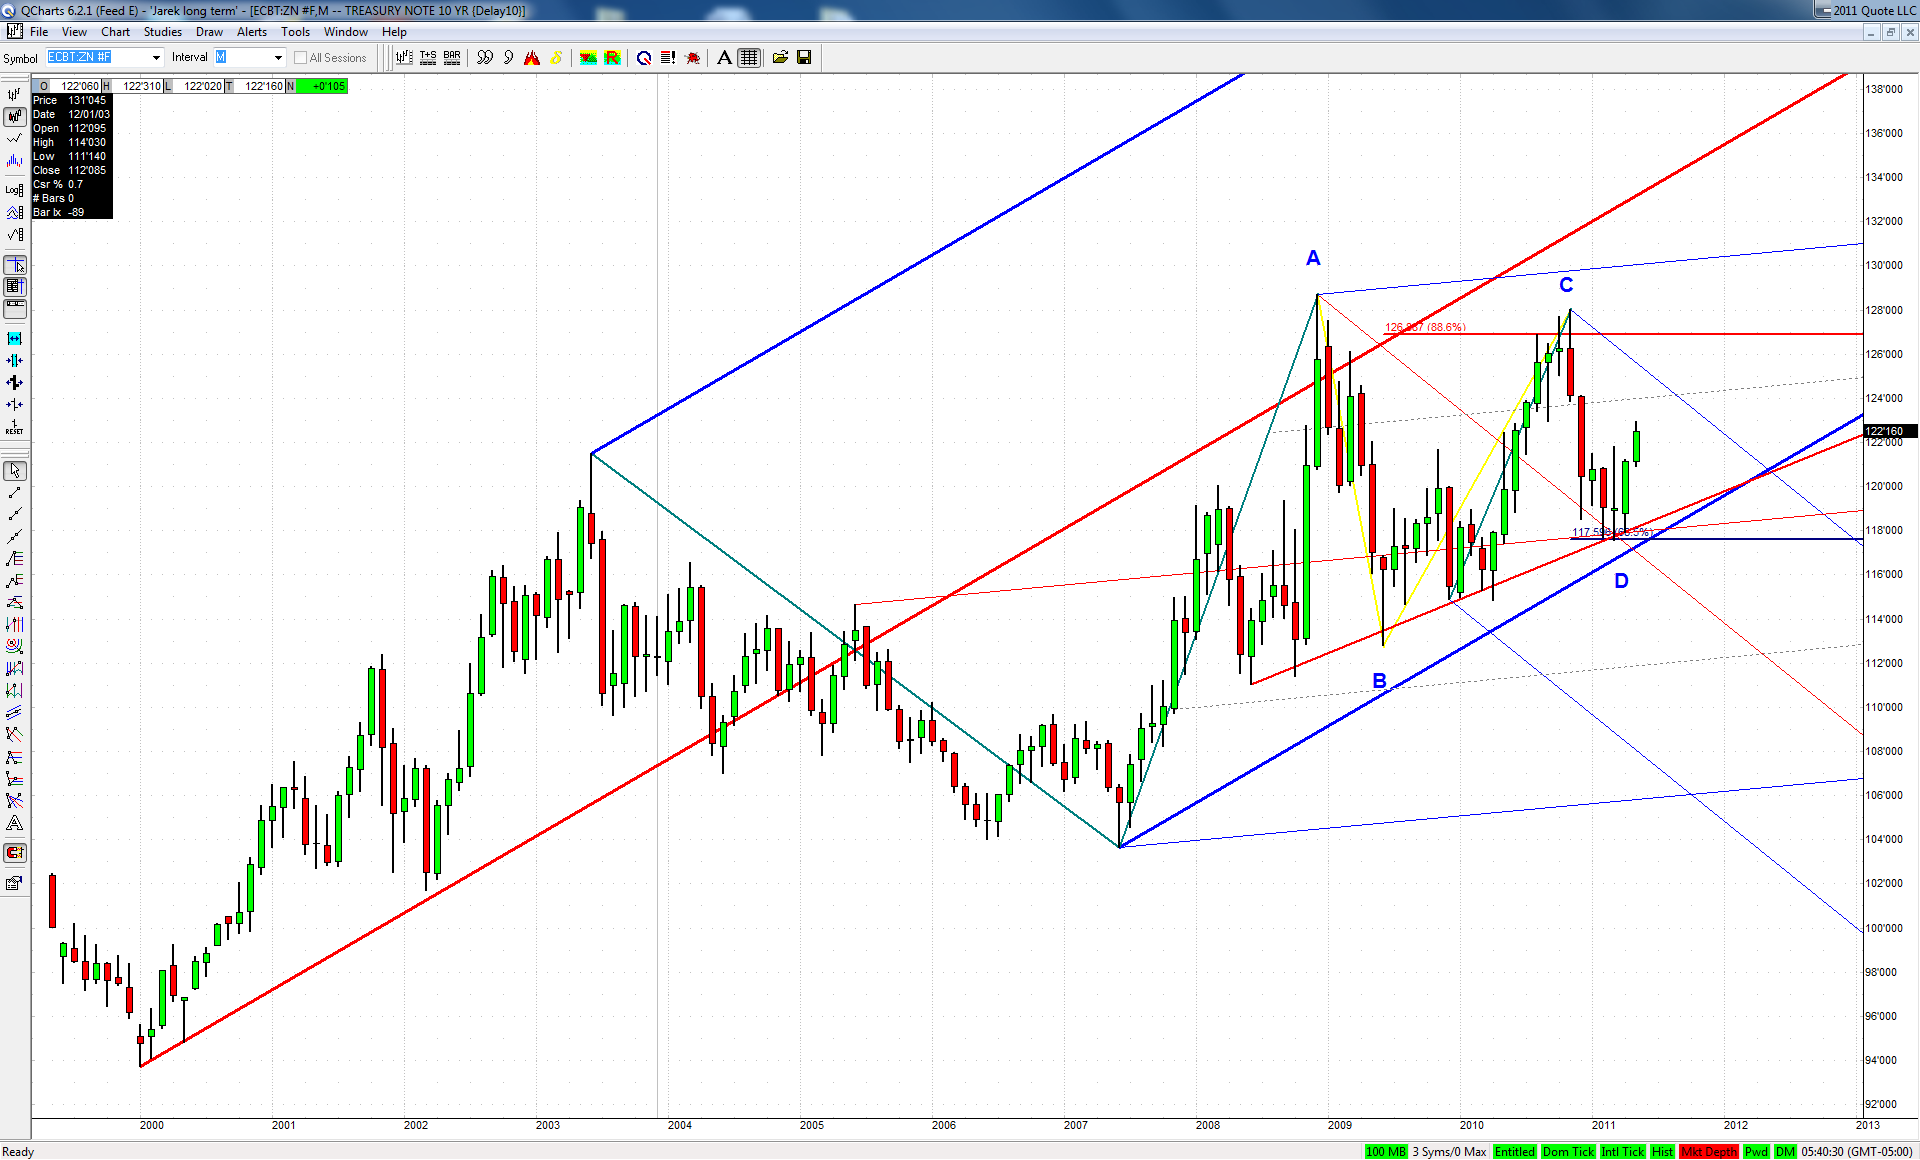
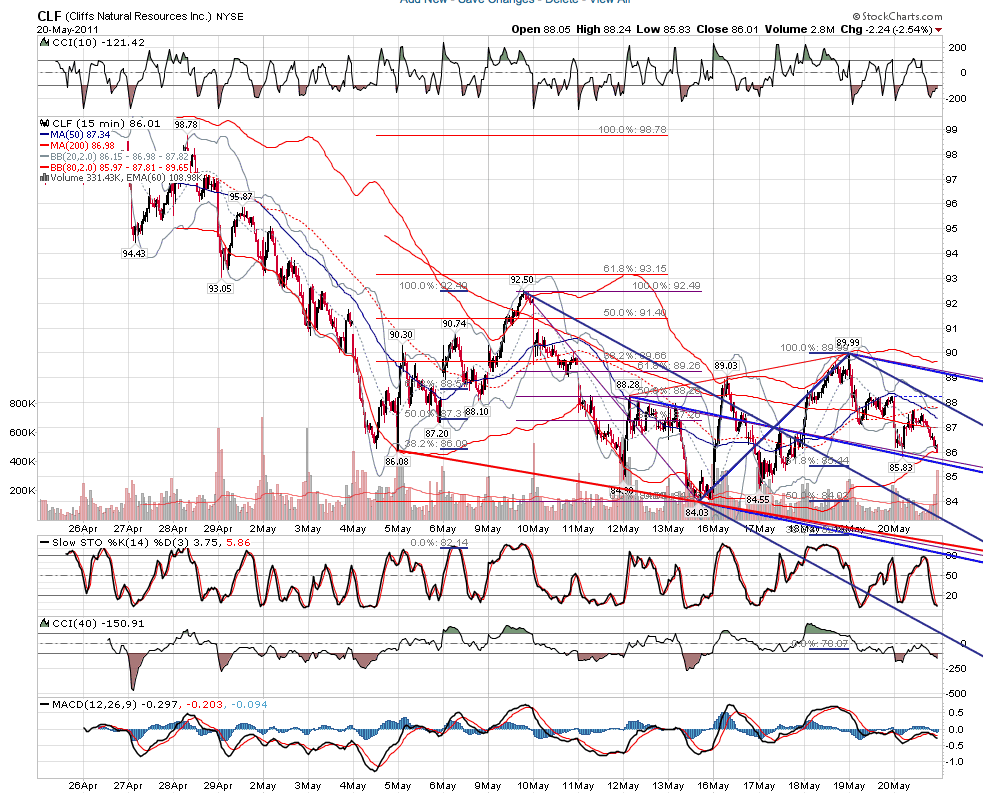
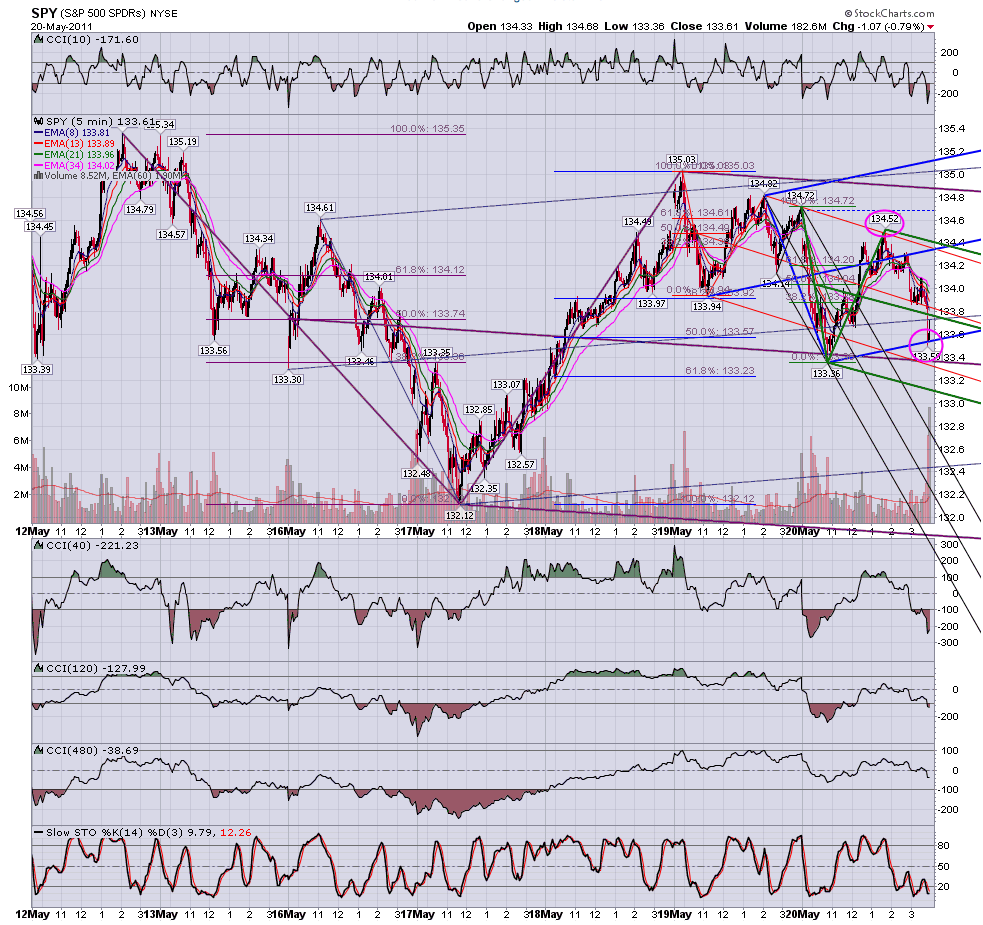
With the bearish case on Bonds being so touted recently I'm wondering whether it's not a big smokescreen suggesting that quite opposite may happen... Especially after looking at the following charts:
RA
rat89
Rep: 0
Posts: 7,015
wonder what they'll do with the cash
Originally posted by jarek
Tomorrow is the end of the world according to one pundit, so maybe some decided to cash in?
RA
rat89
Rep: 0
Posts: 7,015
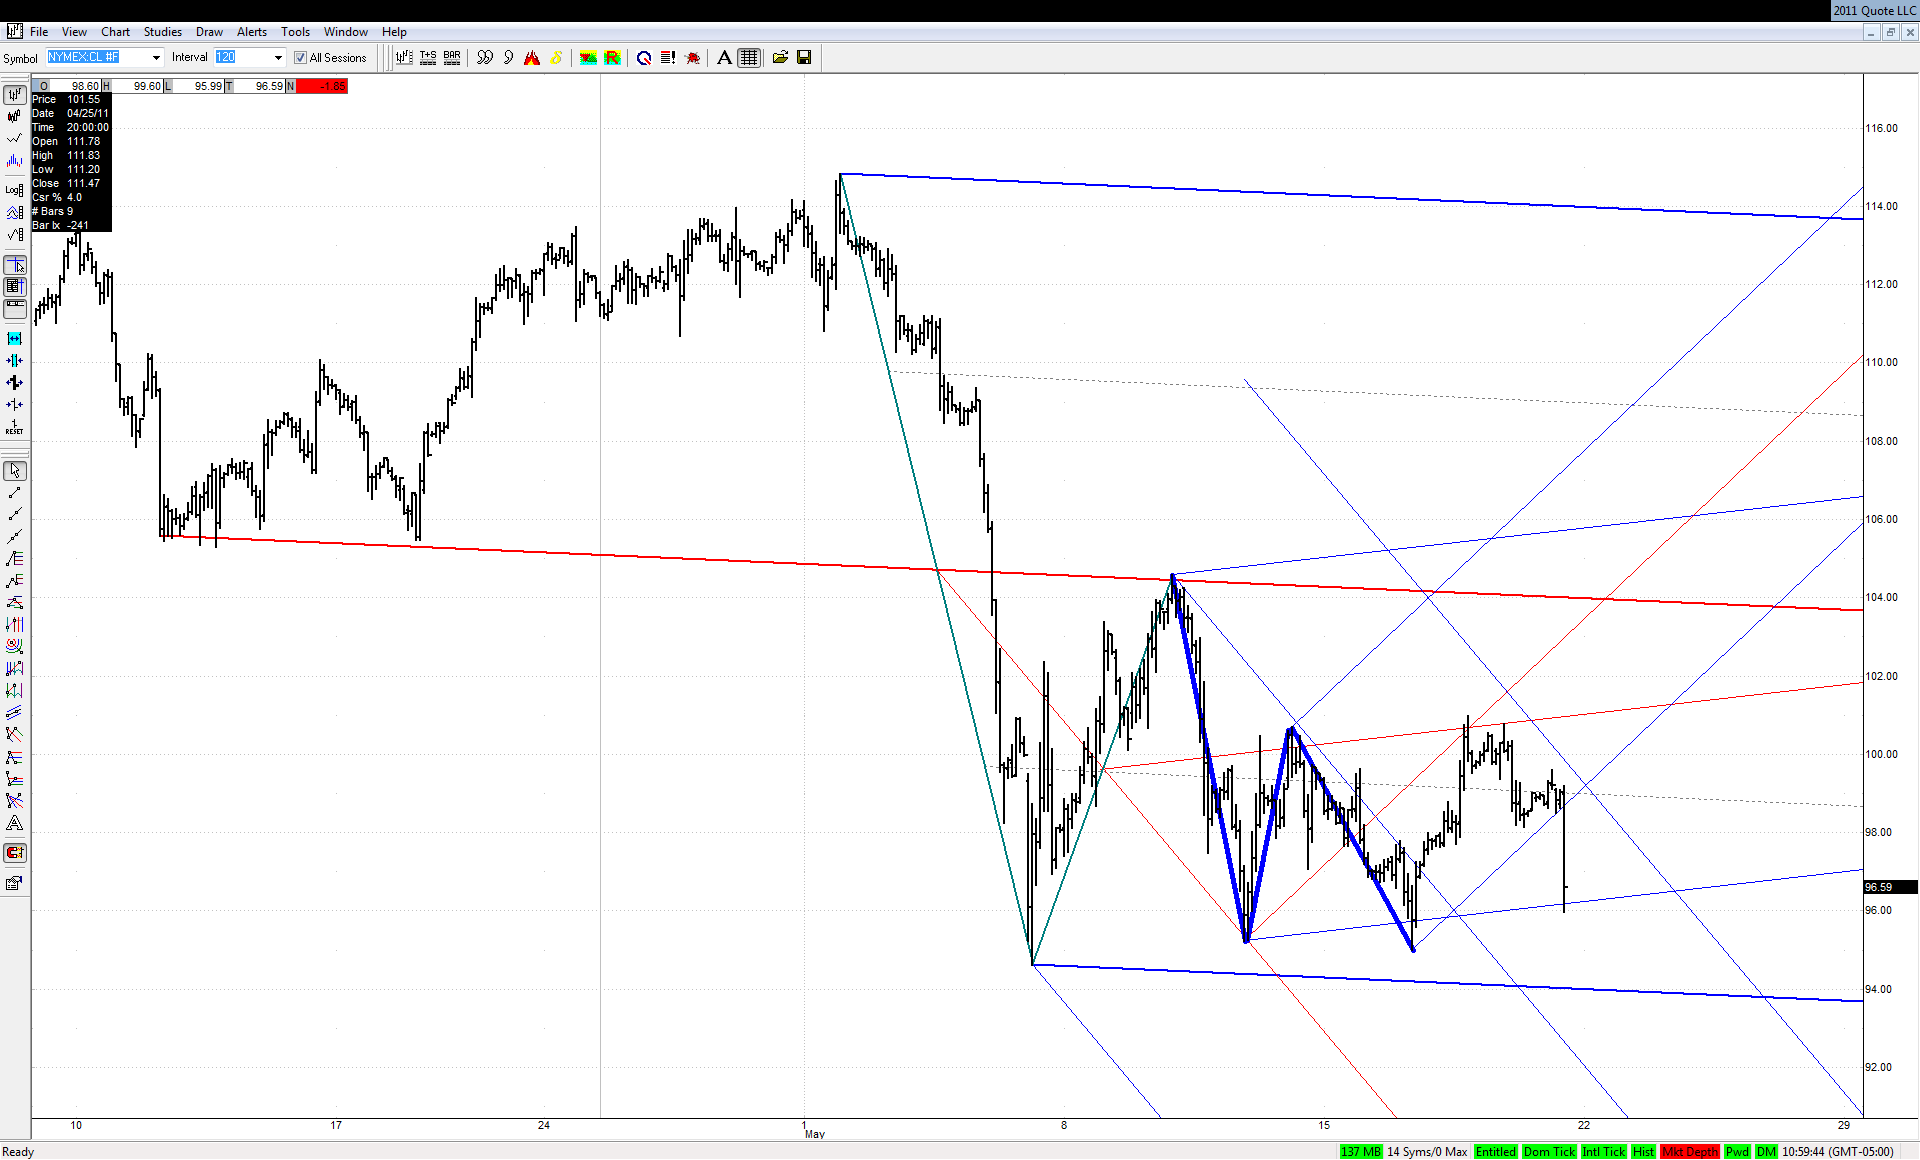
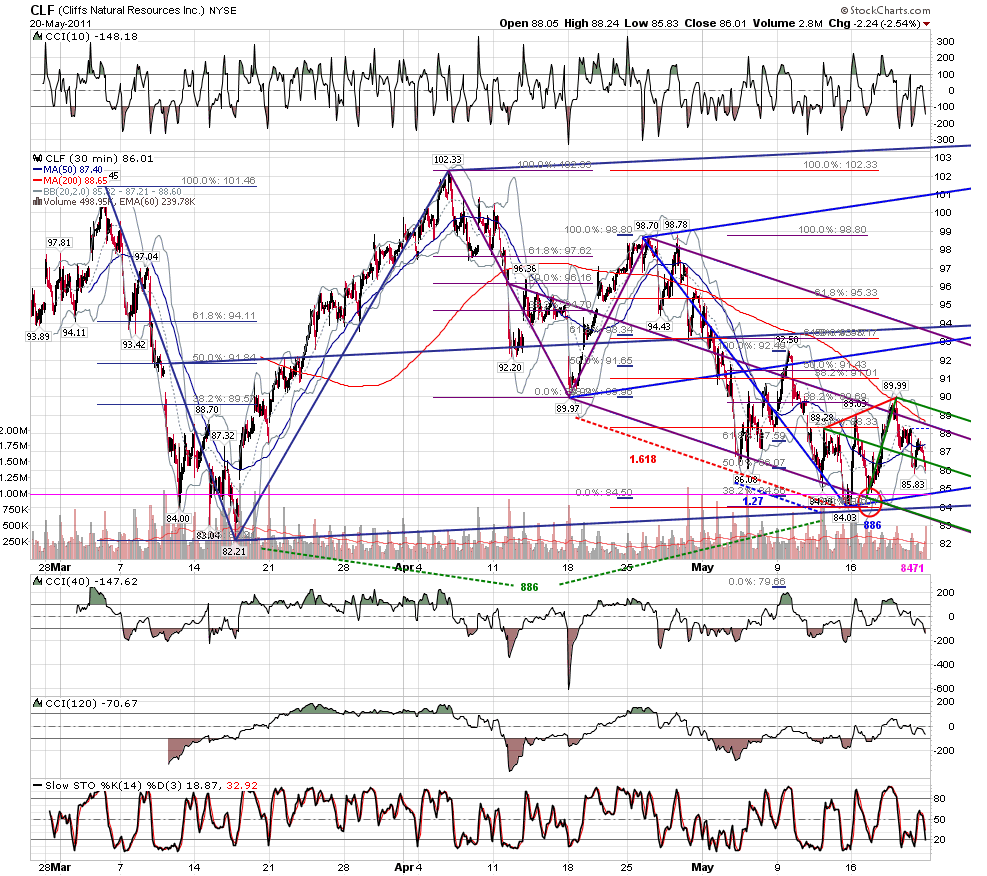
hard for me to tell who's boss here...the low at 84.03 was 1.618, 1.27 and a slight overshoot of 886 of the large swing and close to lower line of big schiff set....since then it has moved up into a 1.27 right in the kz of the move down from 98.78 - green set...is it going to retest and go up or fall right through?
JI
jimkane
Rep: 3,058
Posts: 33,089
Okay, this is my fifth promised post for this weekend. This is it for me. I have to stop promising so many replies, I'm well into my second hour straight of writing and charting on all these.
Okay, first start here for the review:
http://www.mypivots.com/board/topic/1253/40/day-trading
The key thing on this setup is not the chair formation, as outlined in yellow on Duane's chart. It's the bearish patten that forms at a key line (in the bearish case, as shown on Duane's chart, it works the same for bullish patterns, just flipped over), and especially 4PT's. It's really designed for 4PT's, but can be adapted to others. The key pattern and line is shown on Duane's chart at the start of the first yellow line.
Here's a quote from my explanation post on the above linked page:
"I get the expected reaction off that, and it sells (in the case of a short pattern), usually to an expected spot. It then bounces up in the first correction of the new possible trend. So far, so good. It then rolls back over. Everything is on track at this point. But this is 'wave 3' supposedly, or 'wave 3 of wave 1'. This wave should accelerate. It stops somewhere near the previous swing, slightly above, below, or equal to it, and then starts back up. Although it is possible for this to be a 'wave 2 of wave 3', it's unlikely.
Now, here's the key for me. There is usually a very noticeable line right in here, not only over the recent peaks, but from before, usually the line the setup was based on. It usually closes right here. Although it could roll right off this spot, it seems to gap or explode up. This price action is not in keeping with the setup and layout. It frequently looks like a rocking chair, but it needs the key line, and all based on a big setup with respect to the current swing sizes. Look back to that 4-Point and the other example I mentioned. Your example is a classic case. You have a 4-Point, it makes the outlined moves, right to the trendline, where it closes. Next day a big gap and run."
So, to answer your question, the rocking chair part is there in your chart, but it isn't the same setup as I described for this specific setup. Look closely at Duane's chart and read and reread all my description there and you should be able to see the gist of what this looks like. It's all about how it keeps saying the original pattern may work out, technically it isn't violated, but you can just see it isn't acting right.
Originally posted by jarek
I see now chairs everywhere Please remember Jim to come back with the answer:
RO
roofer
Rep: 3,689
Posts: 3,574
just traders trading..... if the red line green set on yesterdays close was to be valid,in the face of the insane last hour bullishness, then OUR TOOLS, AND NOTHING ELSE.... should have pointed to RISK OFF!!! in the face of the manipulation in the indexes.... i think they did their job.... and all the way down today... they said repeatedly trend day shooting for targets...