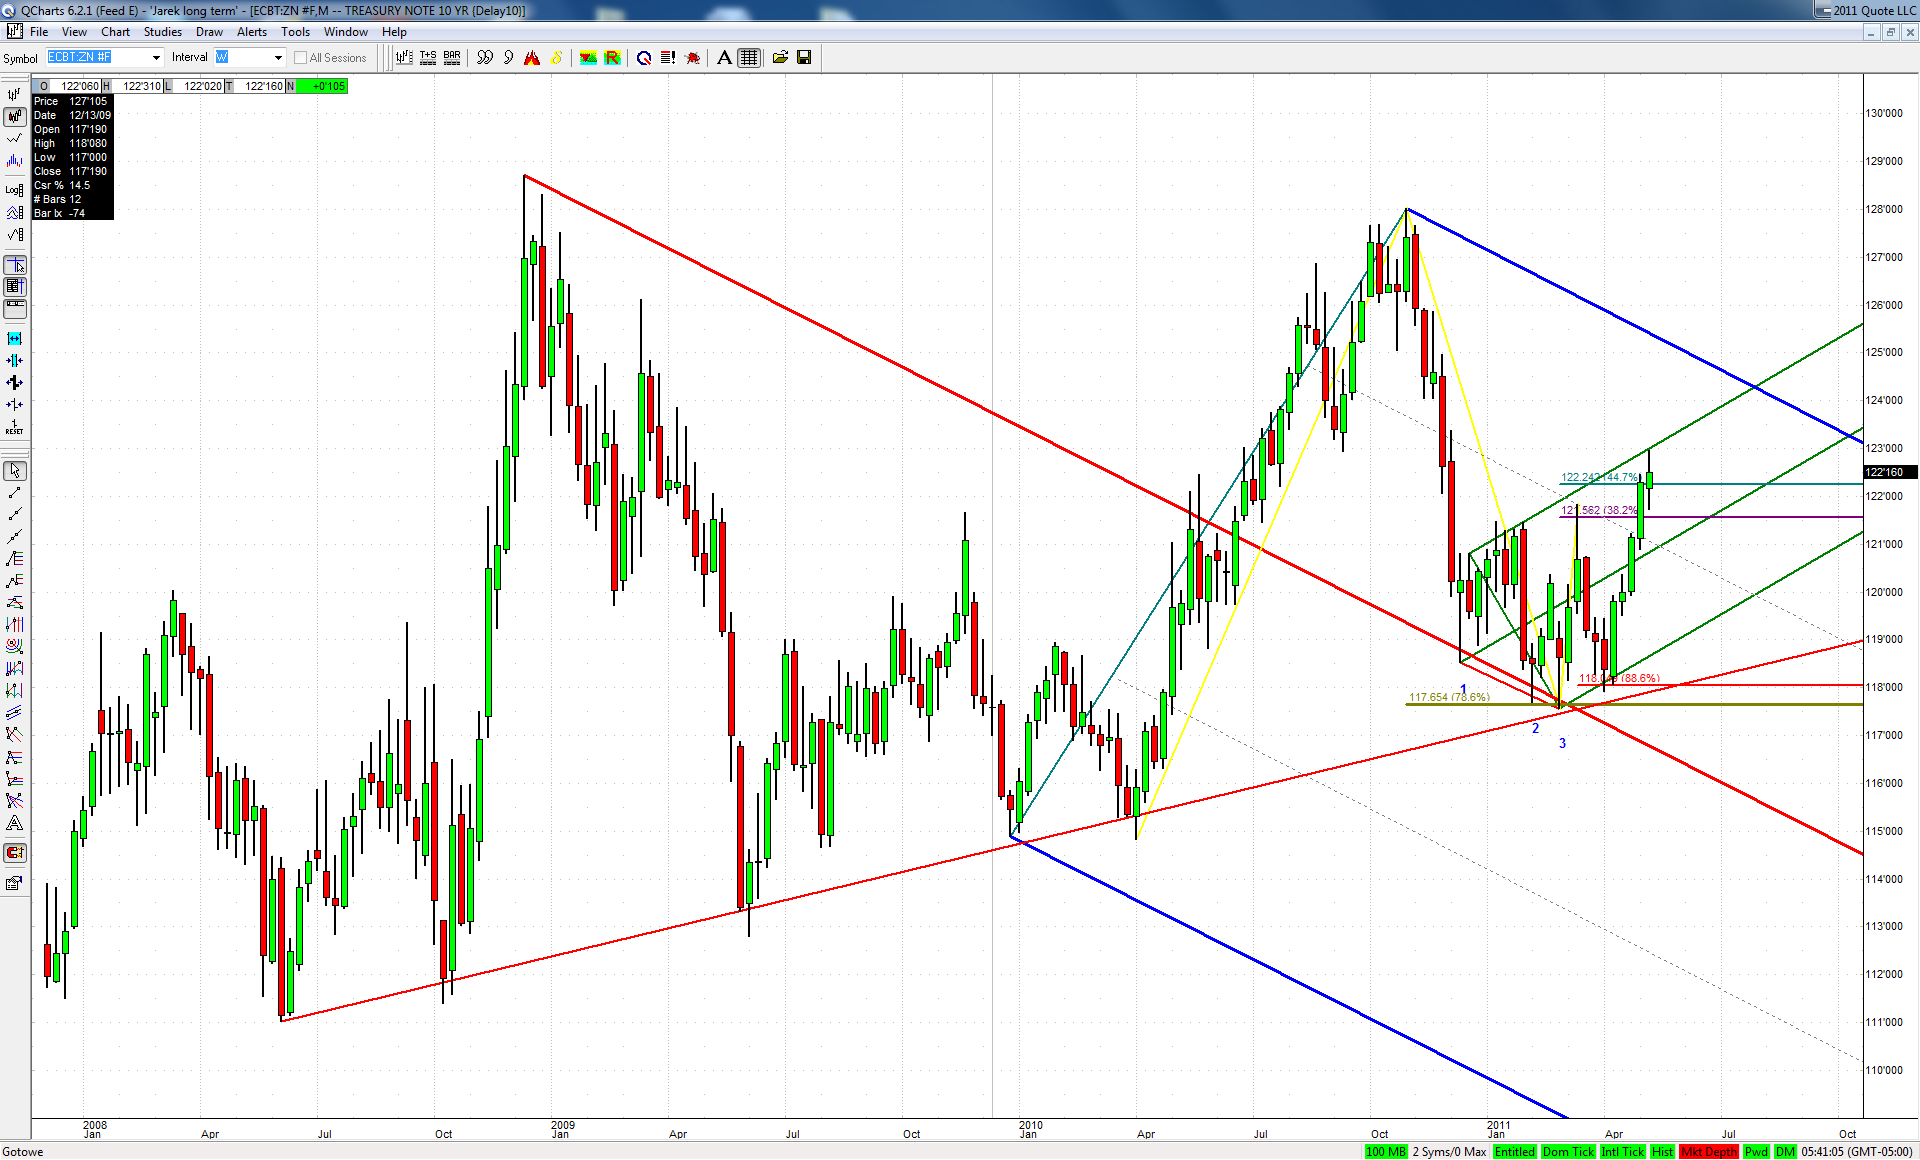
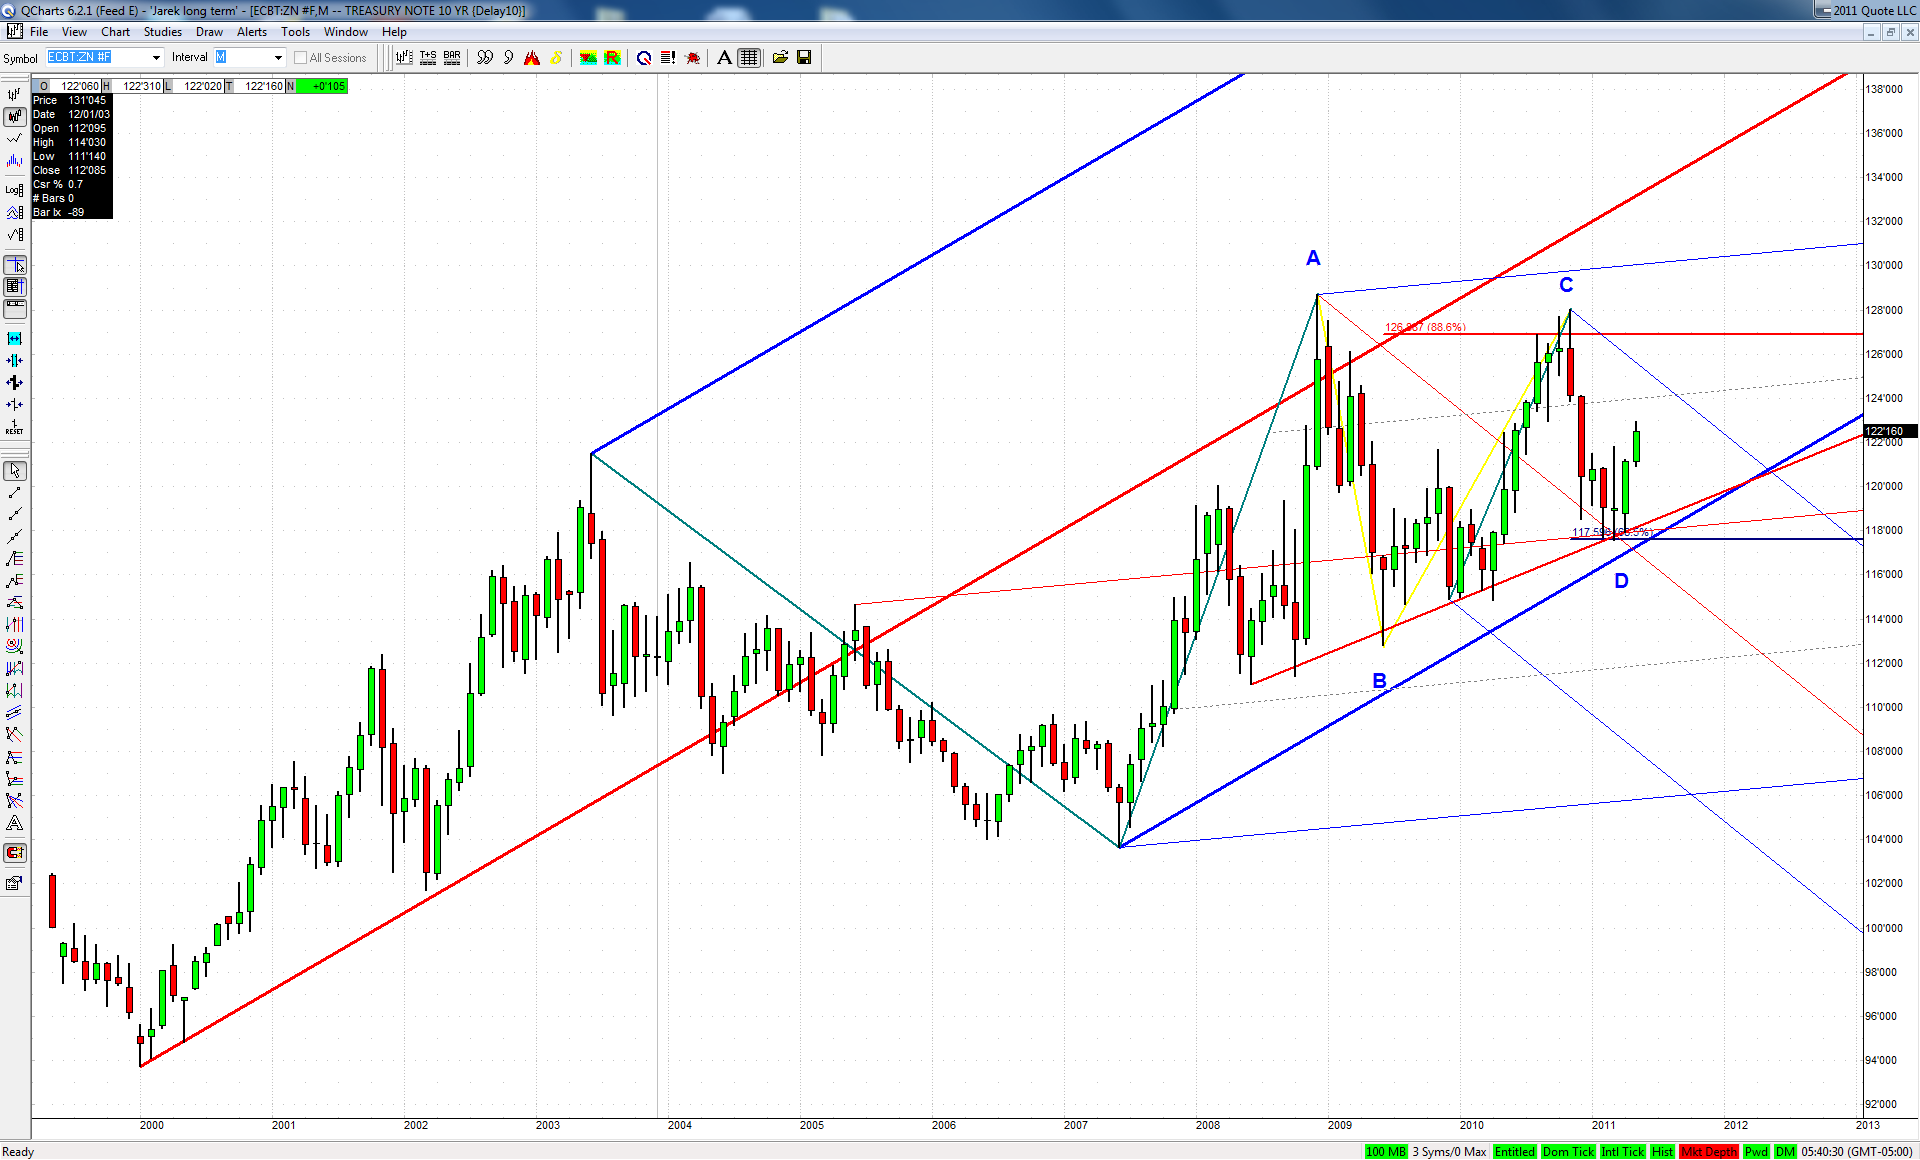
With the bearish case on Bonds being so touted recently I'm wondering whether it's not a big smokescreen suggesting that quite opposite may happen... Especially after looking at the following charts:
AL
albert
Rep: 99
Posts: 3,094
Originally posted by MarcinO
Originally posted by albert
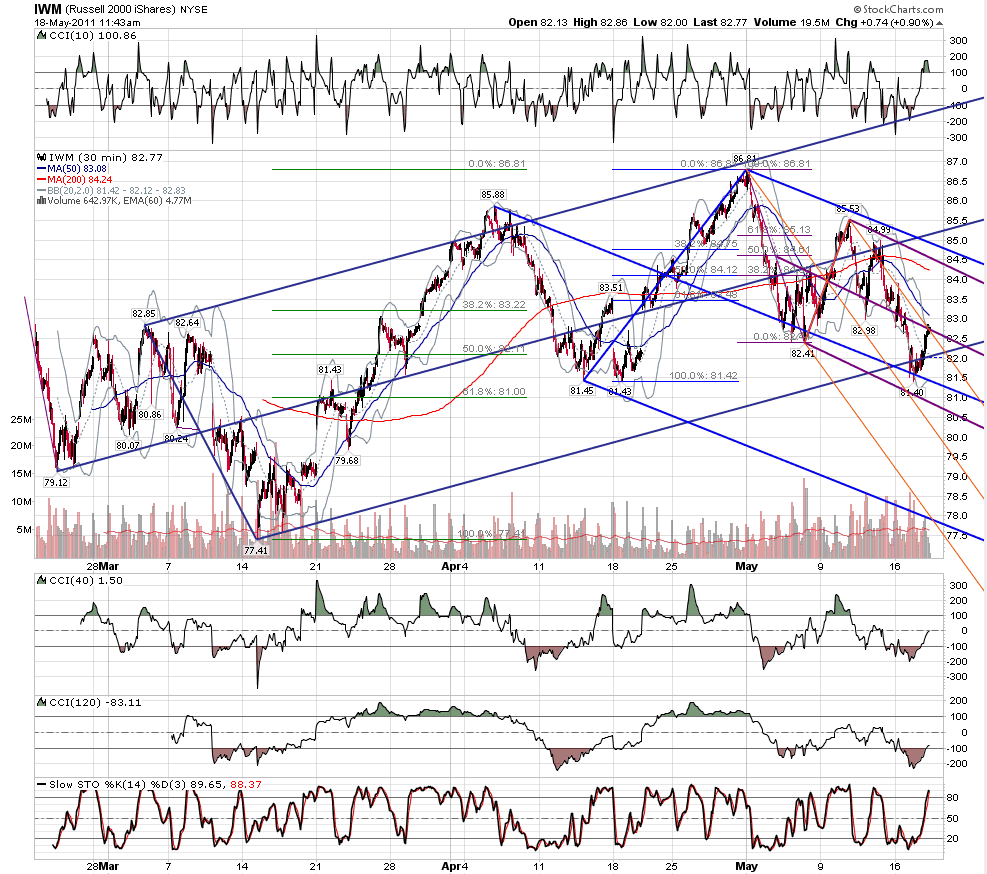
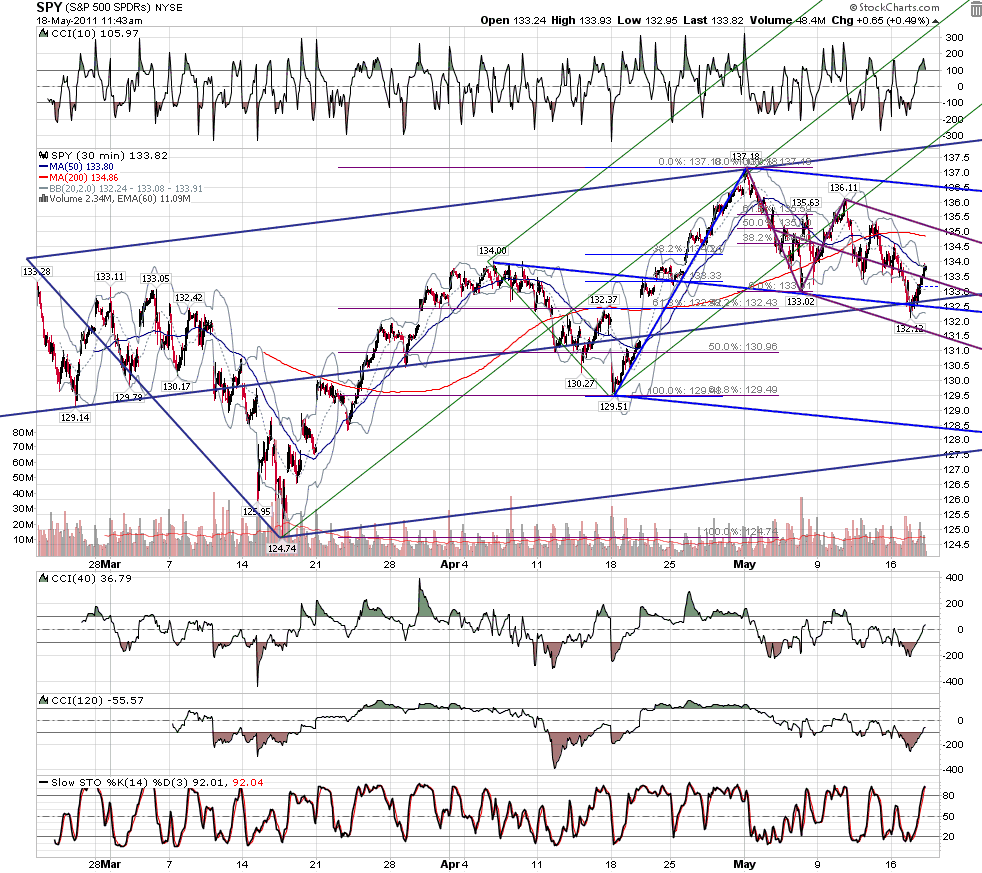
Two Kane Pattern-Line-Fibs (PLFs) or a Kane PLF and a Kane DT ABCD in SPY RTH. Kane Trading rocks!
Good Trading,
Al Kamego
Great chart!
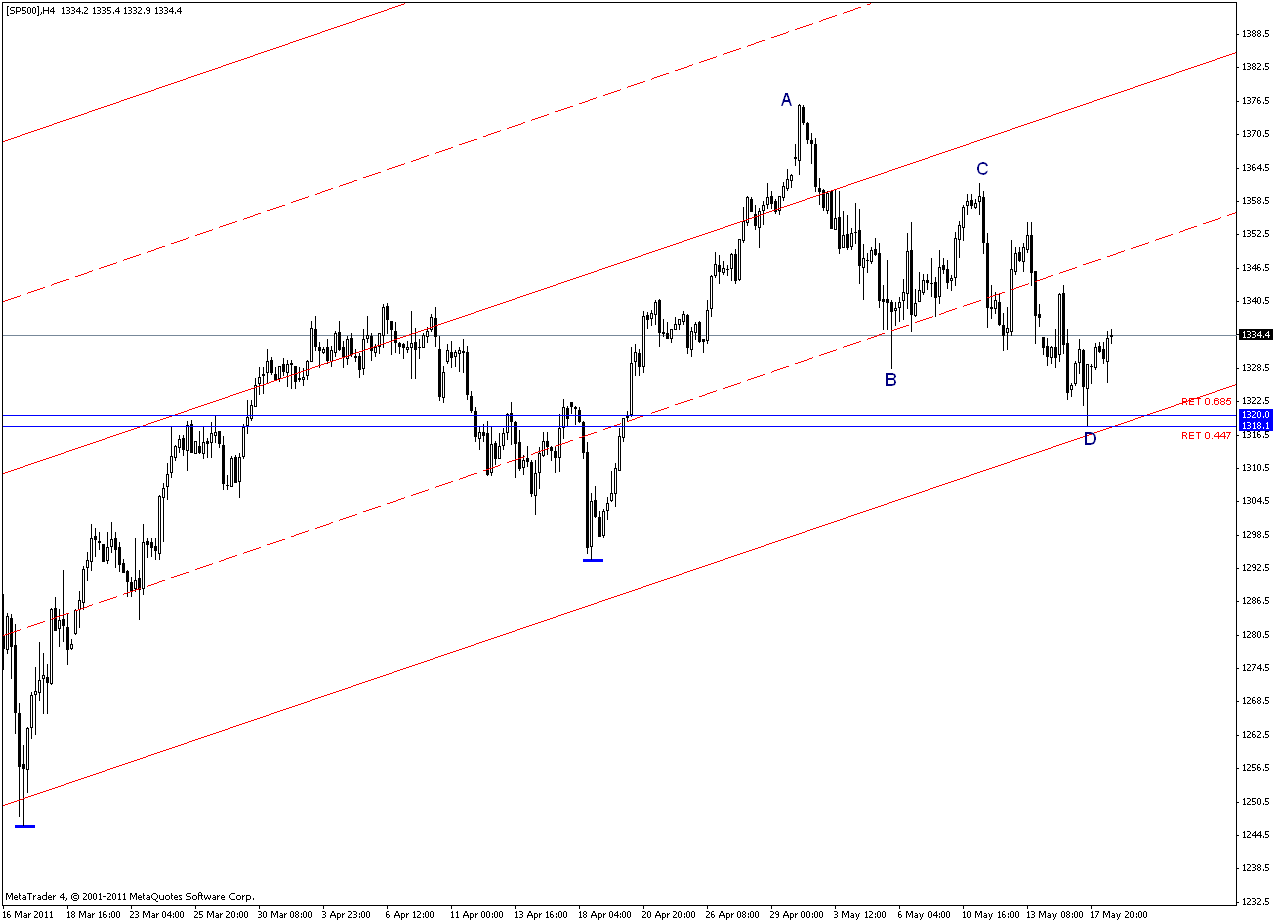
I think it may be driven by a daily/4H ABCD set-up.
The two retracement shown group with APP and ER of ABCD near ML lower //.
I show it on SP500 as I have no access to SPY.
MarcinO,
Thank you for the compliment.
I agree with your comments about the ABCD taking part in the move. The ABCD makes a nice Kane Pattern-Line-Fib on the mod Schiff ML Set per the chart I have made. I like your charts, they are very clear. I only get SPY RTH with my International Brokers Account.
Good Luck and welcome aboard.
Good Trading,
Al Kamego
JI
jimkane
Rep: 3,058
Posts: 33,089
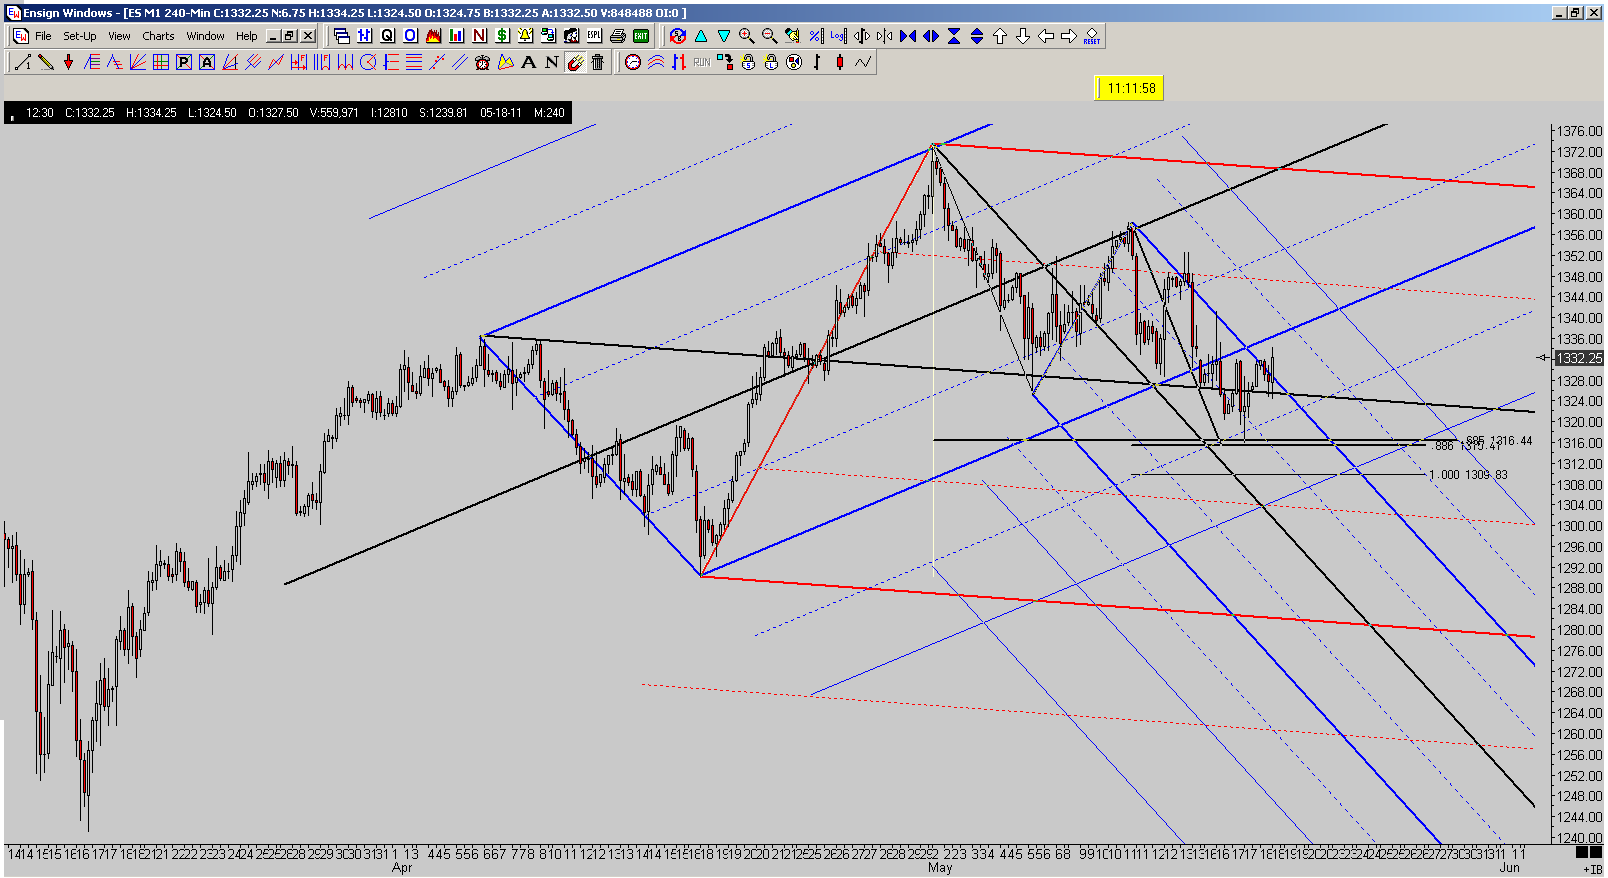
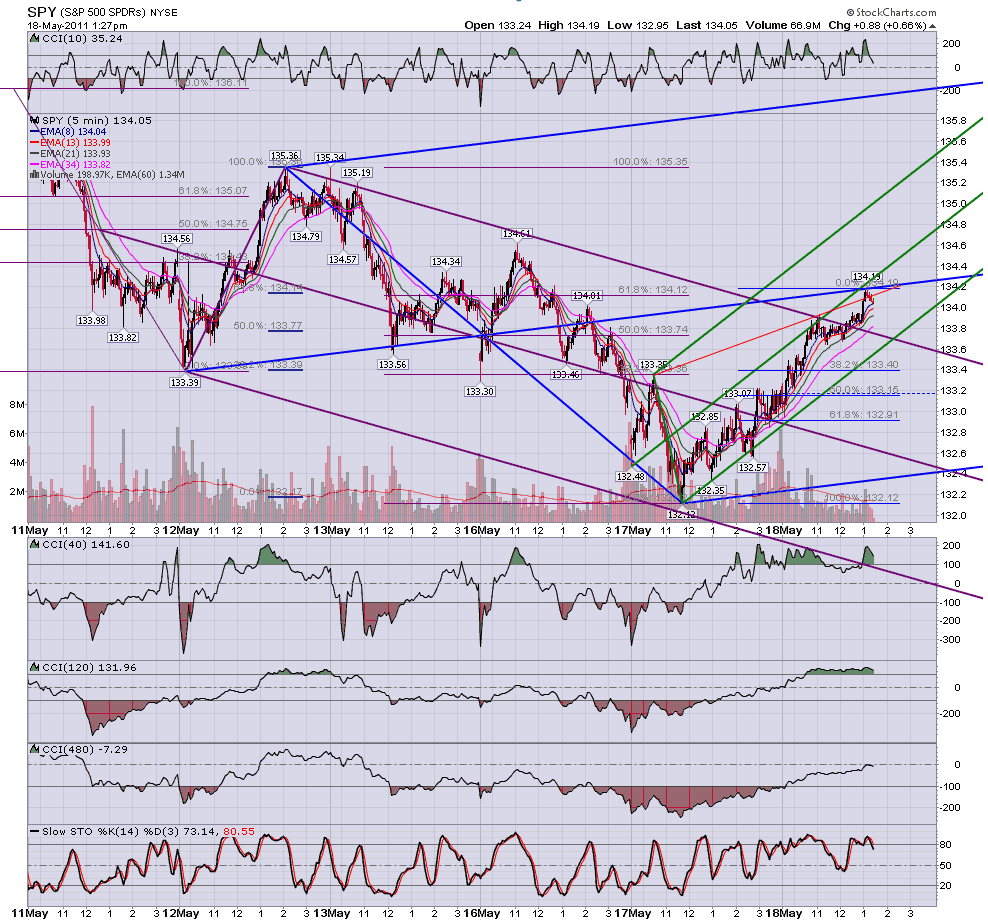
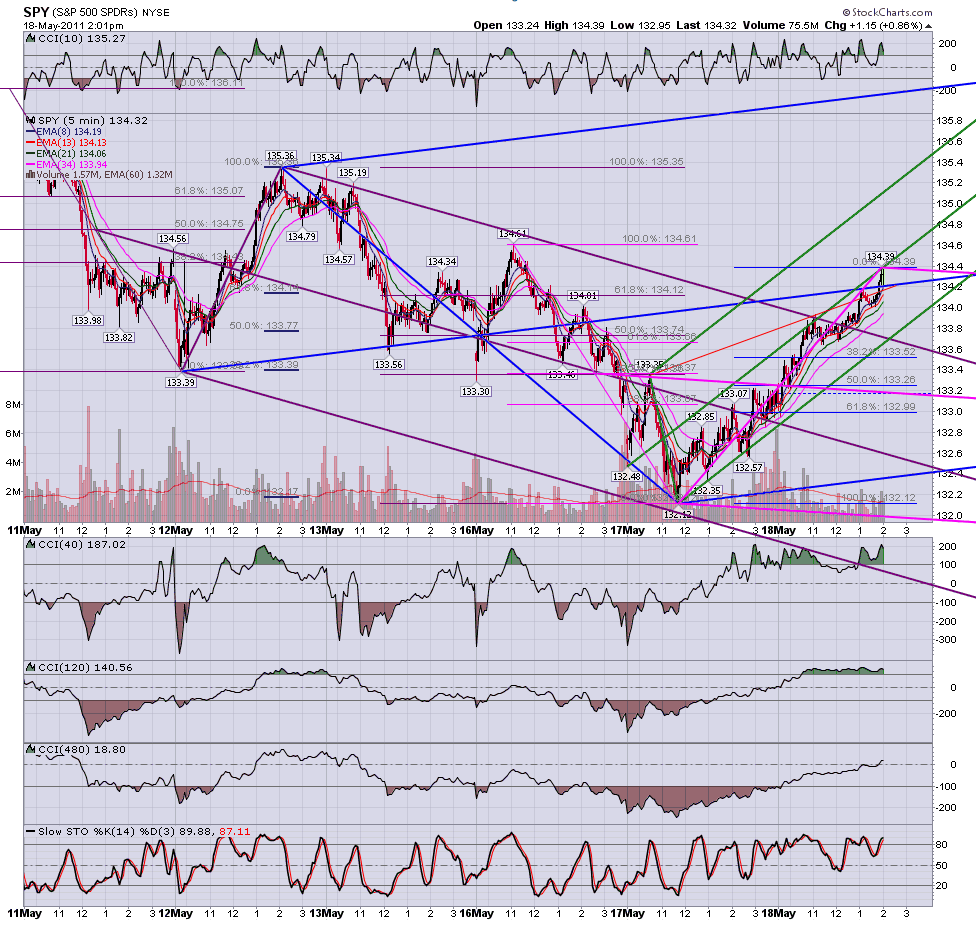
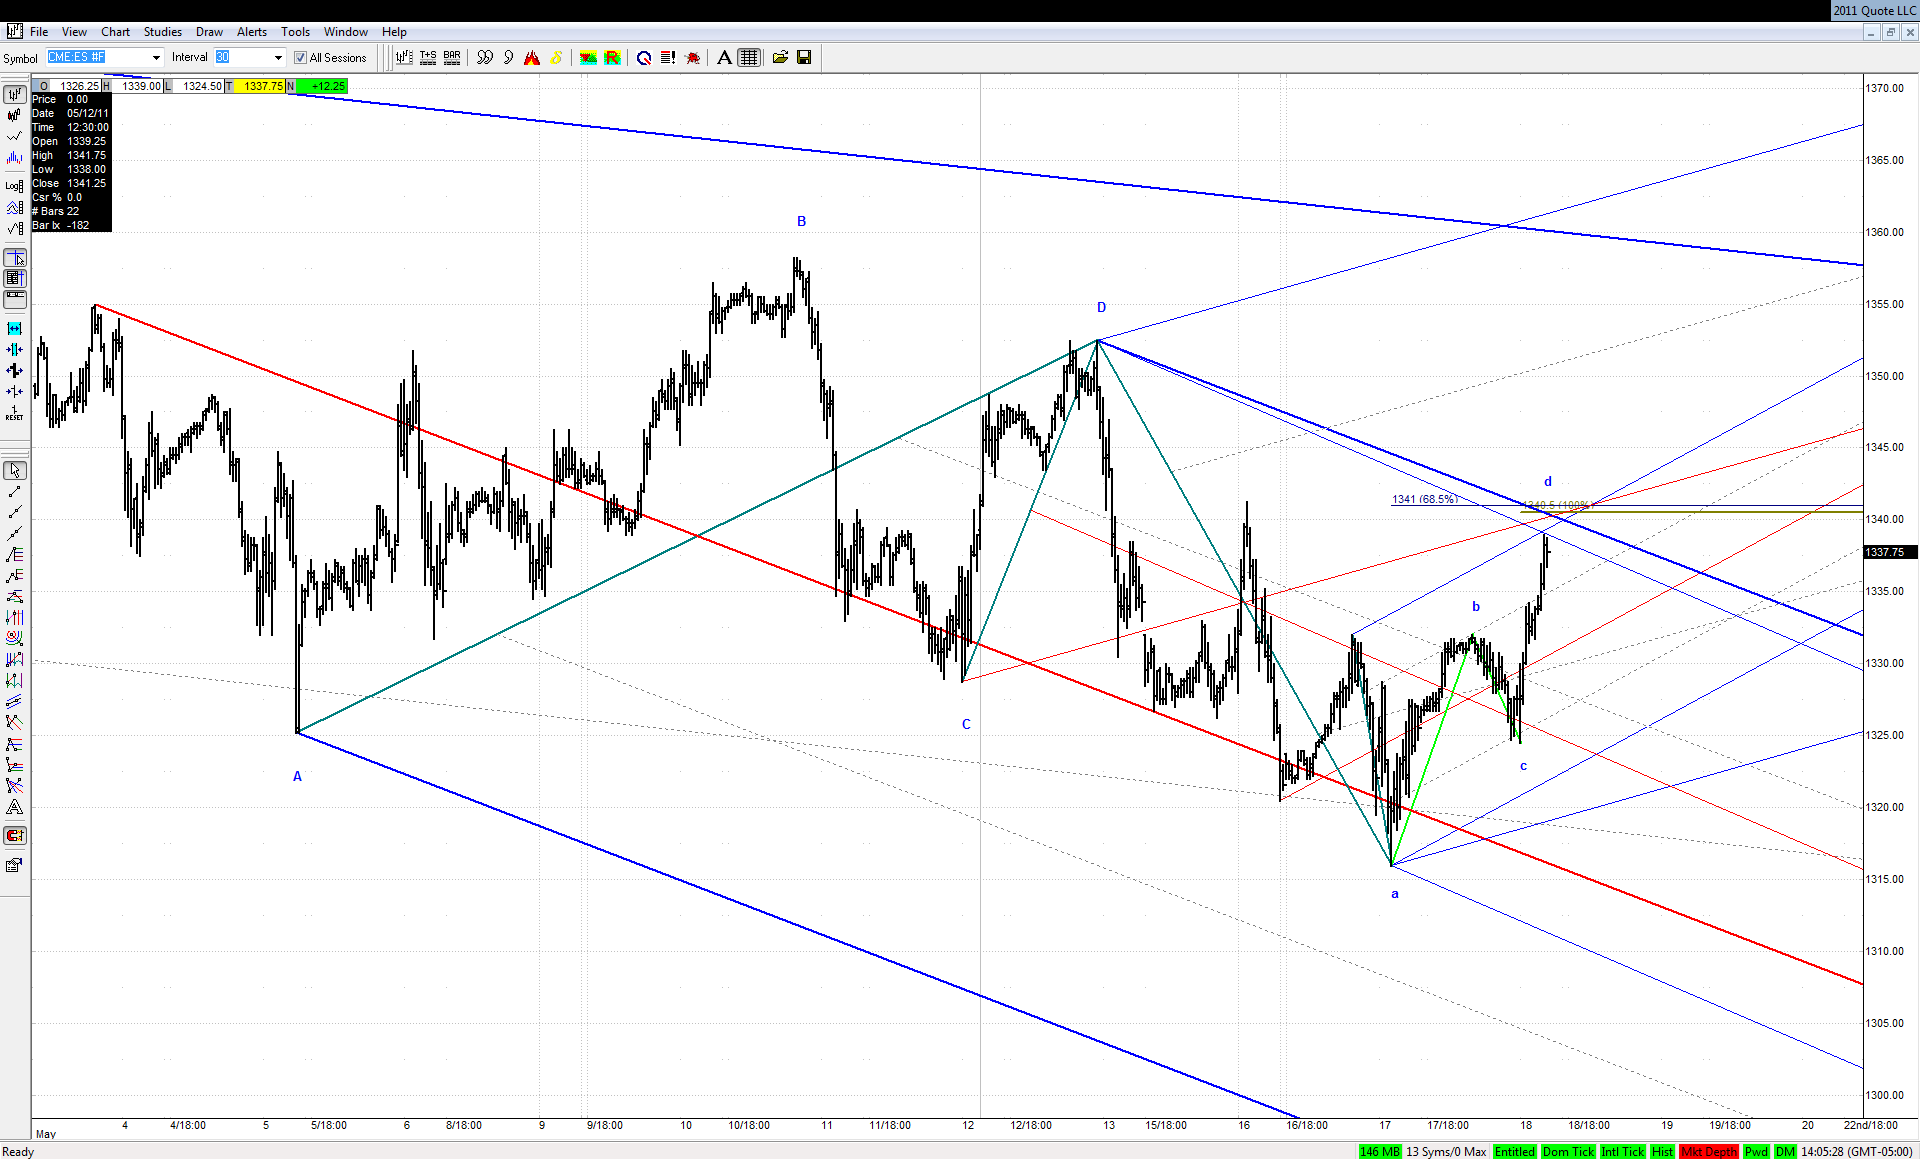
ES bearish ABCD just overhead. Traded timeframe 120-min all-sessions. I suspect this is not a CD leg here, but a 'W3' up. We'll see.
JI
jimkane
Rep: 3,058
Posts: 33,089
Top of the hour Fed minutes. That should get things moving. Since they want up, probably be a catalyst for that. Assuming it doesn't drop off the bigger ABCD (Hah!).
JI
jimkane
Rep: 3,058
Posts: 33,089
I can't say enough how we are at a key spot coming up right in here. My signals say 'acceleration' for the rest of today if this area is moved through to any extent. 1.000 ABCD is at 40.50.
RO
roofer
Rep: 3,689
Posts: 3,574
just traders trading..... if the red line green set on yesterdays close was to be valid,in the face of the insane last hour bullishness, then OUR TOOLS, AND NOTHING ELSE.... should have pointed to RISK OFF!!! in the face of the manipulation in the indexes.... i think they did their job.... and all the way down today... they said repeatedly trend day shooting for targets...