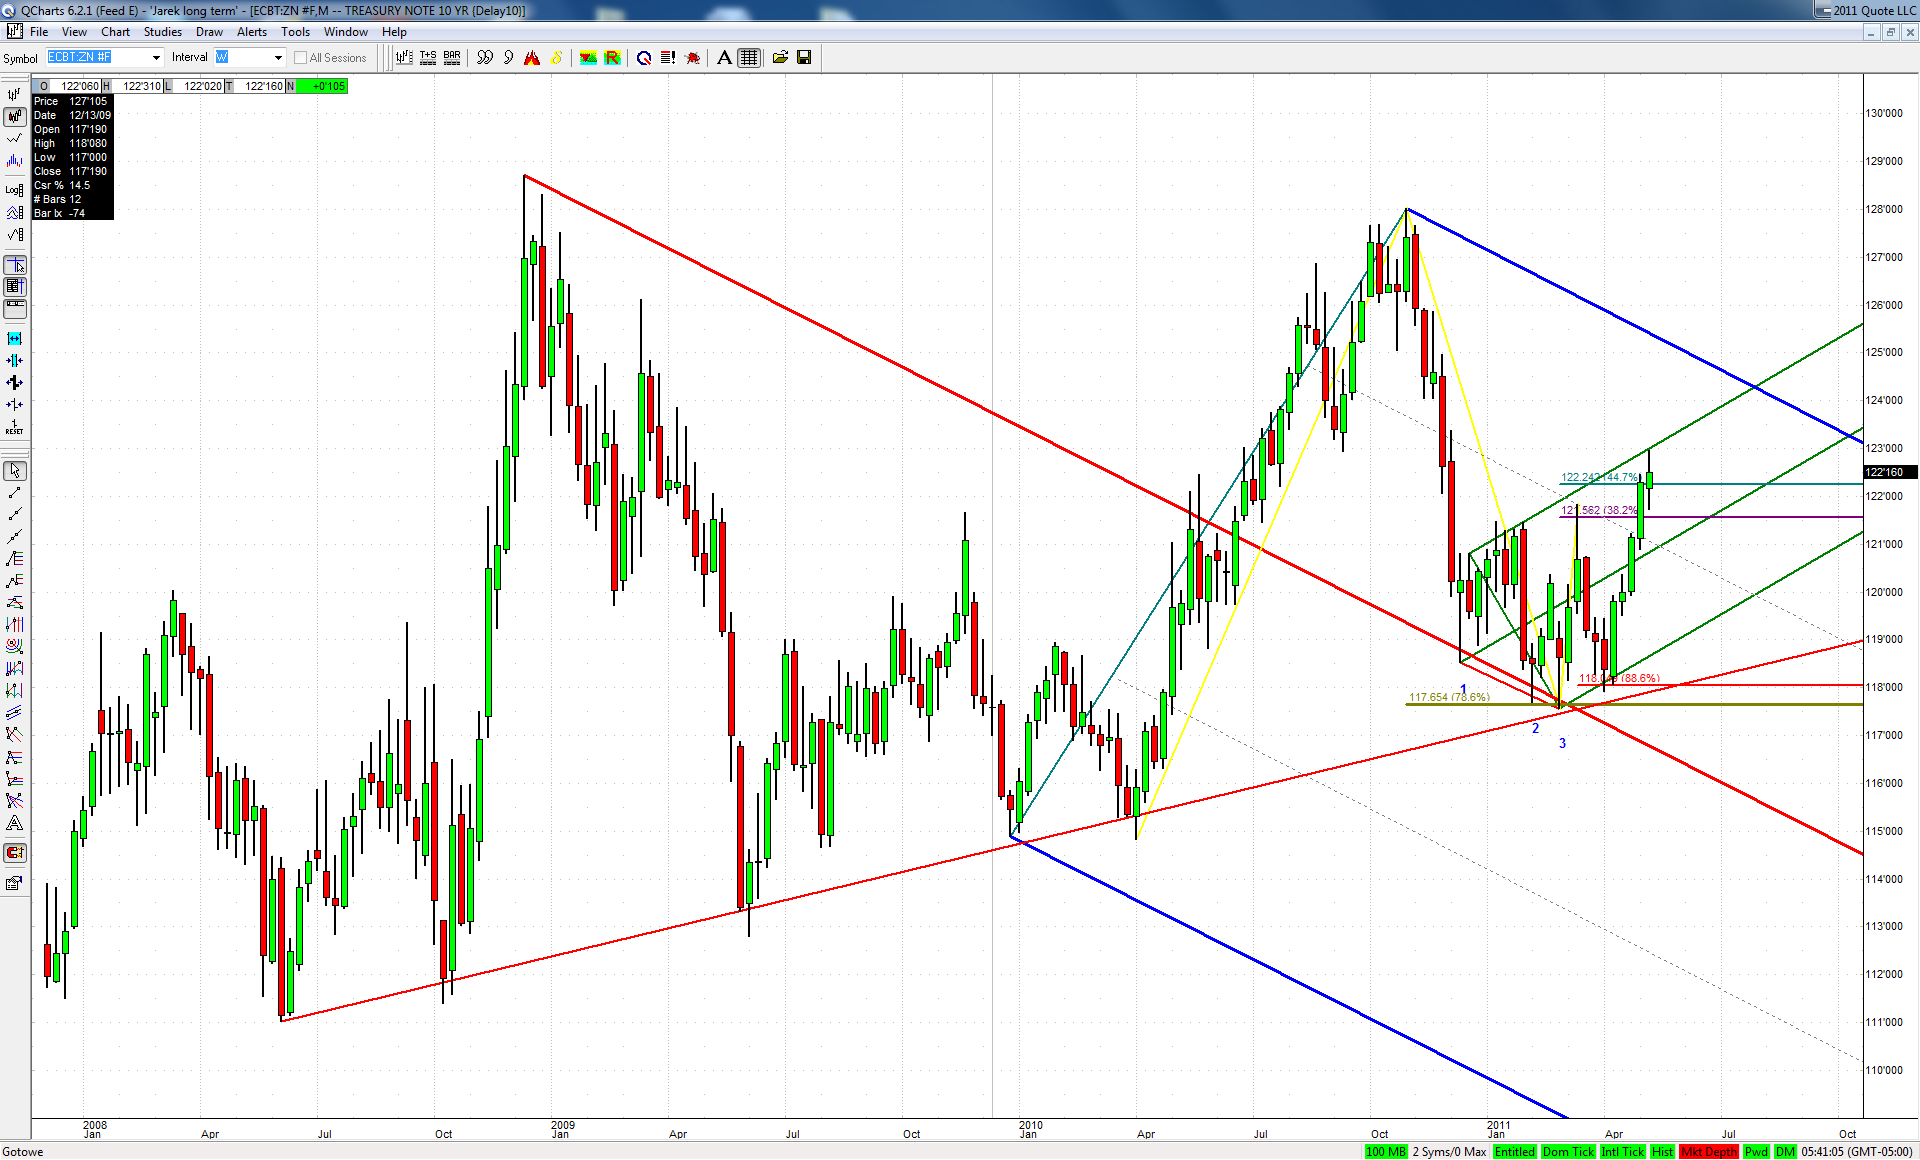
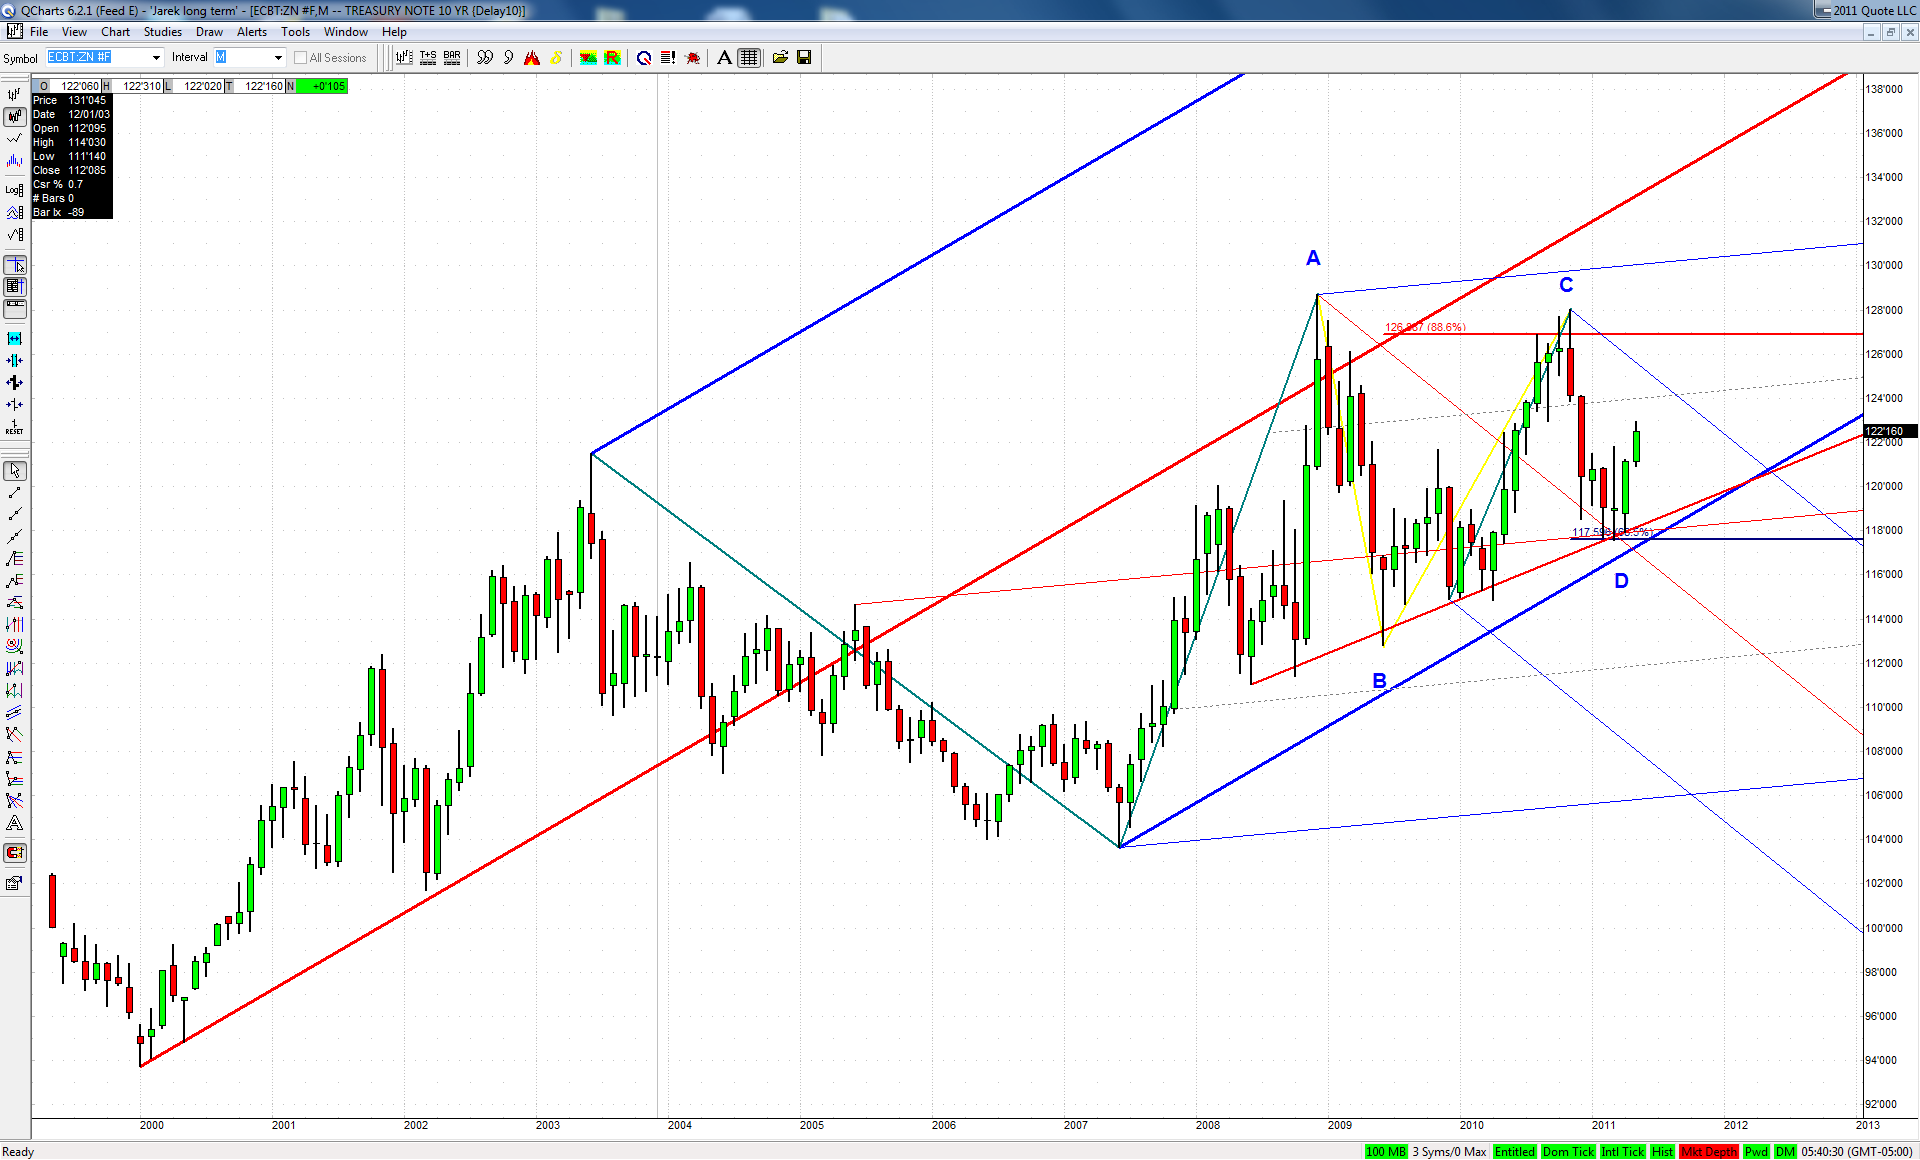
With the bearish case on Bonds being so touted recently I'm wondering whether it's not a big smokescreen suggesting that quite opposite may happen... Especially after looking at the following charts:
JI
jimkane
Rep: 3,058
Posts: 33,089
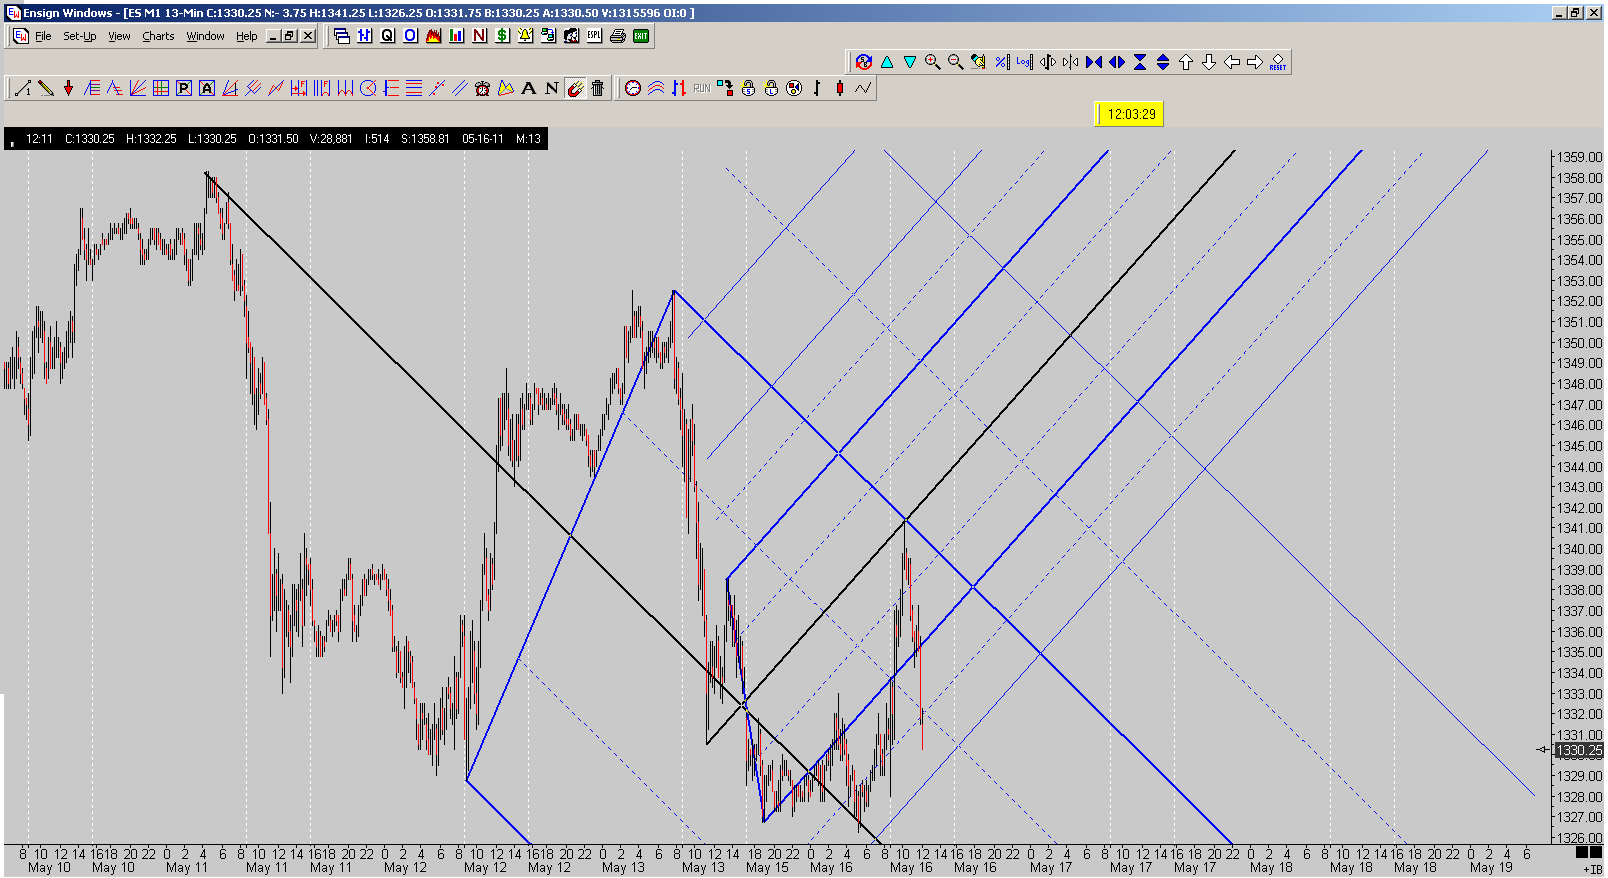
If/when this 'lateral support' zone at 25.25 gives way, there is nothing but air below...
JI
jimkane
Rep: 3,058
Posts: 33,089
Well, there are the three ABCD levels below (16, 10, and 5, appx.), but nothing for others to see until 1290, which may drive this through to get to my 1280ish level, hitting all those 1290 stops... Just some thoughts.
JA
jarek
Rep: 94
Posts: 3,474
Originally posted by albert
...I follow your charts and comments and you are certainly helping me to learn about trading...
I'm happy to hear that while learning myself I can help others to learn too
JI
jimkane
Rep: 3,058
Posts: 33,089
Mid 20's hits the lateral support, GLOBEX low, and a key line. Next stop, all aboard...
JI
jimkane
Rep: 3,058
Posts: 33,089
I need a better imagination.
Originally posted by jimkane
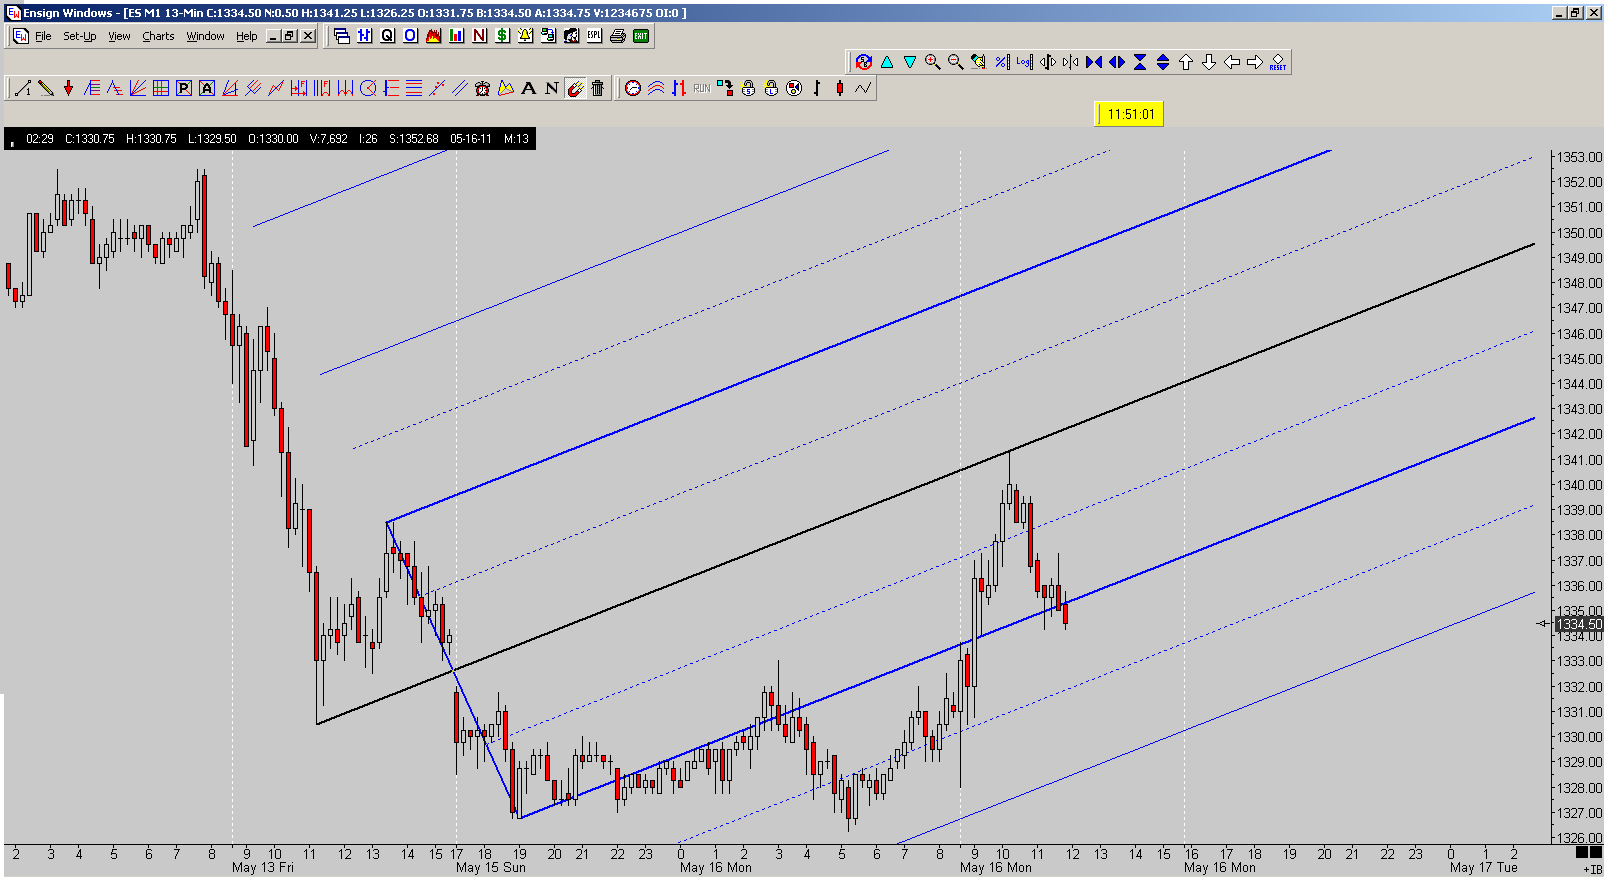
I can't imagine it doesn't bounce at least a little.
RO
roofer
Rep: 3,689
Posts: 3,574
just traders trading..... if the red line green set on yesterdays close was to be valid,in the face of the insane last hour bullishness, then OUR TOOLS, AND NOTHING ELSE.... should have pointed to RISK OFF!!! in the face of the manipulation in the indexes.... i think they did their job.... and all the way down today... they said repeatedly trend day shooting for targets...