ES Day Trading 5-25-2011
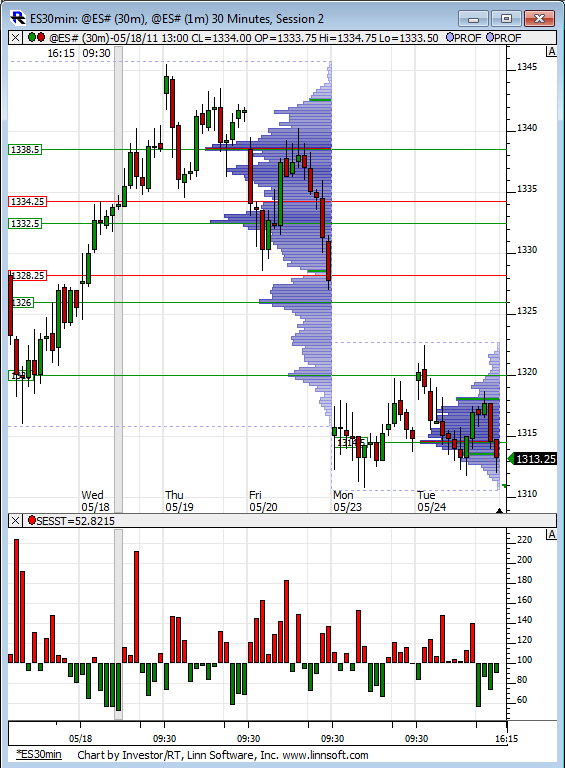
Two vprofiles on this chart. Last weeks and the developing one for this week. Tight range so far this week and the bell curve shaped profile signaling a fight between bulls and bears. Interesting to note VPOC is below last weeks range.
Click image for original size
Long off this post report low at 07.25..... 1305 and O/N low are also key downside
upside is peak volume at 1310 and my target ...further keys upside are 1314 - 1316.. **** key zone
upside is peak volume at 1310 and my target ...further keys upside are 1314 - 1316.. **** key zone
Agree totally about key zone,
50% of the 24hour price week is 1314.60
50% of the RTH only week is 1316.63.
50% of yesterday's RTH range is 1317.13
50% of the 24hour price week is 1314.60
50% of the RTH only week is 1316.63.
50% of yesterday's RTH range is 1317.13

Would really like to see a 8.25 print during RTH, but I feel we have come close enough.
Away to the gap fill... 14.75
Away to the gap fill... 14.75
my one little runner would like to see this stay above the open print and the 1310 in order to target O/N highs....we know one of the O/N ranges should run today...hoping it's the highs
flat at 13 even.......just too close to find a decent stop loss and close to key zone
short from 13.50
short 13.25 and a little late...air below but 11.50 is target
flat 13.75..will try again from abocve 15 if it comes
There's the GF.
Trying a short, but I think it could easily get to 16-17.
Trying a short, but I think it could easily get to 16-17.
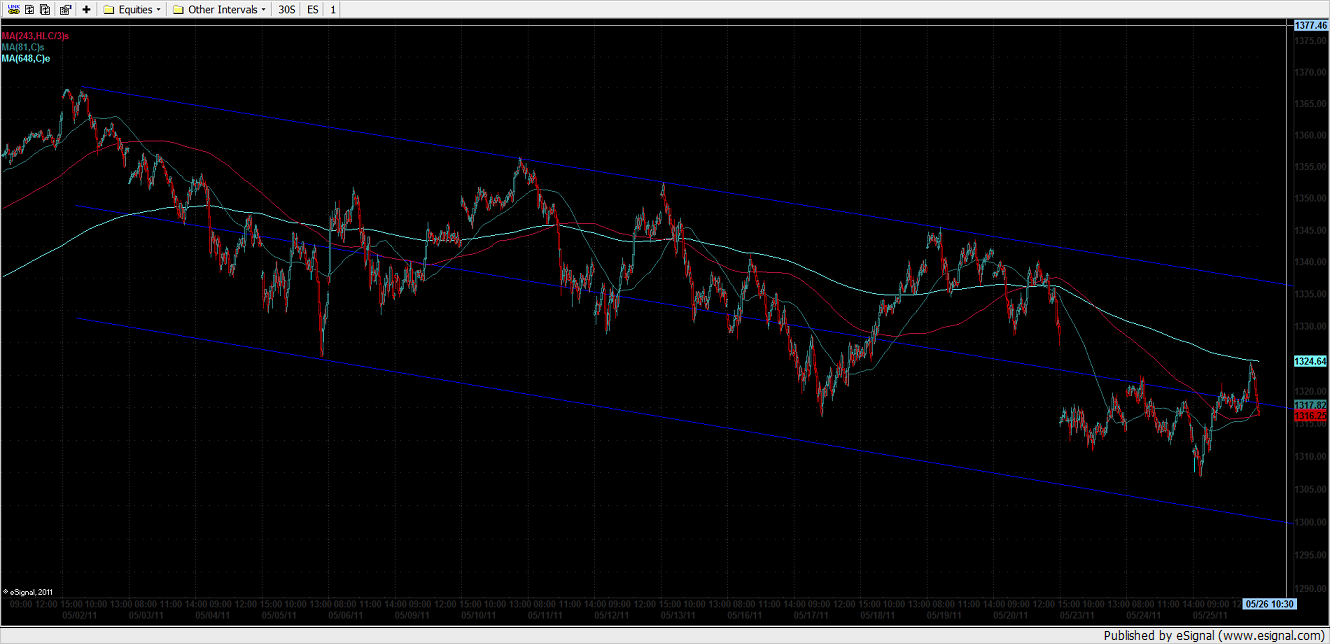
There's divergence in this market. This is a 5 min (daily numbers: 1 SMA, 3 typical SMA, & 8 EMA. The 8's leveling off and the 1 and 3 are trying to drive prices lower. Some heavy chop swings coming down the pike.
Chop I says. 12, 16, 21, 35, 43 I says.
Chop I says. 12, 16, 21, 35, 43 I says.
Click image for original size
Emini Day Trading /
Daily Notes /
Forecast /
Economic Events /
Search /
Terms and Conditions /
Disclaimer /
Books /
Online Books /
Site Map /
Contact /
Privacy Policy /
Links /
About /
Day Trading Forum /
Investment Calculators /
Pivot Point Calculator /
Market Profile Generator /
Fibonacci Calculator /
Mailing List /
Advertise Here /
Articles /
Financial Terms /
Brokers /
Software /
Holidays /
Stock Split Calendar /
Mortgage Calculator /
Donate
Copyright © 2004-2023, MyPivots. All rights reserved.
Copyright © 2004-2023, MyPivots. All rights reserved.