ES Day Trading 5-25-2011
Two vprofiles on this chart. Last weeks and the developing one for this week. Tight range so far this week and the bell curve shaped profile signaling a fight between bulls and bears. Interesting to note VPOC is below last weeks range.
Click image for original size
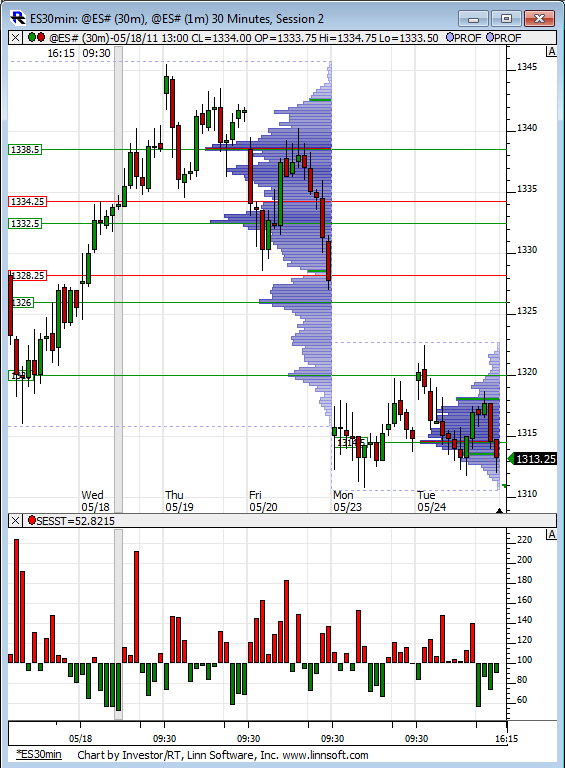
Having said that after making a few new low prints I think we'll work our way back up to the mid40's. They'll dump the high 20's again. For certain. Too much pressure. But the three week merged profile indicates 35 then 43. Low are touch and go for me. I measure it out as I go short. 80% of the time it won't reach 30% even then.
What do you think? Did they sell it into selling pressure to make it look horrible and bought it at the close?
Closed above 16 at decent support.
Tough call.
Closed above 16 at decent support.
Tough call.
Originally posted by neoikon
78.6% of PP to R2 is 1324.50... which is also 52.8% extension of Monday's RTH upwards. If we get there, I'd expect some resistance.
Would like to see ~17 now, though.
Wow! How about a hand for technical analysis. That's crazy.
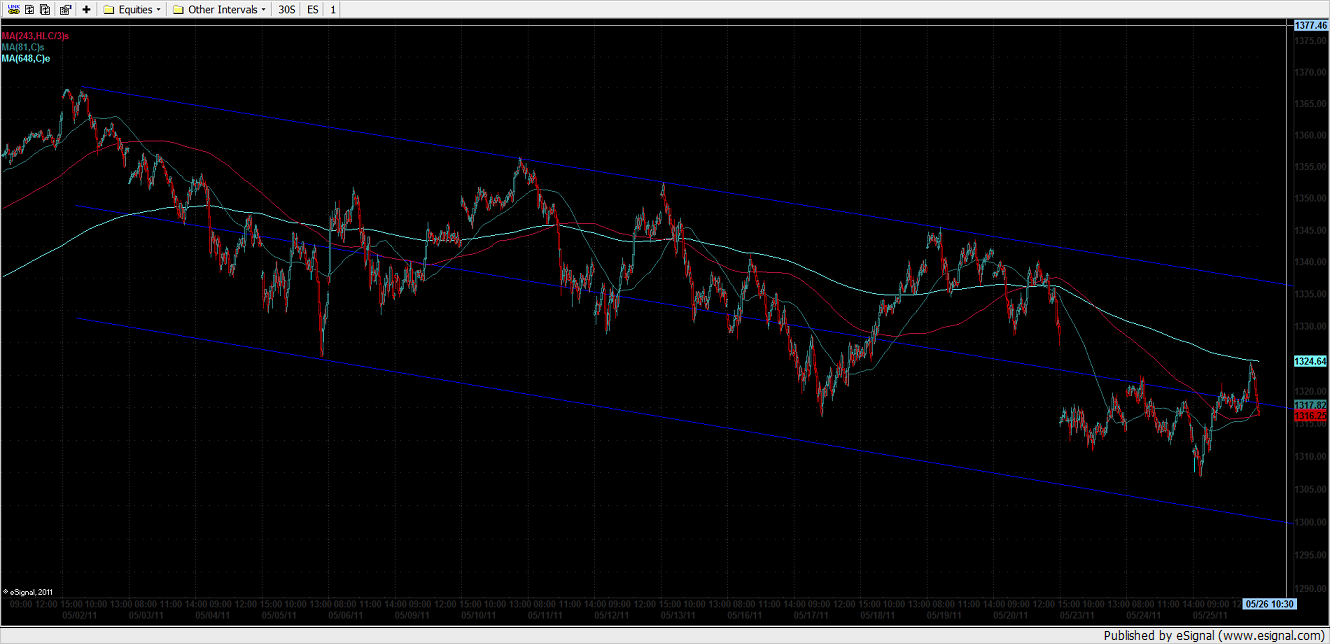
There's divergence in this market. This is a 5 min (daily numbers: 1 SMA, 3 typical SMA, & 8 EMA. The 8's leveling off and the 1 and 3 are trying to drive prices lower. Some heavy chop swings coming down the pike.
Chop I says. 12, 16, 21, 35, 43 I says.
Chop I says. 12, 16, 21, 35, 43 I says.
Click image for original size
Emini Day Trading /
Daily Notes /
Forecast /
Economic Events /
Search /
Terms and Conditions /
Disclaimer /
Books /
Online Books /
Site Map /
Contact /
Privacy Policy /
Links /
About /
Day Trading Forum /
Investment Calculators /
Pivot Point Calculator /
Market Profile Generator /
Fibonacci Calculator /
Mailing List /
Advertise Here /
Articles /
Financial Terms /
Brokers /
Software /
Holidays /
Stock Split Calendar /
Mortgage Calculator /
Donate
Copyright © 2004-2023, MyPivots. All rights reserved.
Copyright © 2004-2023, MyPivots. All rights reserved.