ES Wed 7-27-11
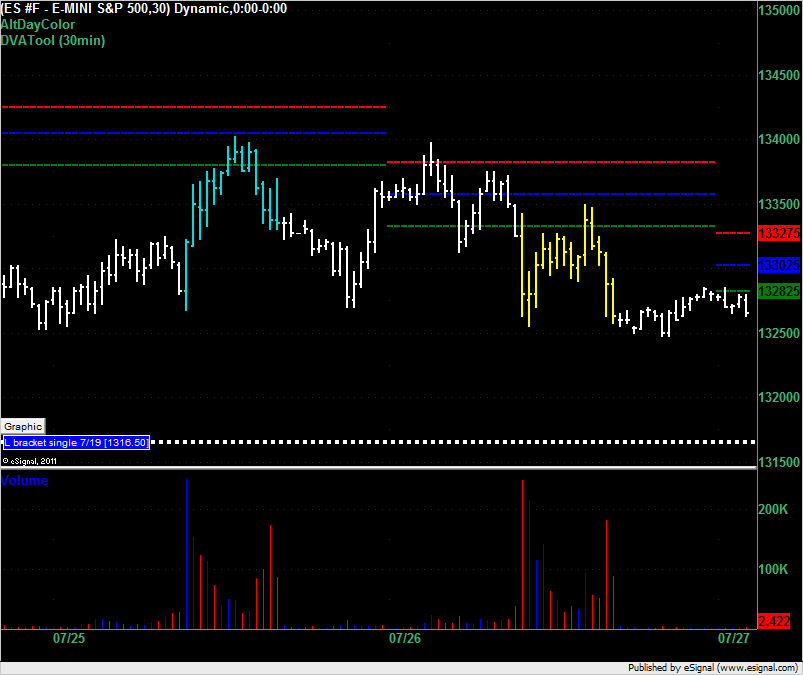
The VAL for the ES for trading on 27-July-2011 is at 1328.25. The overnight price has been hovering around here since this session started (white bars on right). Below us is the single print at 1316.50 from 7/19. Market Profile traders will be looking for longs at 1316.50 if we drop down there and if we open below the VAL will be looking to get short at 1328.25. If we open inside the value area we'll be looking for sideways trading but we have a very tight range of 4.5 points in the VA so we'd expect a breakout of that.
The Daily Notes page:
http://www.mypivots.com/dailynotes/symbol/445/-1/e-mini-sp500-september-2011
shows the average daily range to be between 17.00 and 19.50 points over the last 5 to 120 days so don't expect the price to stay inside the 4.5 point VA if it starts out in there.
The Daily Notes page:
http://www.mypivots.com/dailynotes/symbol/445/-1/e-mini-sp500-september-2011
shows the average daily range to be between 17.00 and 19.50 points over the last 5 to 120 days so don't expect the price to stay inside the 4.5 point VA if it starts out in there.
Click image for original size
DT,
thanks again for your MP anaysis. Simple and straight to the point. really well done and a great help for me.
here are some things I'm watching and wondering about...
In the Sunday into Monday overnight session, the L of the overnight was a spike down to print 1322.00 (just after the open on Sunday evening).
These seemingly errant spikes have a tendency to be revisited. (will the 1322.00 be re-visited? I don't know, but if it is and price manages to bounce instead of drop like a rock, it is going to catch "debt ceiling" headline bears by the family jewels).
Thursday's Gap higher at the open remains unfilled.
Wednesday (7-20-11 4:00pm and 4:15pm closes were the same, 1321.50)
If there is a drop to the 1322-1320 area, (I can't assume that there will be a rush to the buy side), but at those levels, PA becomes very important. I will be watching for 1-2-3 buy (5 minute bar) and possible intraday short-term squeeze. of 8 to 10 points from the low print.
I would become more concerned about additional downside if the .618 extension down of Monday's range were to print (1318.50) but I also know that the first print at that area often draws buyers for a scalp bounce.
if ES prints 1318.50, odds are high (about 8 in 10) that a full extension down of Monday's RTH range will unfold. Monday's RTH range subtracted from Monday's RTH L = 1313.25.
There is a second unfilled gap even lower, 1308.25 down to 1300.25(4:15C) and 1301.00 (4:00C).
the key breakdown point I'm watching is 23.75 - 24.50...I'm expecting a retest back up into that area and soon....from there we need to see if the sellers come back in . This is the current low volume area created in the overnight trade.
a simple filter to signal further longs will be a close above the weekly open on the 30 minute time frame at 27.75
hunting for longs under 18>75...the O/N low.....
starting long at 16.50 print....DT gave the reason above...air is above
need this to get and stay above the low volume of 1317.75 - 1318.75 to really have a good fade but will take something off there
the next best fade will come from running below the single prints of 1316 and getting down towards 1314....then look for the retest back up into 1316....watch them blow the stops on the singles traders first ...then get long !!
1314 is a vpoc from 7/19 (same day those single prints at 16.5 formed) and below you have paul's full extension of monday's rth range at 13.25 or so
Originally posted by BruceM
starting long at 16.50 print....DT gave the reason above...air is above
Hi Bruce, did you see any Market Delta corroboration for 16.50 long or is it strictly a MP single print trade?
trend day so far 1311.50 and 1303 all I see for turn points
weakness abounds in internals
lost 1315
weakness abounds in internals
lost 1315
"what do others think of that idea?"
sounds fine to me,
in my "old school" view of the markets, right now, markets are weak due to uncertainty about the debt ceiling.
If a headline of resolution comes in, I would disregard taking shorts at 06 or 07 and expect a "buy the news" event. As shorts cover, squeezing other shorts who are slow on the trigger finger.
I would expect a minimum of a 16 print (because last week's RTH only 50% of the weekly range was 1317.25)
Headline of resolution can easily vault prices all the way to Bruce's 23-25.
1325 is weekly pivot point (based on last week's RTH PA)
but this kind of volatile PA can easily create spikes and reversals
Emini Day Trading /
Daily Notes /
Forecast /
Economic Events /
Search /
Terms and Conditions /
Disclaimer /
Books /
Online Books /
Site Map /
Contact /
Privacy Policy /
Links /
About /
Day Trading Forum /
Investment Calculators /
Pivot Point Calculator /
Market Profile Generator /
Fibonacci Calculator /
Mailing List /
Advertise Here /
Articles /
Financial Terms /
Brokers /
Software /
Holidays /
Stock Split Calendar /
Mortgage Calculator /
Donate
Copyright © 2004-2023, MyPivots. All rights reserved.
Copyright © 2004-2023, MyPivots. All rights reserved.