ES Wed 7-27-11
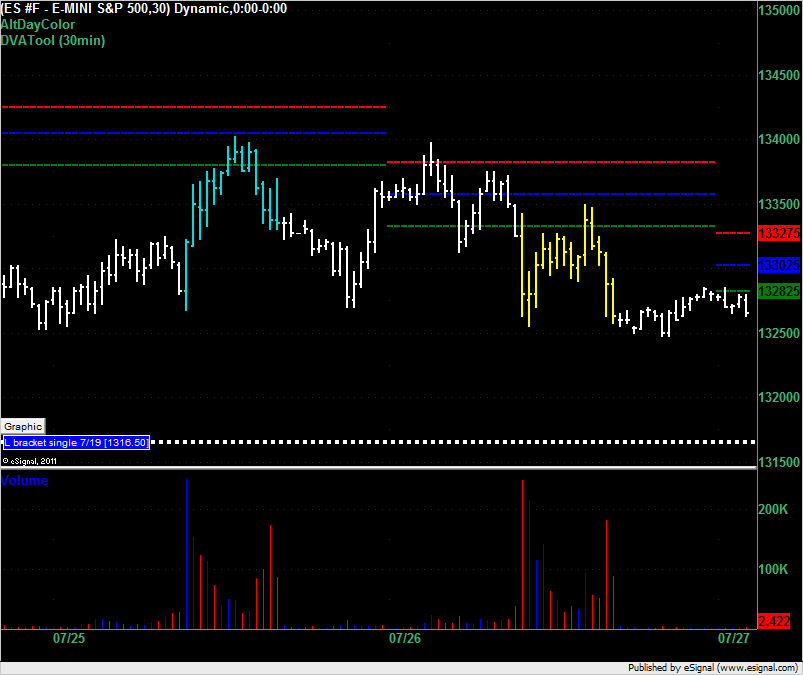
The VAL for the ES for trading on 27-July-2011 is at 1328.25. The overnight price has been hovering around here since this session started (white bars on right). Below us is the single print at 1316.50 from 7/19. Market Profile traders will be looking for longs at 1316.50 if we drop down there and if we open below the VAL will be looking to get short at 1328.25. If we open inside the value area we'll be looking for sideways trading but we have a very tight range of 4.5 points in the VA so we'd expect a breakout of that.
The Daily Notes page:
http://www.mypivots.com/dailynotes/symbol/445/-1/e-mini-sp500-september-2011
shows the average daily range to be between 17.00 and 19.50 points over the last 5 to 120 days so don't expect the price to stay inside the 4.5 point VA if it starts out in there.
The Daily Notes page:
http://www.mypivots.com/dailynotes/symbol/445/-1/e-mini-sp500-september-2011
shows the average daily range to be between 17.00 and 19.50 points over the last 5 to 120 days so don't expect the price to stay inside the 4.5 point VA if it starts out in there.
Click image for original size
that was brutal...
flat now though, and happy ! started my longs at 11.5 (was looking for sthg in the 13.5 area at first as mentioned earlier but the rapid decline down to 12 or gave me a better entry; entered once that big 1m vol bar was tested and vol dvg formed); added 9.5 and at 8, this last number very important to me as it was in the area of the 2.618 fib extension of the hourly chart (move from 47.75 down to 32.75), confirmed by a secondary projection on the same chart (35-24.75 move). I doubled my existing position at that point on the 308 area. So my avg entry price was abt 309.
Took some off when the first air was filled on the 5m chart at 10.5 and the bulk at 12.5, just in front of that low volume area bruce mentioned.
Single prints formed on this move down back up at 15.25
i guess i should have mentioned the 308 area in advance (as most times i do with important areas i see) but was not considering it at all when i first posted.
my apologies abt that and i hope at least my thought process helps someone
my apologies abt that and i hope at least my thought process helps someone
You don't owe us any apologees...hopefully most have their own numbers and can also appreciate any comments made here even if they come later.
On that note I want to point out a few things that may or may not be useful from todays trade.
1) The failure of the hour breakdown on a gap lower open to go fill in the air pockets above...there were 3 sets as per 5 minute data...all filled in.
2) The markets ability to retest previous areas of interest. Dt mentioned his single prints and there was mention of a VPOC. They love to blow out stops and then come back to see if an area is really valid......so lots of folks are now watching the old singles area at 1316.50 and the old vpoc at 1314.50...both areas got retested once they were blown through.
3) The one I have my eyes on is that failure of the 1323 - 25 zone as that is not only a low volume area from the O/N session but an old POC that has not been traded back to in the day session. So that has surprised me so far . we know enough to wait for a good signal to get long. Trading and initiating INSIDE the hour range is difficult.
all we have now is a new bell curve. if you look at volume with the center being 1312 and the upper end being 1315 and the lower end being down near those 07 - 08 lows...hard to initiate trade right in the middle of the bell curve...safer to wait for a true breakout / breakdown and hop on board.
here is how the bell curve looks in my world...see volume histogram on the right...I like to make the lines fairly equal off the center and at least one low volume area....so I have the 1312 marked off ( high volume) and the 1315 low volume....then I brought the lower line down near the hour lows as that will be critical anyway
hope that make sense
Click image for original size
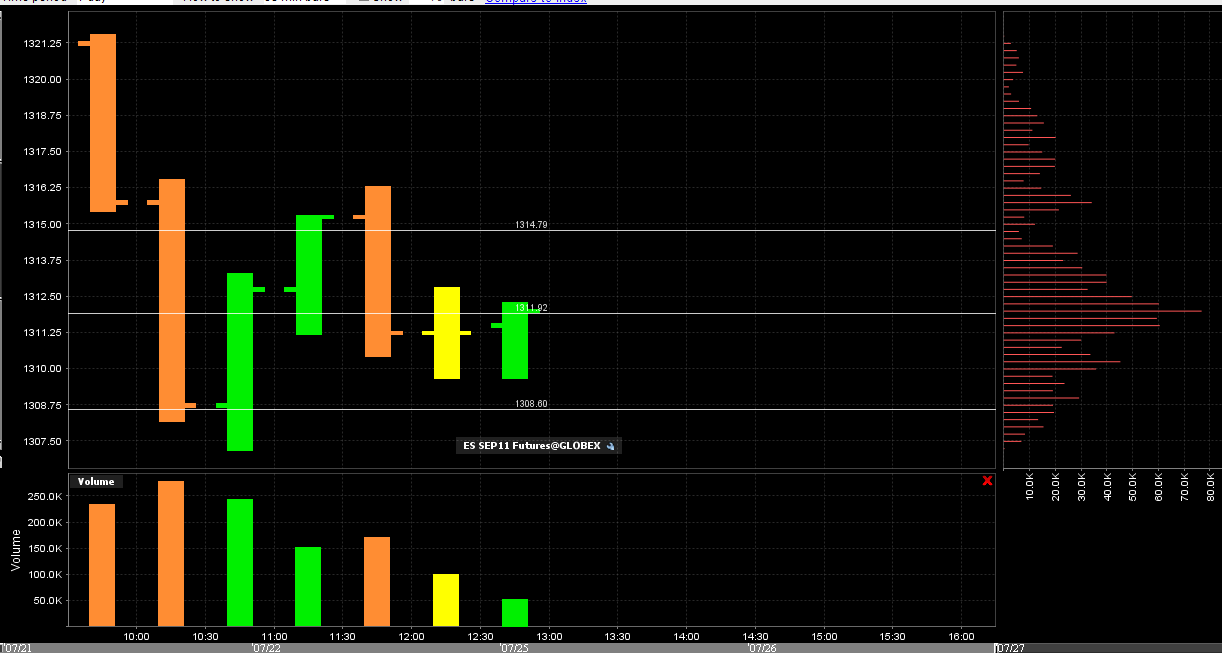
In Daltons world this would be the "b" profile shaping up as price is struggling to go lower. In my world I would be leaning more towards the short side as long as that low volume breakdown point holds....
That is telling us that the breakdown so far is valid...especially since the retest has held so far.....shorts don't want to see it back up there again before new lows.
No doubt some conflicting information on the charts!!
That is telling us that the breakdown so far is valid...especially since the retest has held so far.....shorts don't want to see it back up there again before new lows.
No doubt some conflicting information on the charts!!
1309 a level to watch if that 1307.25 holds, 1303 below
sub 1300 entirely possible with 1298 and 1291 area targets
can always correct back to that 1323 level later
sub 1291 as resistance and the run will continue
one green hour bar today, so far
sub 1300 entirely possible with 1298 and 1291 area targets
can always correct back to that 1323 level later
sub 1291 as resistance and the run will continue
one green hour bar today, so far
Click image for original size
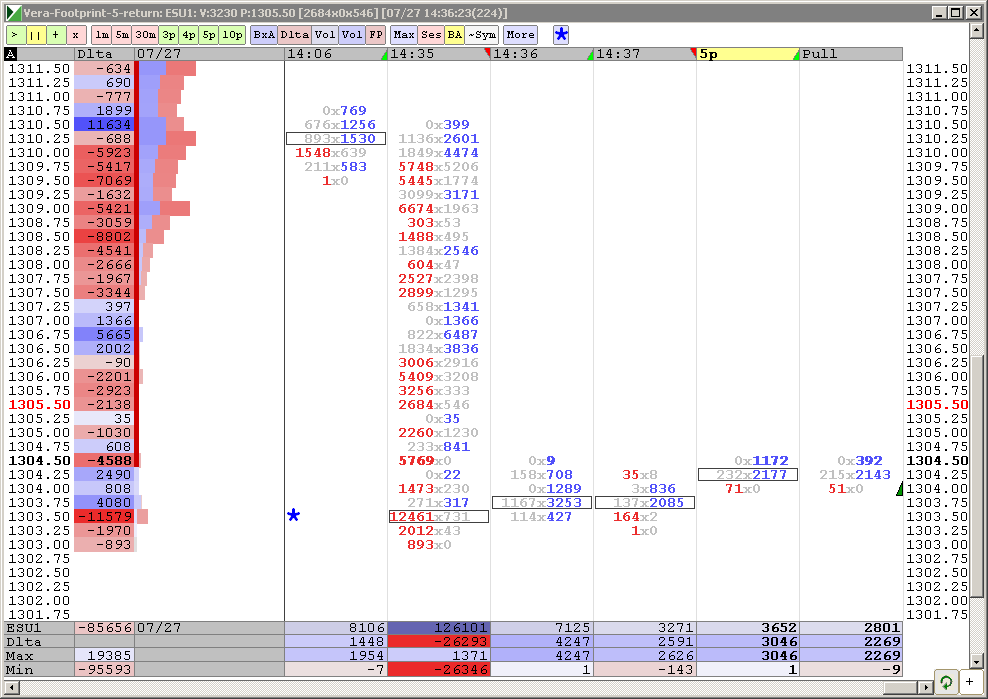
any reversal will need to recapture and hold 1307.25 just to begin
Remembering Kool Blue, the Globex high of 1328.5 move to the Globex low of 1318.75 gave a full projection of 1303.0.
FWIW, the move from 1316.25 to 1310.0 gives a full projection of 1300.25. The initial projection was 1303.00.
FWIW, the move from 1316.25 to 1310.0 gives a full projection of 1300.25. The initial projection was 1303.00.
"what do others think of that idea?"
sounds fine to me,
in my "old school" view of the markets, right now, markets are weak due to uncertainty about the debt ceiling.
If a headline of resolution comes in, I would disregard taking shorts at 06 or 07 and expect a "buy the news" event. As shorts cover, squeezing other shorts who are slow on the trigger finger.
I would expect a minimum of a 16 print (because last week's RTH only 50% of the weekly range was 1317.25)
Headline of resolution can easily vault prices all the way to Bruce's 23-25.
1325 is weekly pivot point (based on last week's RTH PA)
but this kind of volatile PA can easily create spikes and reversals
Emini Day Trading /
Daily Notes /
Forecast /
Economic Events /
Search /
Terms and Conditions /
Disclaimer /
Books /
Online Books /
Site Map /
Contact /
Privacy Policy /
Links /
About /
Day Trading Forum /
Investment Calculators /
Pivot Point Calculator /
Market Profile Generator /
Fibonacci Calculator /
Mailing List /
Advertise Here /
Articles /
Financial Terms /
Brokers /
Software /
Holidays /
Stock Split Calendar /
Mortgage Calculator /
Donate
Copyright © 2004-2023, MyPivots. All rights reserved.
Copyright © 2004-2023, MyPivots. All rights reserved.