ES Thu 7-28-11
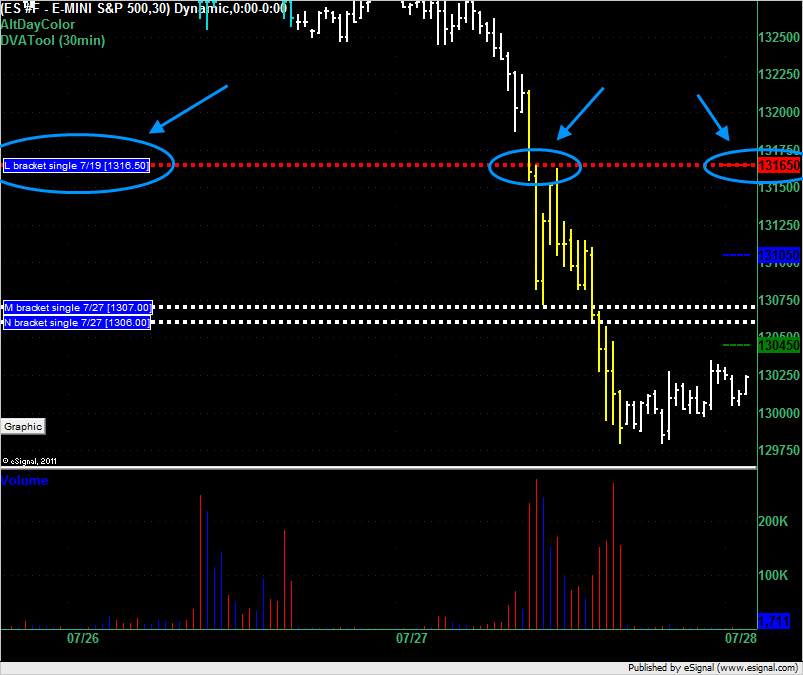
Interesting how yesterdays failed support at 1316.50 became resistance and tomorrow will be the VAH. This number keeps popping up. It's 1:46am as I type this and the market looks like it might open below the Value Area tomorrow. Good luck everyone.
Click image for original size
Numbers for today :
1304 - 1307 Va -low volume/single prints
1310 - 1312 Vwap/POC and Volume POC
1314.75 - 1316.25 VA high, Low volume and high volume combo
1323 - 1325 LOw volume and high volume combo from Tuesdays Overnight
downside
1300- 1301 - key number and peak volume from O/N sessio
1294 - 97 is key sypport with overnight low, yesterdays low and old vpoc at 1294 from 7-19
1291 - swing low from 7-19
watch for consolidation type of trading in early trade...as Paul said in another post, we need to remember that news can really move this fast so be careful and good luck today
The main bell curve we need to watch is the one that spans the 1307 - 1316 with 1312 as the center...here is the chart from yesterday
Click image for original size
I agree with Paul's comment at the end of yesterday's topic about the uncertainty that's been created with the debt ceiling "crisis." Once an agreement is reached I think that the market will rally because the uncertainty has been removed - I don't believe that it matters what the resolution is just that it has been resolved.
I have been playing with Kool's Tools projections for more than a year now and they seem to be especially useful for getting a hint of what the market wants when one projects off price moves from major news. This is especially so when the crude and natural gas inventory reports come out. With regard to the ES, we had a nice impulse move when the jobless claims number came out. The ES moved from a 1297 low to a 1302.5 high before a retrace. This move projected an initial upside target of 1306.0 and a full move to 1311.5 which is valid until 1297 is touched again. Those numbers seem to fit pretty well with Bruce's volume levels too.
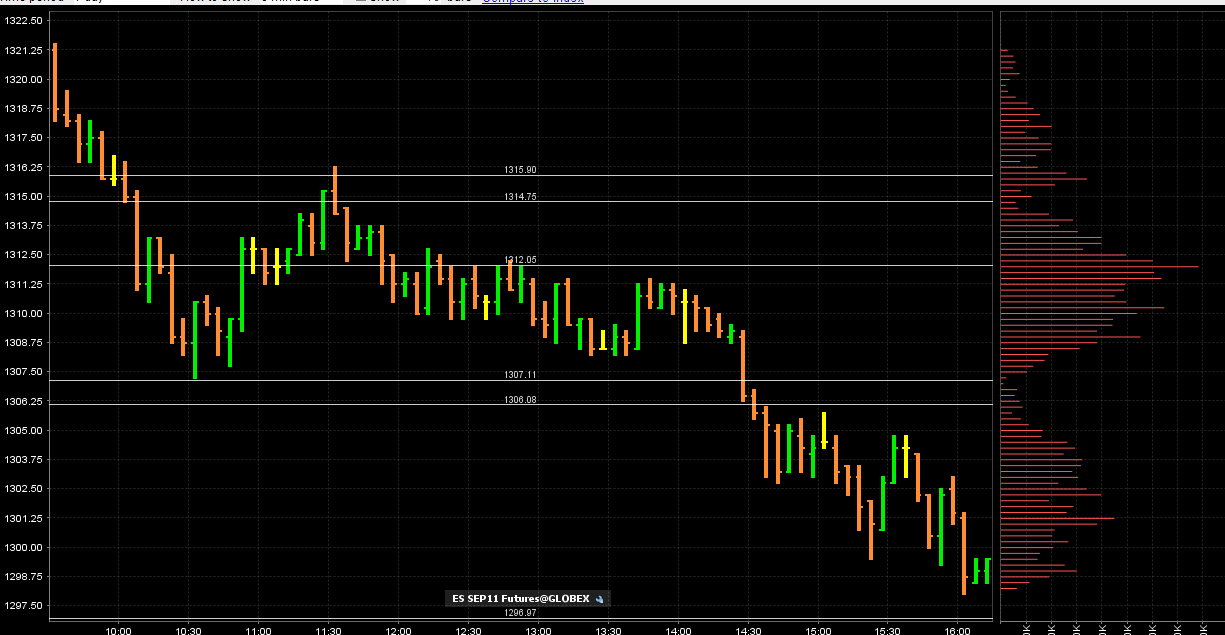
ES opens below the VA which means that 1304.50 is a shorting area but as I type this that would probably have failed as we're already up at 1307.50 which is where the 2 single prints are (1306 and 1307) which are also potential short areas.
Click image for original size

Regarding Kool's Tool price projections, another thing I have noticed is that they tend to be very helpful in assessing whether or not a trend is still in force. In an uptrend, retracements rarely fall much below the initial down projection. In a downtrend, retracements rarely rise much above initial up projections. When counter trend projections fail it usually confirms that the market still wants to continue moving in the direction of the trend. Likewise, when full counter trend projections are exceeded it usually means that the trend has stopped.
thanks for the explanation
do you have any preferences in terms of chart time frames ? or do you use the same kool used to look at ?
do you have any preferences in terms of chart time frames ? or do you use the same kool used to look at ?
Originally posted by prestwickdrive
Regarding Kool's Tool price projections, another thing I have noticed is that they tend to be very helpful in assessing whether or not a trend is still in force. In an uptrend, retracements rarely fall much below the initial down projection. In a downtrend, retracements rarely rise much above initial up projections. When counter trend projections fail it usually confirms that the market still wants to continue moving in the direction of the trend. Likewise, when full counter trend projections are exceeded it usually means that the trend has stopped.
where is Kool these days?
dt, i have 307 as val and i know it differs from yours but just wanted to point that out...
based on that, along with the single prints in the 306 and 307 levels, the initial projection of the move from o/n low to 302.5 (yielding 6.75), the 1.618 of the stretch and s1 at 308ish, i took the short at 307, looking to get down to the 304.5 area, 5min air fill (just filled)
as you can see lots of hurdles in that area for a rather choppy market to get through with no exogenous impulse
my next area up also matches bruce's 10.5-12, with the poc from yesterday and multiple projections taken from the recent 3 lows (95.75, 97, 99.5) also falling in that area
good luck
Originally posted by NickP
thanks for the explanation
do you have any preferences in terms of chart time frames ? or do you use the same kool used to look at ?
Originally posted by prestwickdrive
Regarding Kool's Tool price projections, another thing I have noticed is that they tend to be very helpful in assessing whether or not a trend is still in force. In an uptrend, retracements rarely fall much below the initial down projection. In a downtrend, retracements rarely rise much above initial up projections. When counter trend projections fail it usually confirms that the market still wants to continue moving in the direction of the trend. Likewise, when full counter trend projections are exceeded it usually means that the trend has stopped.
I use 1 and 3 minute charts.
I just watch for retracements to measure against. For example, last Thursday when the natural gas inventory report came out there was an immediate down move from 4.562 cents to 4.423 before an impulse up. This gave an initial down projection of 4.337 and a full projection of 4.198. The 4.337 almost got hit during that day's pit session (within .005) and it did get hit during that evening's Globex. Today's inventory report just came out and we just dropped from 4.327 to 4.200. I guess the round number support prevented a further move of .002 (to the 4.198 projected a week ago) but the session is not over yet.
Now we have to watch for lower NG prices from the move from 4.327-4.200. Maybe the tropical storm brewing in the Gulf will help negate the down projections from that move.
Interesting day for Market Profile single prints.
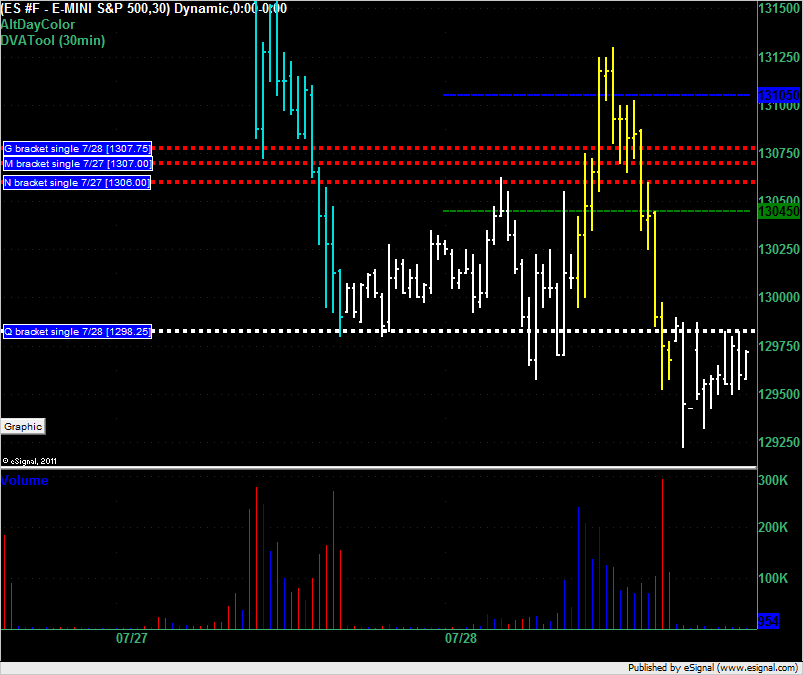
We started the day with the market rising and the single prints at 1306 and 1307 holding the market in check for a short while. The breakout to the upside then left a single print at 1307.75 which held the market with a worst case draw down of 1.25 points for 3 brackets (1.5 hours) before the market collapsed below it.
Right at the end of the day the market created a single print at 1298.25 and is now trading just under that.
Click image for original size
Emini Day Trading /
Daily Notes /
Forecast /
Economic Events /
Search /
Terms and Conditions /
Disclaimer /
Books /
Online Books /
Site Map /
Contact /
Privacy Policy /
Links /
About /
Day Trading Forum /
Investment Calculators /
Pivot Point Calculator /
Market Profile Generator /
Fibonacci Calculator /
Mailing List /
Advertise Here /
Articles /
Financial Terms /
Brokers /
Software /
Holidays /
Stock Split Calendar /
Mortgage Calculator /
Donate
Copyright © 2004-2023, MyPivots. All rights reserved.
Copyright © 2004-2023, MyPivots. All rights reserved.