ES Wed 8-3-11
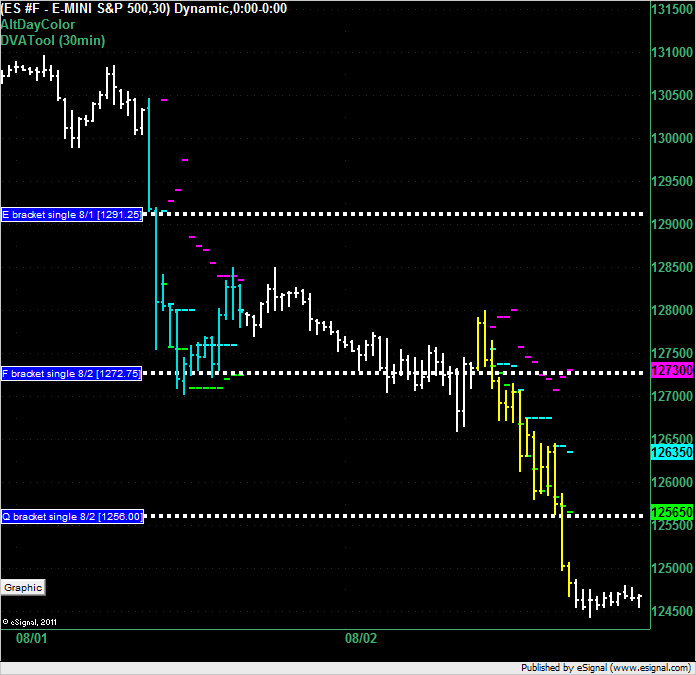
The ES left 2 single prints above the market on Tuesday at 1272.75 and 1256 even. There's also a single print at 1291.25 from Monday. VAL for today (Wednesday) is 1256.50 which is 2 ticks above the second single print and obviously a place to watch depending on overnight action.
Click image for original size
I wanted to post a forest and trees chart.
Intraday trading demands measurement of minutia, tiny ticks and small price moves...
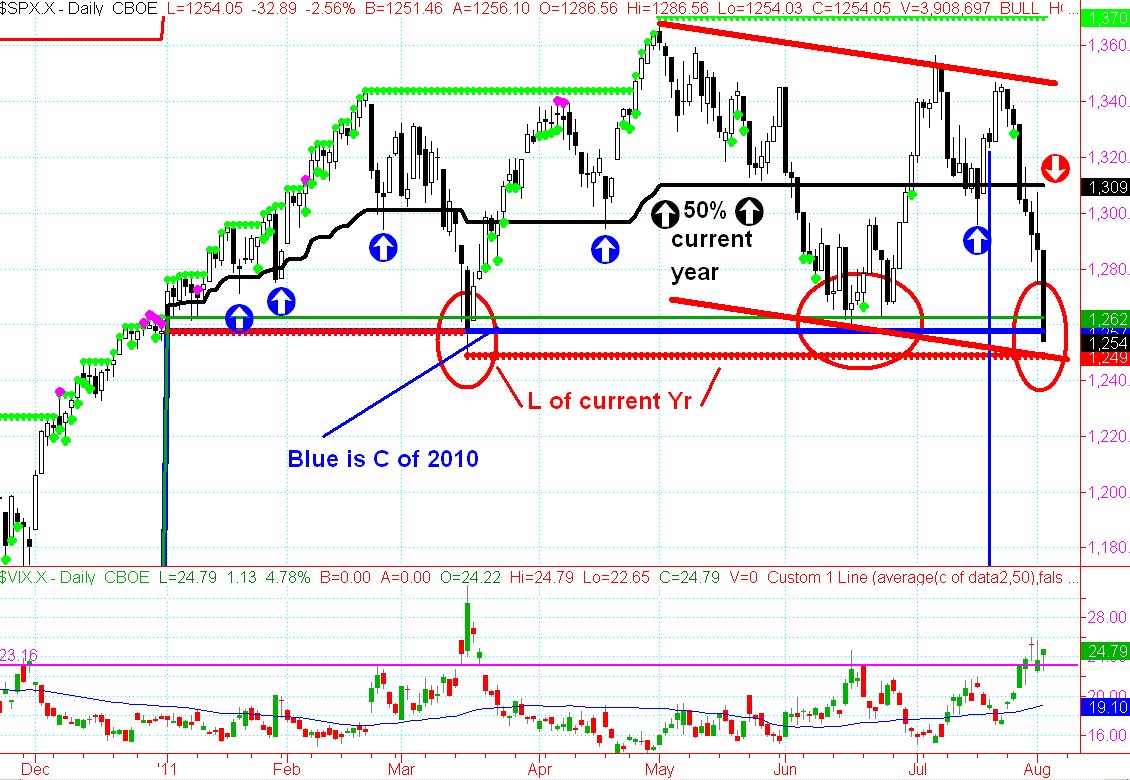
here's a chart that is looking at the CASH S&P 500 daily bars
currently at a level that represents a test of the close of 2010.
- red circles show current and prior tests.
Are you a believer in triple bottoms? I've heard some say they never work.
Current market is so oversold, some sort of a bounce seems likely for today.
black line is 50% of the current year's range.
blue arrows (pointing up) are tests of 50% of the current year's range.
way out in time:
Red arrow at right is at the 50% of the year, too. but if price moves to new L for the current year, that 50% of current year will move lower. If price breaks lower (intermediate term, meaning weeks, not hours or days) then a rebound that cannot get above whatever 50% of the year is is an invitation for a retest of the low of the year (intermdiate term).
subplot is VIX, currently at levels that have recently meant slowing or reversal of downtrend.
Intraday trading demands measurement of minutia, tiny ticks and small price moves...
here's a chart that is looking at the CASH S&P 500 daily bars
currently at a level that represents a test of the close of 2010.
- red circles show current and prior tests.
Are you a believer in triple bottoms? I've heard some say they never work.
Current market is so oversold, some sort of a bounce seems likely for today.
black line is 50% of the current year's range.
blue arrows (pointing up) are tests of 50% of the current year's range.
way out in time:
Red arrow at right is at the 50% of the year, too. but if price moves to new L for the current year, that 50% of current year will move lower. If price breaks lower (intermediate term, meaning weeks, not hours or days) then a rebound that cannot get above whatever 50% of the year is is an invitation for a retest of the low of the year (intermdiate term).
subplot is VIX, currently at levels that have recently meant slowing or reversal of downtrend.
Click image for original size
hi paul,
can you remind me of something really quick? to see if we achieved the 61.8% and full extensions off monday's rth trading hour, do you consider the 15min after 4pm et?
monday's range (304.75-270.25) was 34.5 pts, so 61.8% of that range substracted from the low of monday yields 249 roughly. The 4pm low was 49.75 (so technically did not get to 61.8% per se) but between 4-4.15pm we got well below 49 (low through 4.15pm was 46.75).
Was wondering if you consider the 4-4.15pm touch of the 61.8% valid. If so, 236 (full extension of mondy's range) lies ahead?
thanks
apk,
when I reviewed those charts, they were 4:15 close (it was too complicated for me to write code so I physically eye-balled the charts.
so it was 4:15 closes. 8 in 1o odds before the next Monday's close that the full extension will print 1235.75.
right now, the market is so oversold that I expect a bounce today. as long as price does not exceed 50% of monday trade 1287.50, odds are still alive.
I have noticed that rebounds from the .618 extension are still valid for downside even if price gets to the Low of Monday (1270.25 was Monday's Low.
dt posted MP and stated that there was a single print near there at 1272 something. so could even go there and fail.
I can assure, I don't know what will happen. I have to watch the PA at price levels of confluence. I will point out (easier in an up market) that when thee is a bullish extension UP to the .618 extension, I view a retracement to the H of that Monday that finds support at/near the Monday High as bullish... so, the oposite would be for downside, rebound to the Low of the Monday if that is resistance, increases the chances for downside to tag full extension.
I dopn't consider the singal extinguished unless the market closes above the 50% of Monday which is 1287.50. obviously the spread between these numbers is larger than normal due to the PA this week.
appreciate the response paul
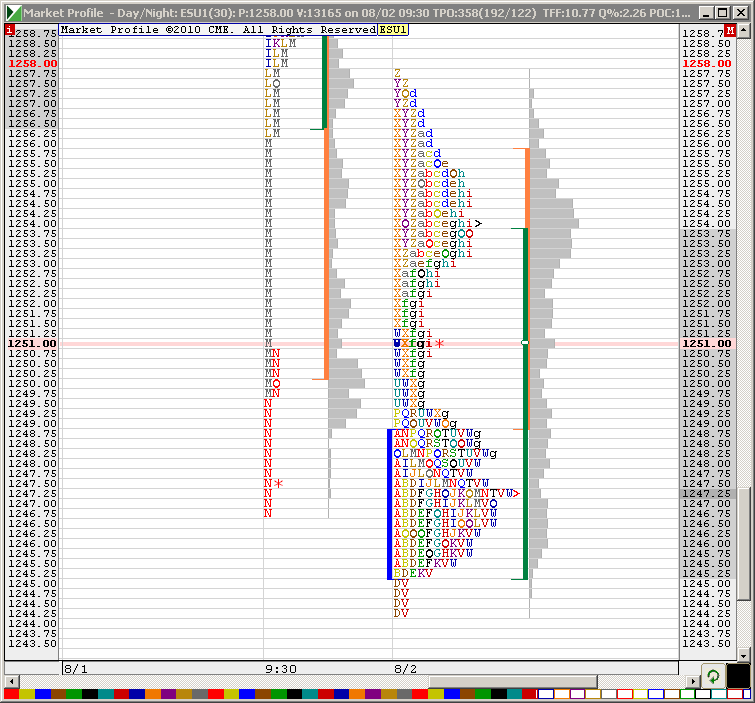
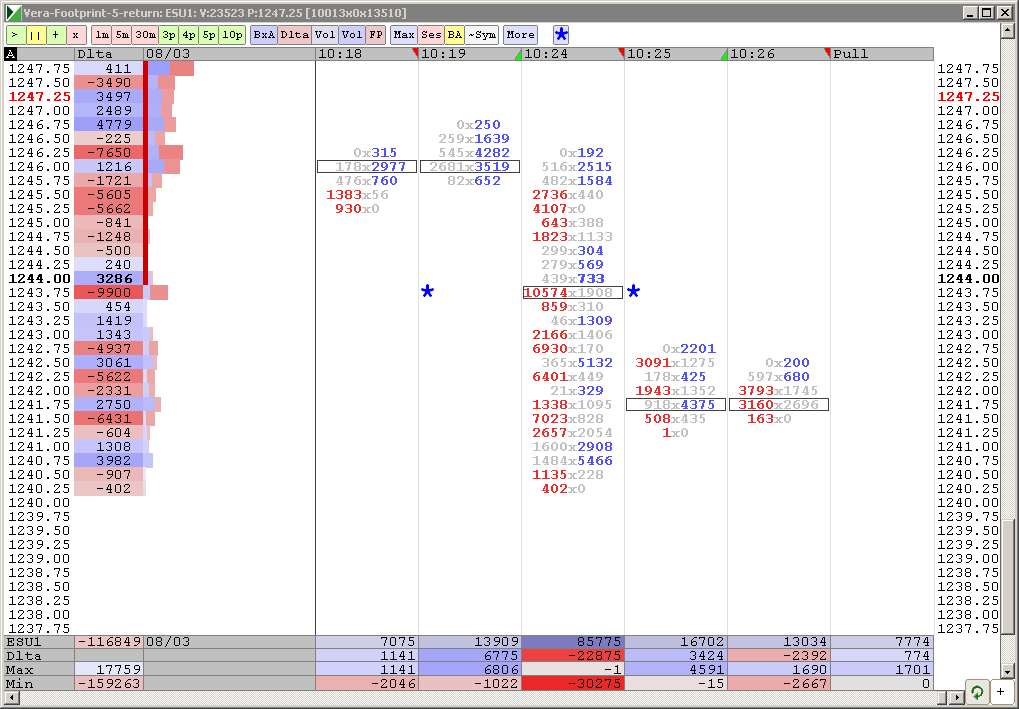
The following chart is the Market Profile for O/N action. Pink line and red asterrisk is where we are now. I like to use volume part (gray)
Click image for original size
Excellent post Paul! Ty!
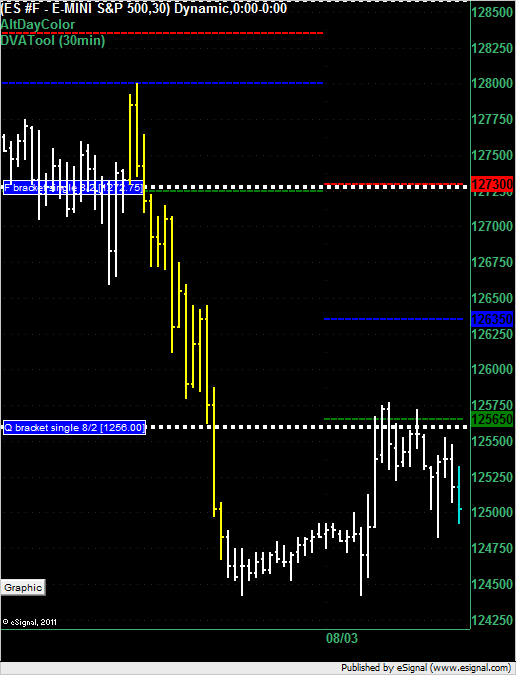
The open on 3 August 2011.
Overnight the market moved 1.75 points above the single print created in the Q bracket yesterday. This is not a technically valid Market Profile trade because it took place overnight but it does show resistance at the cluster of VAL and the single print which might be significant if the market moves back up there today.
Overnight the market moved 1.75 points above the single print created in the Q bracket yesterday. This is not a technically valid Market Profile trade because it took place overnight but it does show resistance at the cluster of VAL and the single print which might be significant if the market moves back up there today.
Click image for original size
I like triple bottoms. Also, note the low is approx the 50% level between the previous 2 lows(1236,1252).
On the way down. I marked a "significant level". Below - shorts, above longs
Click image for original size
wow,
Printed
full extension down (of Monday's range) was 1235.75,
unreal.
no, i didn't expect it today, I expected oversold rally, I actually lost 2 points trying to play for a rebound.
shame shame on me.
in the immortal words of Joe Ross:
"Trade what you see, not what you think."
unreal.
Printed
full extension down (of Monday's range) was 1235.75,
unreal.
no, i didn't expect it today, I expected oversold rally, I actually lost 2 points trying to play for a rebound.
shame shame on me.
in the immortal words of Joe Ross:
"Trade what you see, not what you think."
unreal.
58.50 was a single nack on the 3rd i am going to watch thhatfor tomorrow
Originally posted by Lisa P
single prints to 1256
Click image for original size

Emini Day Trading /
Daily Notes /
Forecast /
Economic Events /
Search /
Terms and Conditions /
Disclaimer /
Books /
Online Books /
Site Map /
Contact /
Privacy Policy /
Links /
About /
Day Trading Forum /
Investment Calculators /
Pivot Point Calculator /
Market Profile Generator /
Fibonacci Calculator /
Mailing List /
Advertise Here /
Articles /
Financial Terms /
Brokers /
Software /
Holidays /
Stock Split Calendar /
Mortgage Calculator /
Donate
Copyright © 2004-2023, MyPivots. All rights reserved.
Copyright © 2004-2023, MyPivots. All rights reserved.