ES Thu 8-11-11
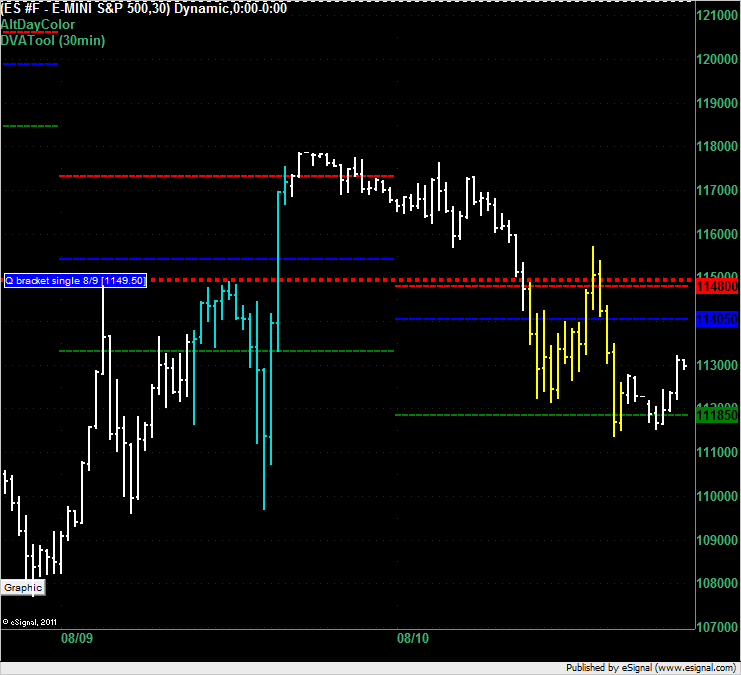
This is the ES at 8:30pm ET on Wednesday. On yesterday's ES topic I called a buy at 1148 or 1148.5 based on the single print and VAH but that call was nullified because we opened in the value area and the Initial Balance (IB) was formed inside the value area.
Market Profile theory looks for a day to be contained inside the value area when the IB is formed inside the value area. The market followed the theory and traded mostly inside in the value area and you will notice that the value area for today's trading is now, as a result, inside the previous day's value area.
Even though the market traded off the value areas it was, in my opinion, a truly scary market to trade off those lines with such fast markets and such a large range.
Have a look at the 5, 10, 20 and 40 day average ranges on this page:
http://www.mypivots.com/dailynotes/symbol/445/-1/e-mini-sp500-september-2011
We don't often see 70+ average ranges over 5 trading days.
Had you shorted the 1148 VAH on Wednesday you would have suffered through a 9 point draw down (or been stopped out) however the VAL target was only 1.5 points above the low of the day so you couldn't have wanted for a better target down there.
Click image for original size
INDU gap closed - carefull with longs
80 is my last key number.....too late for me though
Emini Day Trading /
Daily Notes /
Forecast /
Economic Events /
Search /
Terms and Conditions /
Disclaimer /
Books /
Online Books /
Site Map /
Contact /
Privacy Policy /
Links /
About /
Day Trading Forum /
Investment Calculators /
Pivot Point Calculator /
Market Profile Generator /
Fibonacci Calculator /
Mailing List /
Advertise Here /
Articles /
Financial Terms /
Brokers /
Software /
Holidays /
Stock Split Calendar /
Mortgage Calculator /
Donate
Copyright © 2004-2023, MyPivots. All rights reserved.
Copyright © 2004-2023, MyPivots. All rights reserved.