RA
rat89
Rep: 0
Posts: 7,015
I wish I could do this.....have crunching deadline to study for...grrr...traded today while doing reading with half a mind to each....I understand what you are saying though and it makes me very curious, so I will go back to this problem when I can...
TX
tx_ches
Rep: -10
Posts: 514
Roofer, yes your TWM chart looks very clean.
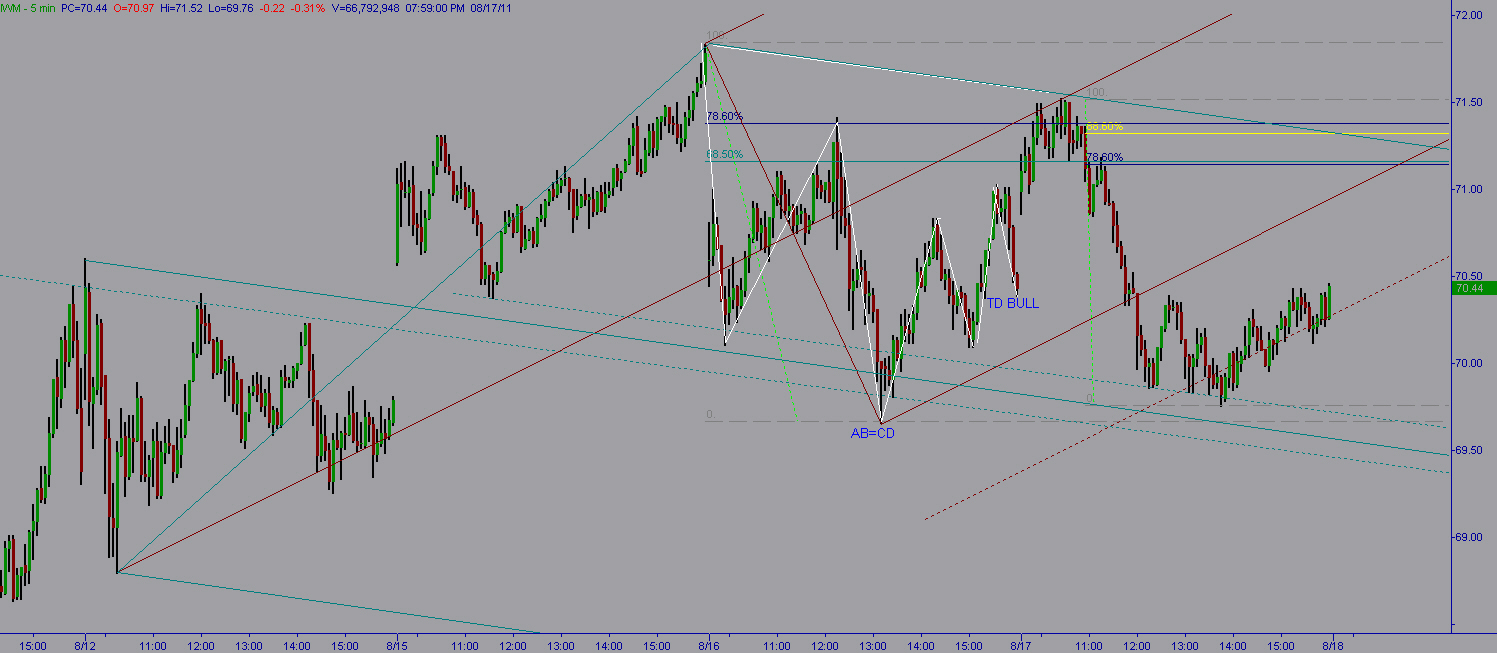
I went back to IWM and found 2 sets that crossed near the .886 point.
I also highlighted two abcds -- an ab=cd followed by a TD bull abcd.
The TD bull abcd hit the 190.2 mark at the high.
I'll be watching to see if price goes up to the cross of the two sets a second time -- that could set up a red line green set. It would be between the 78-88 of the last down swing which I marked on chart.
Click image for original size
TX
tx_ches
Rep: -10
Posts: 514
Good luck, rat, with your exam.
Originally posted by rat89
have crunching deadline to study for
TX
tx_ches
Rep: -10
Posts: 514
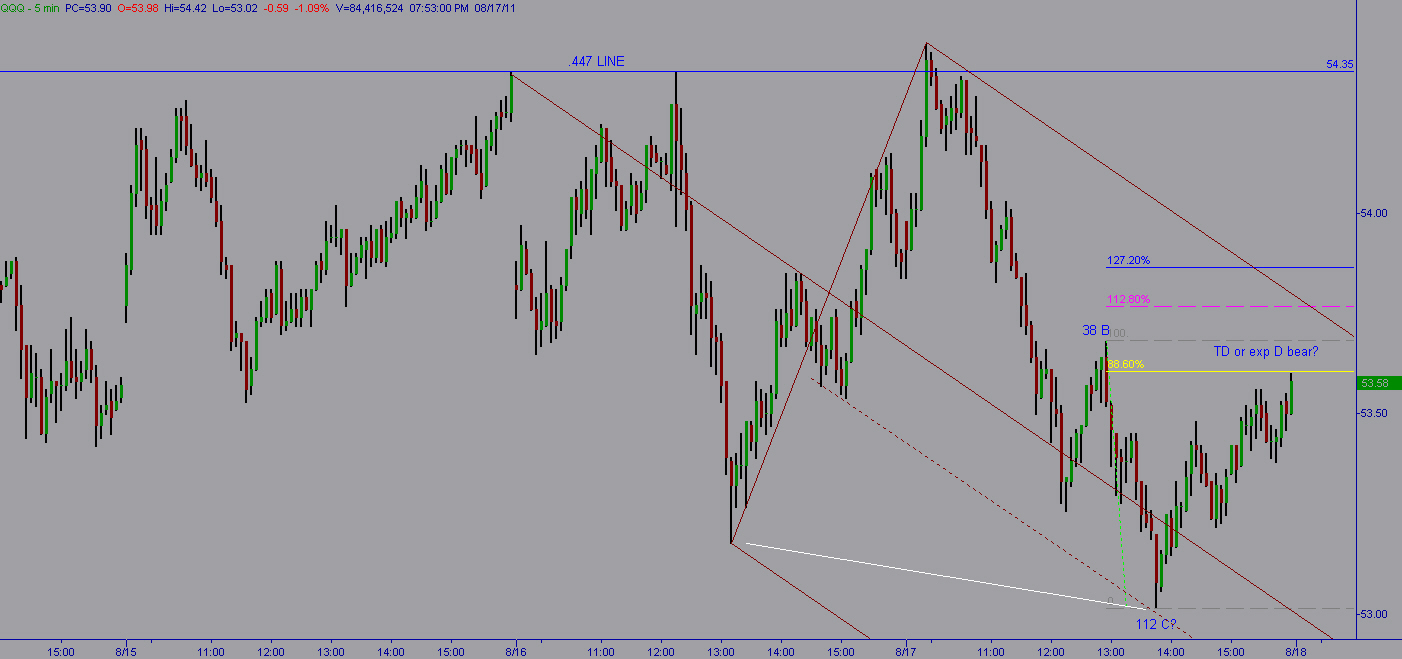
While looking at QQQ, here are some things I noticed.
The low was at 112 and at a sliding //.
It closed today at the .886 mark, possibly setting up a TD bear or it may continue on and make an exp bear - possibly into the uml.
The low was at 112 and at a sliding //.
It closed today at the .886 mark, possibly setting up a TD bear or it may continue on and make an exp bear - possibly into the uml.
Click image for original size
TX
tx_ches
Rep: -10
Posts: 514
I'm stumped on this one. My eyes are not seeing a red line green set at same time as the .447 was hit today - which I have as at 9:55.
I found some .886 yesterday at the right time - 12:15.
I checked dia, spy, upro, tna, iwm, twm, sso, sds, qqq, qid, qld, tbt, tlt, tza, mdy, fas, faz, rth, erx, ery. It was probably one of these and I just missed it. I only checked the 5 min chart.
I found some .886 yesterday at the right time - 12:15.
I checked dia, spy, upro, tna, iwm, twm, sso, sds, qqq, qid, qld, tbt, tlt, tza, mdy, fas, faz, rth, erx, ery. It was probably one of these and I just missed it. I only checked the 5 min chart.
Originally posted by roofer
the computers obviously know that the .447 is important in the QQQ. i invite traders to do this... show how at yesterdays touch, a specific index set up .886 on gap on 5 at Xmarks spot.... and how today, that VERY SAME INDEX set up the redline green set at a much different level on today's touch of .447 in QQQ
RO
roofer
Rep: 3,689
Posts: 3,574
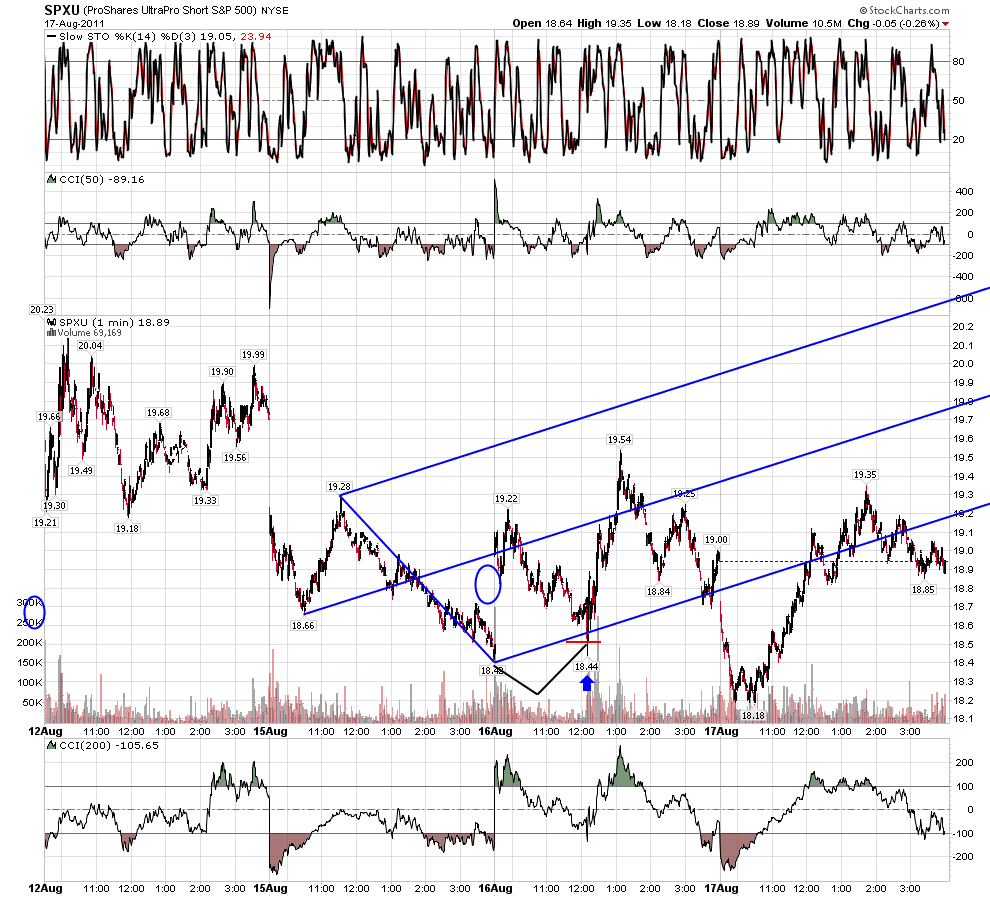
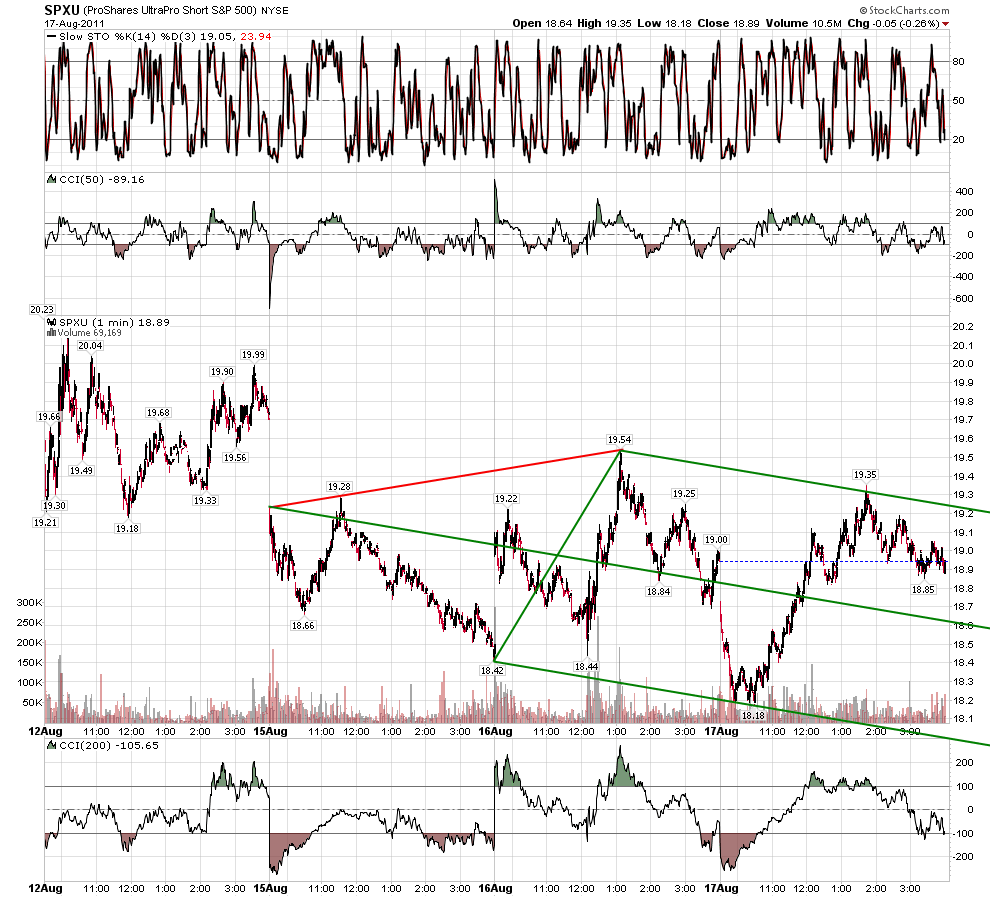
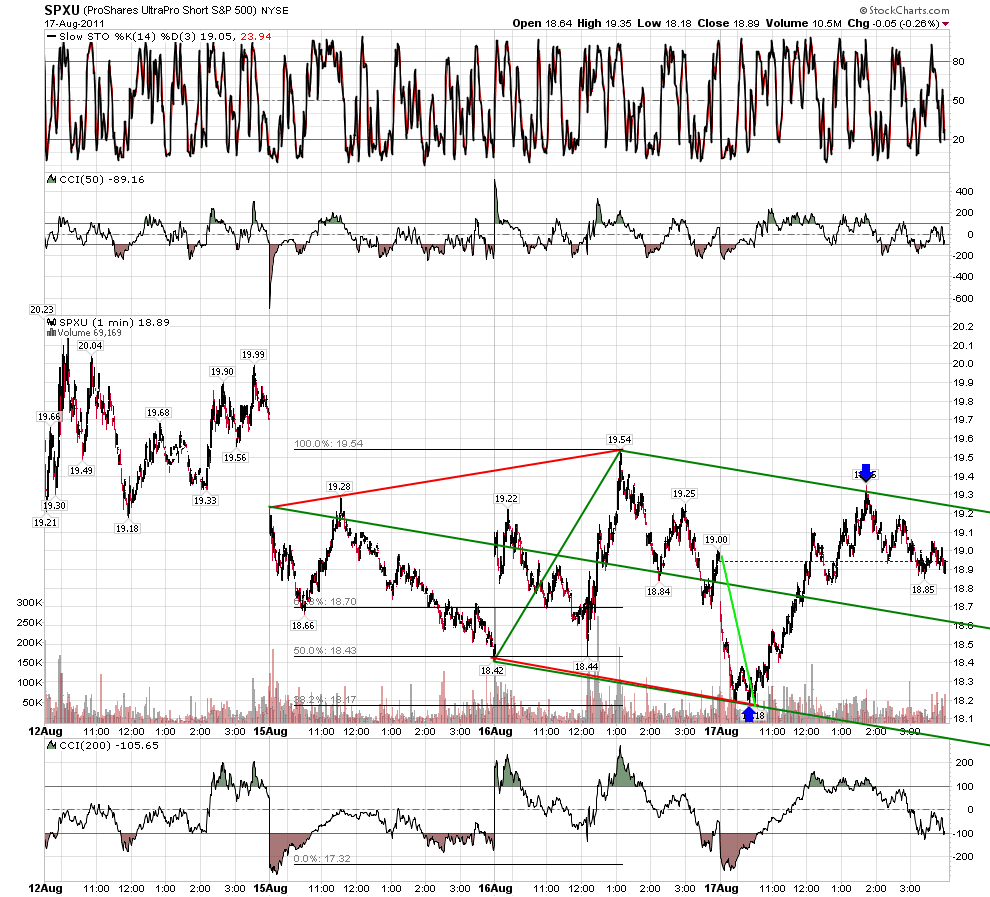
there is nothing new here.... you gotta admit the computers are freakin' good...
Click image for original size
Click image for original size
Click image for original size
JI
jimkane
Rep: 3,058
Posts: 33,089
ES really starting to sell. I'd be really shocked if that ABCD and area I mentioned did send this to new lows. It would imply serious intermediate-term weakness to me.
RO
roofer
Rep: 3,689
Posts: 3,574
never have i done so well trading the short term algo's as the last few days.... but for the nth time...'' as price approaches an important turn. the tools work better and better on the short term''