JI
jimkane
Rep: 3,058
Posts: 33,089
People have this in their notes, right? Everyone is watching this, right?
Posted-08/11/2011 : 16:57:22
Originally posted by jimkane
Okay, so let's say we get a monster rally now. I'm not saying it will happen, only that as a premise let's say it does. Where am I looking? Let me add these are rough areas now, and when I do more work tonight I will be able to refine them a bit, as well as if price moves up and gives me some additional swings to work with.
1201-06 (ABCD)
1267
1280 (this may be part of the previous area, as 13 points or more may not be that wide for what is at least a daily timeframe)
1330-1343
So, the first two are center of the areas, and as mentioned in the third one, I'm not sure yet if that is part of the second one, or not. The lines are surprisingly unclear with respect to the Fibs right now. Perhaps as I do more work later... The last level, that one covers essentially the entire range, not the center. The .886 comes in around 1323, so is that part of it, too? Hard to say right now.
I'd be pleased if this ran to the 1267 area (which, as I said, may range up to 1280), and formed the short of the century, amidst the almost unimaginable bullish talk we'd have by that time. We'll see. The way this thing swings, we may be at new lows tomorrow...
JI
jimkane
Rep: 3,058
Posts: 33,089
rat, which ABCD do you mean? The bearish ABCD I just mentioned is a 480-min pattern, off the 1077 low. You are talking about a 1-min ABCD? That wouldn't scare the bulls too much. Can you post a chart showing which ABCD you mean?
Originally posted by rat89
wow....abcd on the 1 minute chart to .618 and .382 of the whole move down....just when it feels so safe on the bull side...
TX
tx_ches
Rep: -10
Posts: 514
Originally posted by jimkane
Can you post a chart showing which ABCD you mean?
JI
jimkane
Rep: 3,058
Posts: 33,089
How about if I describe it, and you post it? It's a bearish ABCD, with the A point at the 1077 low on 8/9, the B point at 1178.75 on 8/9, the C point at 1103 on 8/11, and the D point somewhere in here right now. Look at say a 240-min all-sessions chart (the 'traded timeframe is the 480-min, but most platforms can't chart that). You can see the strong downtrend, and the ABCD, quite clearly on that timeframe.
Now, I don't think this is done going up in here, so I don't think this ABCD will produce new lows. I don't think it will do any more than a small checkback, and it may not even do that. But, it is worth watching, in case this is going to be 'the spot'. Until some bad news comes out, I see nothing but up.
Now, I don't think this is done going up in here, so I don't think this ABCD will produce new lows. I don't think it will do any more than a small checkback, and it may not even do that. But, it is worth watching, in case this is going to be 'the spot'. Until some bad news comes out, I see nothing but up.
JI
jimkane
Rep: 3,058
Posts: 33,089
Oops, I just read your post again, tx, and realized I misread it totally. I thought you were asking me to chart my ABCD. Anyway, for anyone wanting to see the ABCD I am looking at, there's a description. I just wanted to know if that was the one rat was looking at, or if he saw something else I didn't see.
RA
rat89
Rep: 0
Posts: 7,015
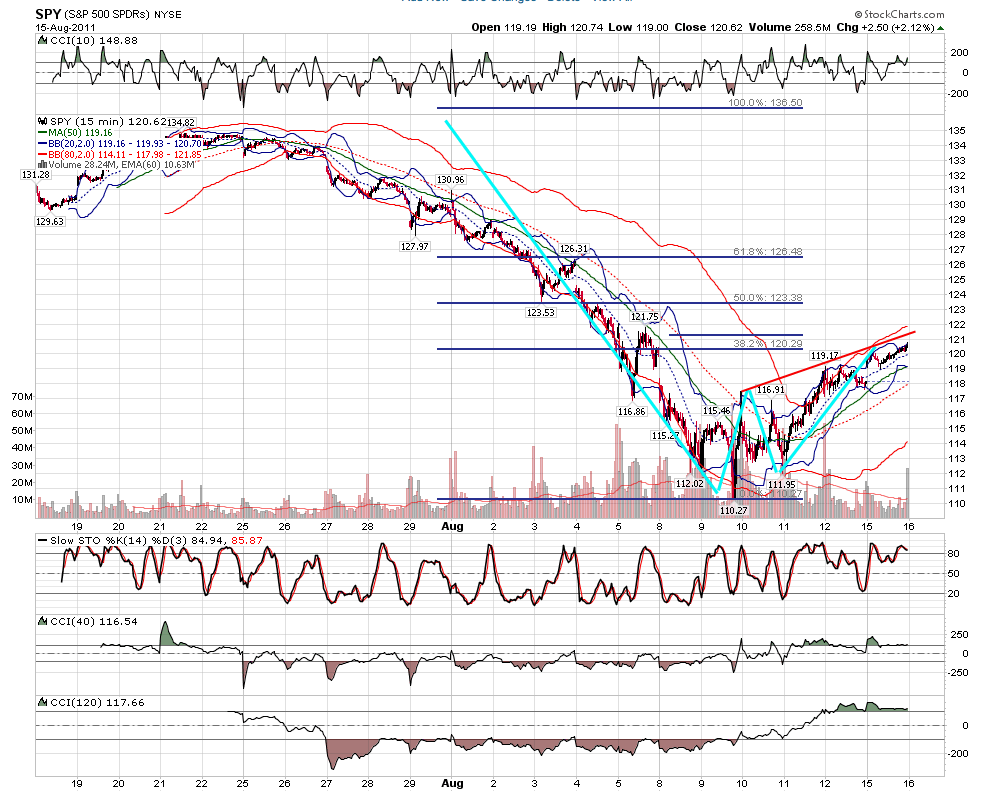
this one - it's a little odd due to the range last week:
Click image for original size
JI
jimkane
Rep: 3,058
Posts: 33,089
Yes, that's the same one I have. It looks a little less odd with all-sessions data, as a lot of movement happened in the overnight sessions. I was thrown by your mention of 1-min timeframe. You probably meant 15-min.
RA
rat89
Rep: 0
Posts: 7,015
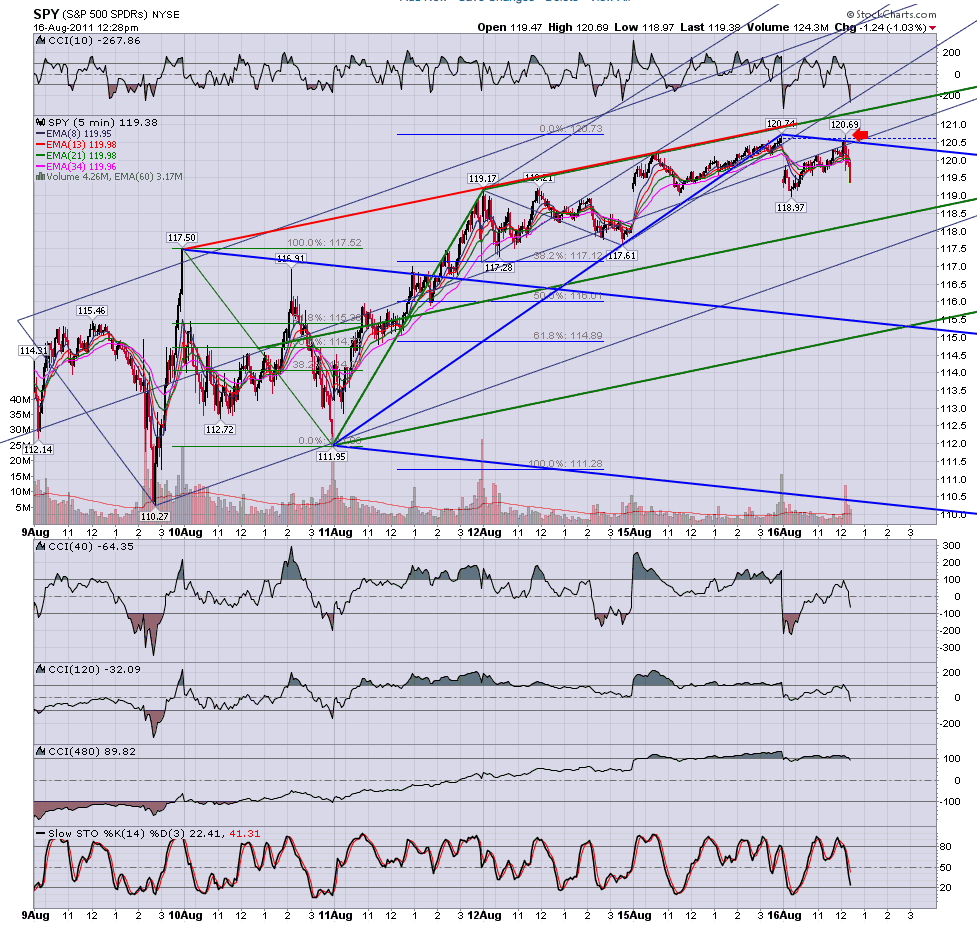
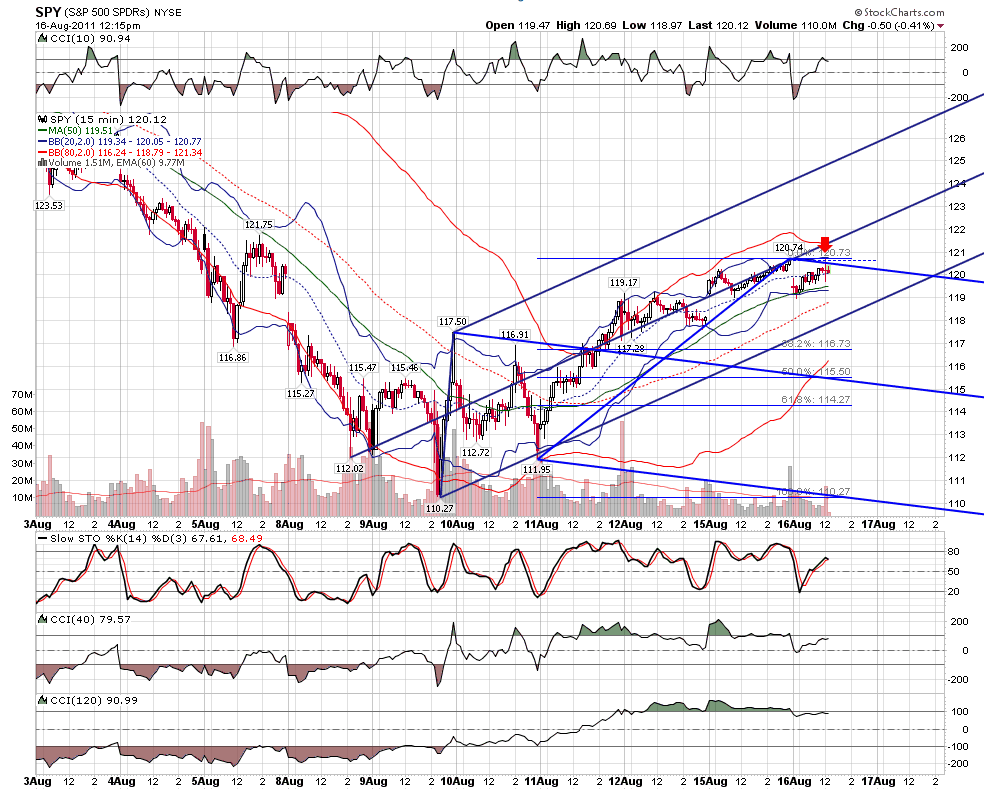
had one hour between meetings and just happened to be at an interesting time....
Click image for original size
Click image for original size
JI
jimkane
Rep: 3,058
Posts: 33,089
I think discussing follow up is important for these posts, especially if I get very little feedback and/or participation. So, I was expecting a checkback, albeit a small one. Only news would change that. It did start to roll off the area, and bang, German GDP comes out at 0.1%. Germany, the powerhouse of all of Europe. The ES continues down a full 22 points. It puts in a 3D right to a key .382, at 'lateral support'.
It then runs right back up after this small checkback (on the scale of the entire run up), and takes another shot at the same level, within a tick. Then more 'news' comes out about another emergency European meeting, and the selling starts again, this time 24 points, right to a flat ABCD area, where it reacts (it may not hold).
Point is, of all the places this could start struggling with, and doing over 20 point checkbacks from, it chose the area I posted four days in advance. Not only is that way cool, but it should be a great hint as to where you need to do some work. The point of this forum, for me, is to point this out, then have everyone do the work for it, and grasp the concepts. I focus everyone on where the work should be done, then everyone does the work.
I'm pointing out one of the biggest things there is, the key area to build work around. Work until you see why this area jumped right out at me. Are 22 and 24 point reactions enough for me to 'intraday swing trade' around? For me, I think they are. And for overnight setups, once positioned, one can consider a trading partner, or an automated trailing stop, amongst other possibilities.
Originally posted by jimkane
...Now, I don't think this is done going up in here, so I don't think this ABCD will produce new lows. I don't think it will do any more than a small checkback, and it may not even do that. But, it is worth watching, in case this is going to be 'the spot'. Until some bad news comes out, I see nothing but up.
Originally posted by jimkane
People have this in their notes, right? Everyone is watching this, right?
Posted-08/11/2011 : 16:57:22
Originally posted by jimkane
Okay, so let's say we get a monster rally now. I'm not saying it will happen, only that as a premise let's say it does. Where am I looking? Let me add these are rough areas now, and when I do more work tonight I will be able to refine them a bit, as well as if price moves up and gives me some additional swings to work with.
1201-06 (ABCD)
1267
1280 (this may be part of the previous area, as 13 points or more may not be that wide for what is at least a daily timeframe)
1330-1343
So, the first two are center of the areas, and as mentioned in the third one, I'm not sure yet if that is part of the second one, or not. The lines are surprisingly unclear with respect to the Fibs right now. Perhaps as I do more work later... The last level, that one covers essentially the entire range, not the center. The .886 comes in around 1323, so is that part of it, too? Hard to say right now.
I'd be pleased if this ran to the 1267 area (which, as I said, may range up to 1280), and formed the short of the century, amidst the almost unimaginable bullish talk we'd have by that time. We'll see. The way this thing swings, we may be at new lows tomorrow...
JI
jimkane
Rep: 3,058
Posts: 33,089
So, from what I gather, a European transaction tax is strongly back on the table. Anyone who thinks this isn't going to happen just has their head buried in the sand. This will be one of the final nails in the coffin to totally destroy the market. Once 'they' have it we'll soon have it, too. I can't wait to pay $800 tax per trade, win or lose. Sounds fun.
And all their calculations on the revenue this will generate are based on the assumption I'll keep trading, paying $800 tax win or lose per small stock trade, and that all the HFT traders, especially the big banks, will not only pay the tax, but will keep trading at the same rate. No thoughts on how they would stop all trading immediately, since their profit margin is way under the 1%-2% per trade, and not to mention they will give all the big players exemptions anyway... No end to the stupidity in wrecking this market...
And all their calculations on the revenue this will generate are based on the assumption I'll keep trading, paying $800 tax win or lose per small stock trade, and that all the HFT traders, especially the big banks, will not only pay the tax, but will keep trading at the same rate. No thoughts on how they would stop all trading immediately, since their profit margin is way under the 1%-2% per trade, and not to mention they will give all the big players exemptions anyway... No end to the stupidity in wrecking this market...