ES Fri 9-9-11
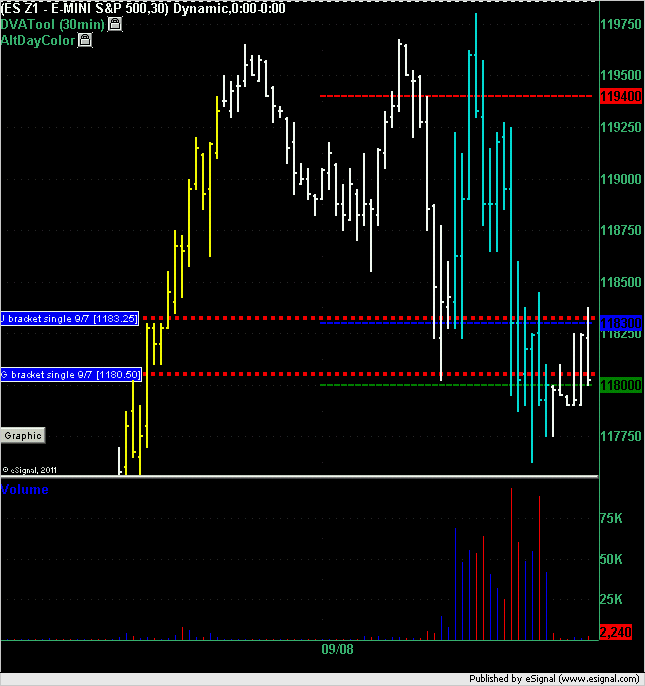
Market Profile summary from Thursday action. Note that you are looking at the December contract on this chart and not the September or continuous contract. i.e. the single prints you see on this chart that were generated on Wednesday you would not have seen on Wednesday because you would have been looking at the September contract.
The market opened above the Wednesday's J bracket and traded down to it triggering a long at 1183.25. Draw down on this trade was 1 point to 1182.25 in the following bracket which was then followed by a best run-up of 14.75 points to the high of day of 1198 even.
The market dropped through that single later on in the day and hit the second single which triggered a long at 1180.50 which had a draw down of 4.25 points to the low of the day of 1176.25 and a best run up of 5.5 points to 1186 even. Using a 4 point stop and a target greater than 5.25 points would have made that trade a loser. Note however that the run-up of 5.5 points happened before that 4.25 point draw down so most traders would have trailed a stop to breakeven by then.
Click image for original size
I have POTENTIAL support at 66.50 and 62.50 as per December contract...other areas on the upside are 71.50,77.50, 80.25 and 86.50...
hope all have a great day!!
hope all have a great day!!
prestwick thanks for your response yesterday
i have a question regarding your methodology; say you have a swing from a swing top or bottom and the full projection gets hit to the tick...now the market makes a decent retrace and then continues in the original direction and the original full projection that was hit is blown through
my question is, do you look for another projection off of the original swing top/bottom or do you move to the following swing top/bottom
let me know if the question is not clear enough
thanks
looking for longs below the 62.50 with 65 as first target if we can get the fill
in at 61.25.....if we fail then next long attempt will be from 57.50
gap in the data at 66.75...that is inside our key volume zone...ripe for a retest
lots of test of the 62.50 from below it...they need to resolve that to go for our 66.50 number
using 65 as bulk exit as that is low volume generated today...then hold for micro gap
Report in 7 minutes...
report in 5 minutes gotta trail up ..this is my second long....now from 59.50...first trade was a failure on new lows.....this second one targeted 62.50 to bring up stops...
went to market at 64.75...holding two through report
chris
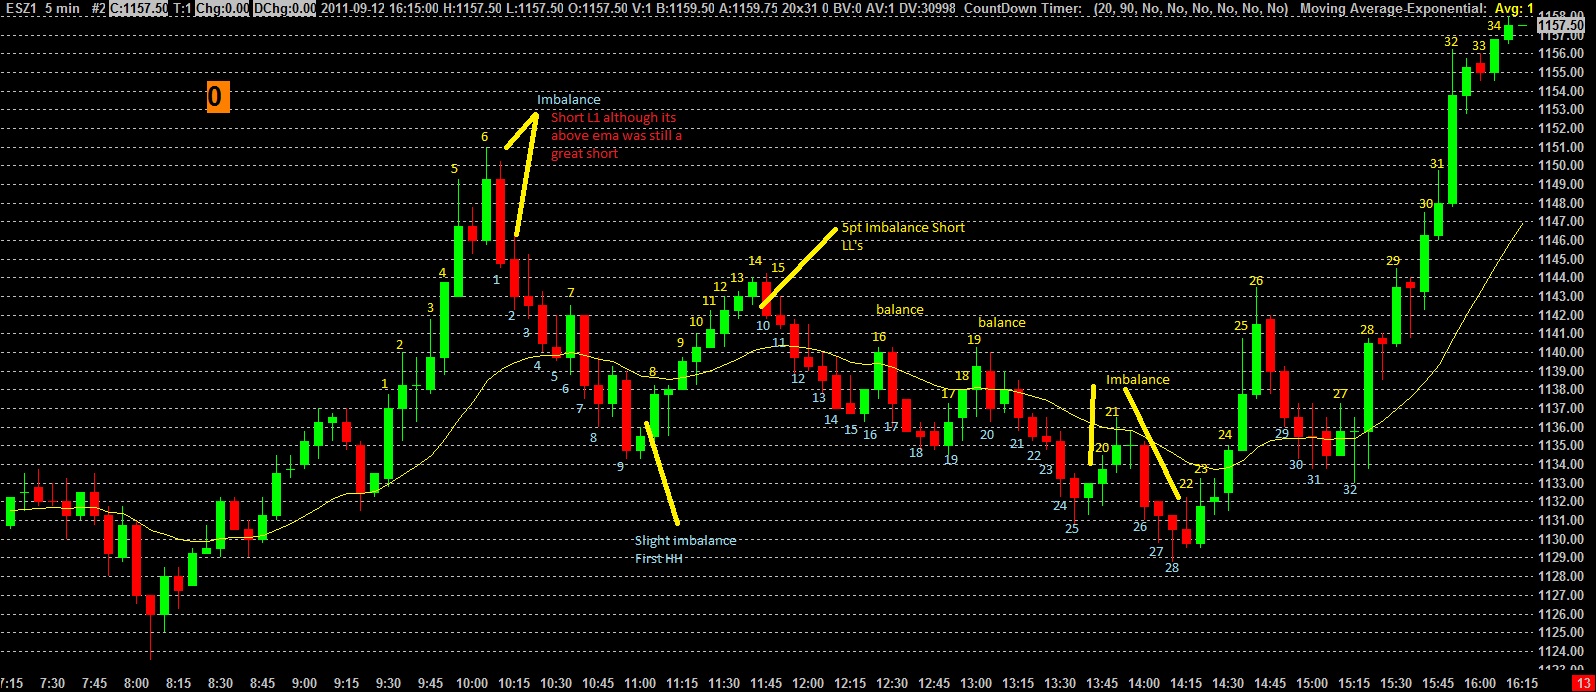
Just trading price action (correctly) is all anyone has to do to make a good living. The concept is bulls and bears only have so many opportunities to push the market in there direction are they doing a good job or wasting there HH's on a one tick
Just trading price action (correctly) is all anyone has to do to make a good living. The concept is bulls and bears only have so many opportunities to push the market in there direction are they doing a good job or wasting there HH's on a one tick
Click image for original size
Emini Day Trading /
Daily Notes /
Forecast /
Economic Events /
Search /
Terms and Conditions /
Disclaimer /
Books /
Online Books /
Site Map /
Contact /
Privacy Policy /
Links /
About /
Day Trading Forum /
Investment Calculators /
Pivot Point Calculator /
Market Profile Generator /
Fibonacci Calculator /
Mailing List /
Advertise Here /
Articles /
Financial Terms /
Brokers /
Software /
Holidays /
Stock Split Calendar /
Mortgage Calculator /
Donate
Copyright © 2004-2023, MyPivots. All rights reserved.
Copyright © 2004-2023, MyPivots. All rights reserved.