ES Fri 9-9-11
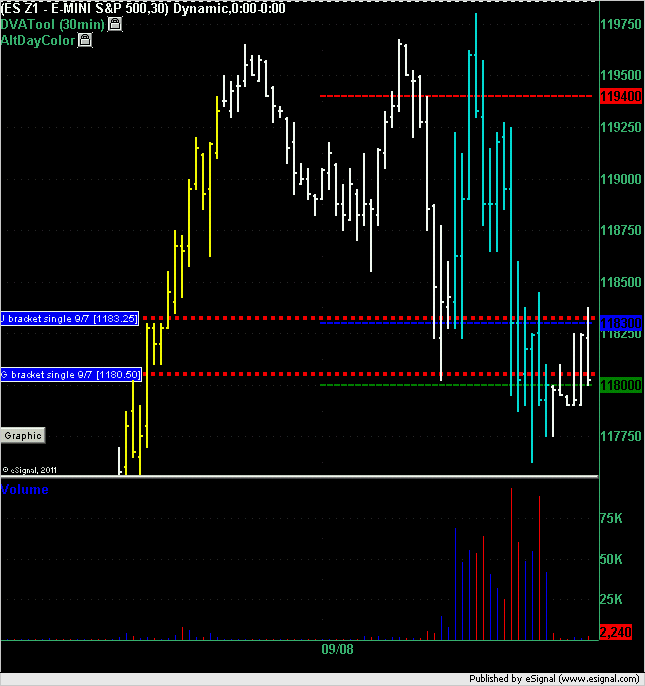
Market Profile summary from Thursday action. Note that you are looking at the December contract on this chart and not the September or continuous contract. i.e. the single prints you see on this chart that were generated on Wednesday you would not have seen on Wednesday because you would have been looking at the September contract.
The market opened above the Wednesday's J bracket and traded down to it triggering a long at 1183.25. Draw down on this trade was 1 point to 1182.25 in the following bracket which was then followed by a best run-up of 14.75 points to the high of day of 1198 even.
The market dropped through that single later on in the day and hit the second single which triggered a long at 1180.50 which had a draw down of 4.25 points to the low of the day of 1176.25 and a best run up of 5.5 points to 1186 even. Using a 4 point stop and a target greater than 5.25 points would have made that trade a loser. Note however that the run-up of 5.5 points happened before that 4.25 point draw down so most traders would have trailed a stop to breakeven by then.
Click image for original size
Originally posted by ayn
prestwick thanks for your response yesterday
i have a question regarding your methodology; say you have a swing from a swing top or bottom and the full projection gets hit to the tick...now the market makes a decent retrace and then continues in the original direction and the original full projection that was hit is blown through
my question is, do you look for another projection off of the original swing top/bottom or do you move to the following swing top/bottom
let me know if the question is not clear enough
thanks
Yes, KB said to do what you said - work off the next cycle projections. For example, a nice ES cycle high we had during globex was 1185.5 (Z). A nice bounce came of of 1177.5 which gave a projection of 1164.5. There was also a nice bounce off of 1175.25 which gave an initial projection of 1169.0 and a full of 1158.75 (which hit). We blew through 1169 with little fight and then blew through 1164.5 telling me it wanted lower. Also, all up projections off of cycle lows failed again saying the market wanted lower.
Now I am watching 1158.5-1162.5 giving an initial of 1165.0 and a full of 1169.0. If the downtrend is intact we should not get much past 1165.0.
If 1158.5 gets taken out (making 65.0 and 69.0 failed projections) I will look for 1154.0 based on 1185.35-1173.5.
Best yet, combine this technique with the key numbers from other methodologies like Bruce's and work with confluences.
I hope this is helpful. I suggest that you look at all that Kool Blue wrote up and left in the archive on this site (both price and time techniques). Day Trading may need to permission you into them if you have not yet been permissioned.
I see 65.0 just got taken out so now watching for 69.0.
flat at 66.50....
I hope some can understand my lunacy...I have predefined low volume numbers and I wait for a signal to either trade off them or trade for a retest of them.
So today we blew through the 66.50 and the theory would state that we need to come back up from below to retest it with a proper signal.
I also had the 62.50 which acted a bit different.....so I was taking shots near there....
we also had the perfect micro gap fill at 66.75......beautiful
hope that make sense and all enjot the weekend
bottom line is this...if we blow through a low volume zone (66.50)then I trade for the retest of that zone...having a second low volume zone at 62.50 was a bonus today..
that is great
Bruce where did you get the 66.50 number ?was that 9/02/11
prestwick, thanks for the response
i had penciled 85.5-80.25 as a decent move and retracement which yielded 71.75 as a full projection, level off of which there was a nice bounce
that is why i asked the question about moving to the next swing or not since the original swing and projecton had yielded a decent target and retracement
i moved to the next swing high, 79.75 and looked at the move down to 71.75 to project; the full projection of that move was also 58.75
i guess if you were looking for confirmation of the 58.75 originated off the 85.5 swing you would have found it off of the next swing high
Originally posted by prestwickdrive
Yes, KB said to do what you said - work off the next cycle projections. For example, a nice ES cycle high we had during globex was 1185.5 (Z). A nice bounce came of of 1177.5 which gave a projection of 1164.5. There was also a nice bounce off of 1175.25 which gave an initial projection of 1169.0 and a full of 1158.75 (which hit). We blew through 1169 with little fight and then blew through 1164.5 telling me it wanted lower. Also, all up projections off of cycle lows failed again saying the market wanted lower.
Now I am watching 1158.5-1162.5 giving an initial of 1165.0 and a full of 1169.0. If the downtrend is intact we should not get much past 1165.0.
If 1158.5 gets taken out (making 65.0 and 69.0 failed projections) I will look for 1154.0 based on 1185.35-1173.5.
Best yet, combine this technique with the key numbers from other methodologies like Bruce's and work with confluences.
I hope this is helpful. I suggest that you look at all that Kool Blue wrote up and left in the archive on this site (both price and time techniques). Day Trading may need to permission you into them if you have not yet been permissioned.
I see 65.0 just got taken out so now watching for 69.0.
Sept contract - huge volume. Have not switched this chart to Dec contract
Click image for original size
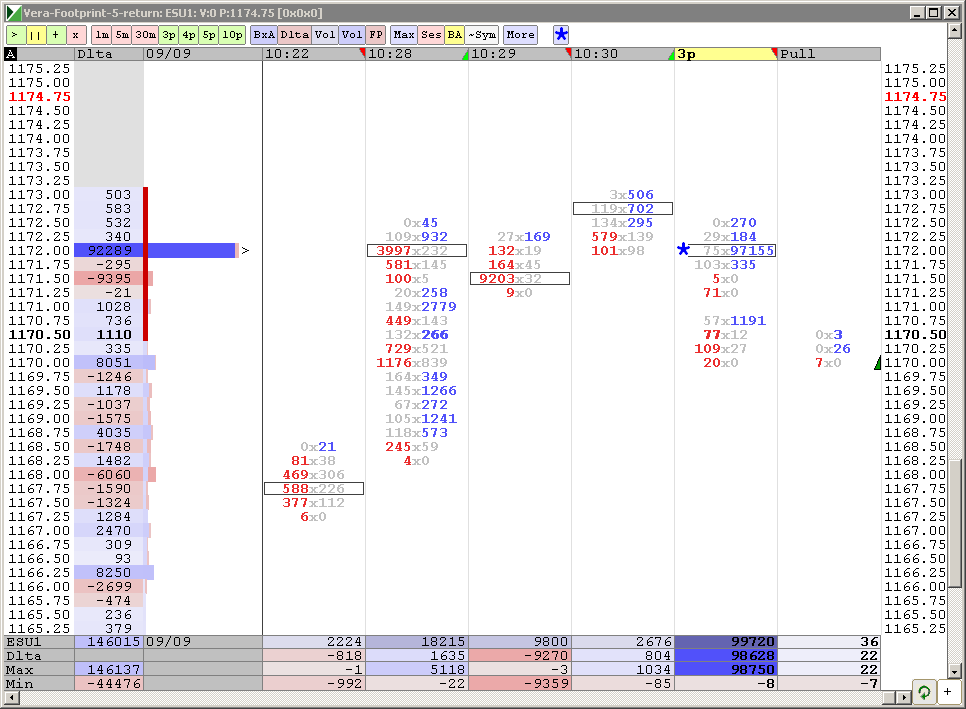
rburns, further to the entry "strategy", when a large order like this pops up, I put my buy order a couple of tics above it, just in case it was a "resting" order
no that was from the overnight session of 9-7-11...the S&P is changing it's stripes and we need to change with it....becoming much more global.......
the area to watch is that 70 - 71 if the IB breakout traders can push it that far...that is low volume area from todays overnight session......most will call that single prints and that is clear today...
very good odds they will make new highs in this day session and bust that 67.75 number
the area to watch is that 70 - 71 if the IB breakout traders can push it that far...that is low volume area from todays overnight session......most will call that single prints and that is clear today...
very good odds they will make new highs in this day session and bust that 67.75 number
Originally posted by della
Bruce where did you get the 66.50 number ?was that 9/02/11
Bruce, are those Dec contract numbers?
chris
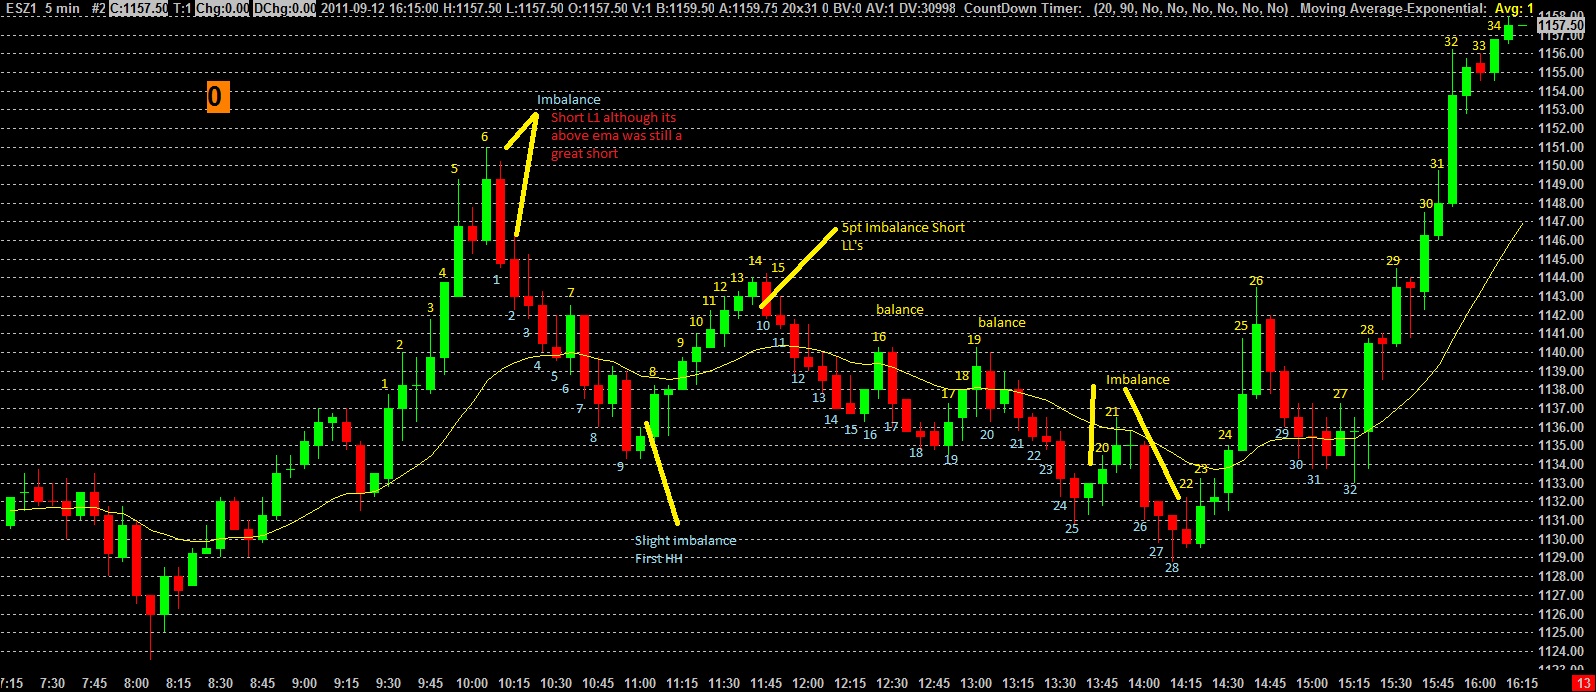
Just trading price action (correctly) is all anyone has to do to make a good living. The concept is bulls and bears only have so many opportunities to push the market in there direction are they doing a good job or wasting there HH's on a one tick
Just trading price action (correctly) is all anyone has to do to make a good living. The concept is bulls and bears only have so many opportunities to push the market in there direction are they doing a good job or wasting there HH's on a one tick
Click image for original size
Emini Day Trading /
Daily Notes /
Forecast /
Economic Events /
Search /
Terms and Conditions /
Disclaimer /
Books /
Online Books /
Site Map /
Contact /
Privacy Policy /
Links /
About /
Day Trading Forum /
Investment Calculators /
Pivot Point Calculator /
Market Profile Generator /
Fibonacci Calculator /
Mailing List /
Advertise Here /
Articles /
Financial Terms /
Brokers /
Software /
Holidays /
Stock Split Calendar /
Mortgage Calculator /
Donate
Copyright © 2004-2023, MyPivots. All rights reserved.
Copyright © 2004-2023, MyPivots. All rights reserved.