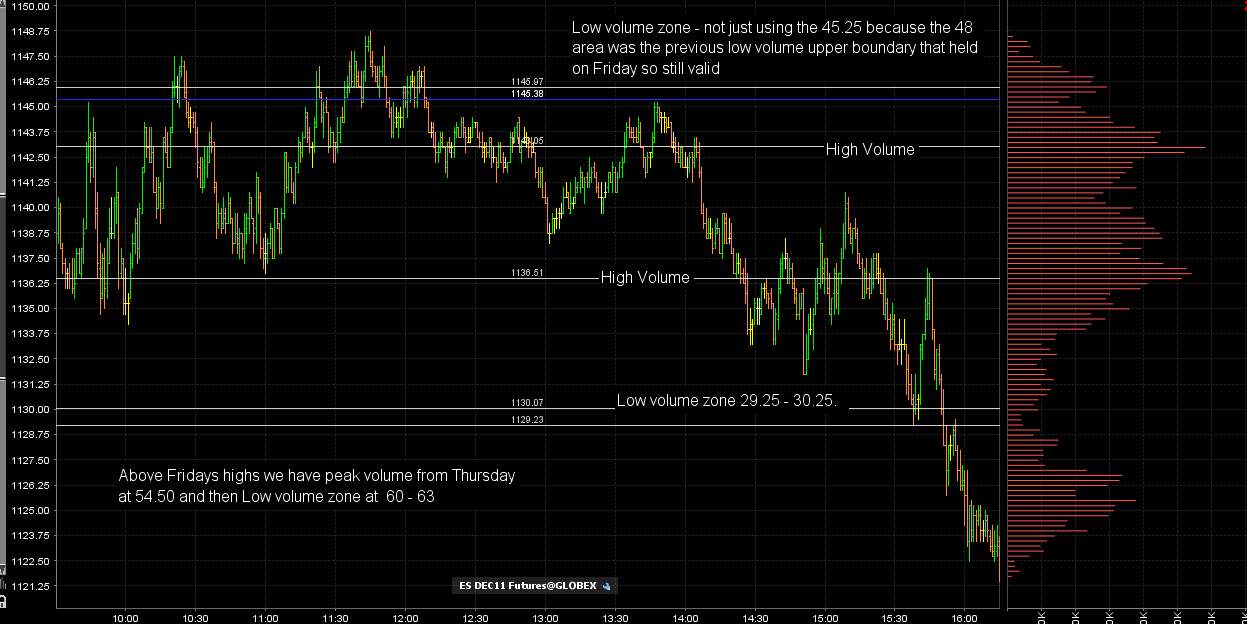
ES Monday 10-3-11
Here is how I have Fridays chart marked off...I have it on the one minute so some can see the price action at these points. A few things to keep in mind:
1) On friday the 47 - 48 low volume zone from Thursday held prices down. So even though I only have the 45.50 - 46 area marked off we still need to be aware of that entire zone from 45,50 - 48.75 as it is all really low volume.
2)Even though I have the 29.25 - 30.25 marked off we really have low volume up to 32.50 and then the histogram starts getting wider and volume starts to buldge
The traditional Market profile has the VA low at 35 and our secondary high volume number is 36.50 so that will be a point that I will not trade from due to that high volume.
The Va high comes in at 45 and we begin our low volume zone there so that will be a good number to trade from. The ideal trade up there would see them push through the 45 low volume zone and then find a short that will attempt to come back to fill in not only the 45 but come back down to the high volume magnet near 1143...!! Again using the high volume as targets instead of entry points.
Will forumulate a better trading plan once we see how the overnight does.
Click image for original size
It all started with rubin and clinton and citi bank If that never happen we would never had the problen
Update
Click image for original size
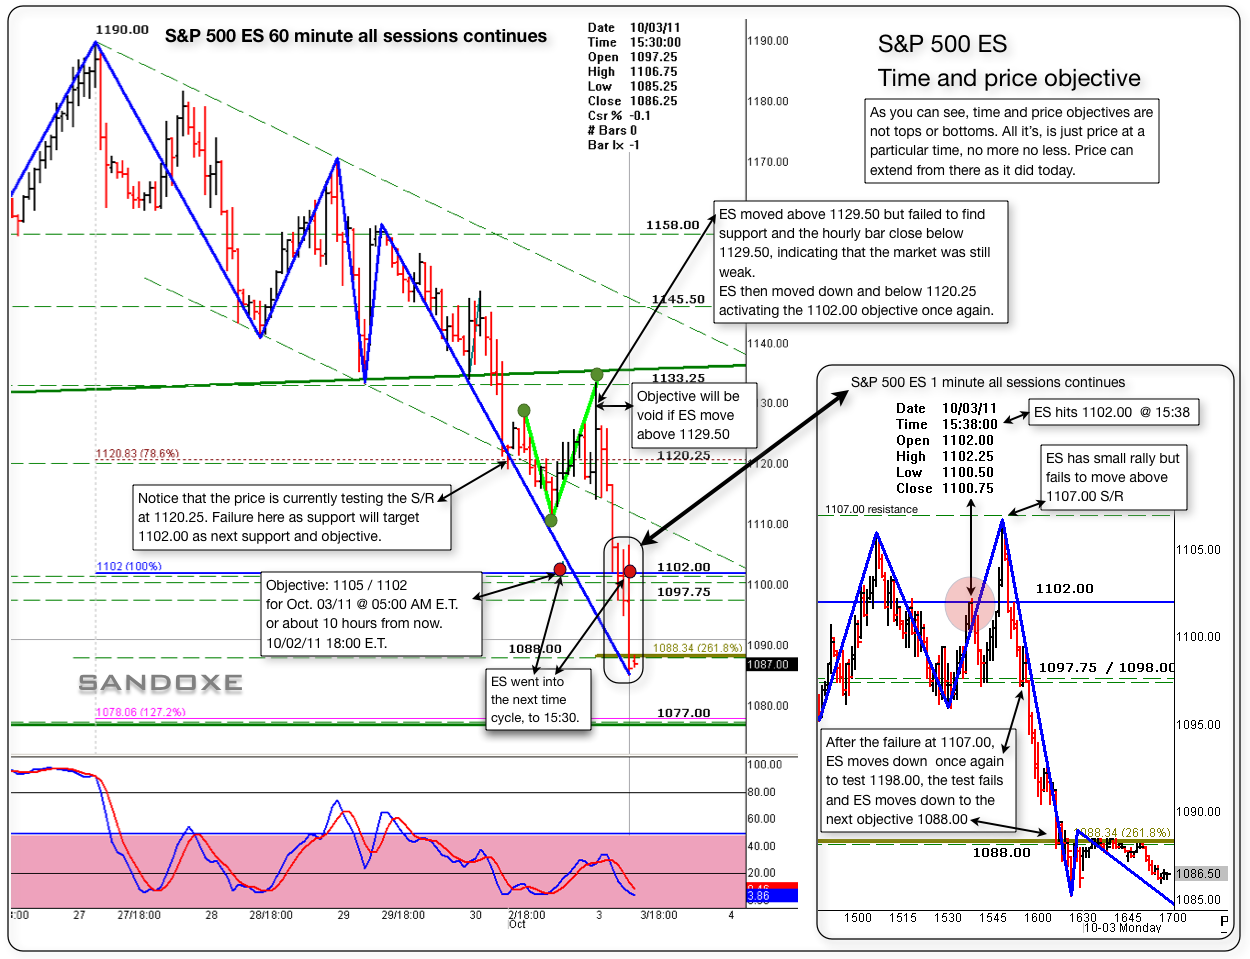
ES hit 1102.50 objective at 13:18. Now some bouncing and testing, Notice that the price did zig-zag a bit in the 1107/8 area. (seeing in the 1M chart) That area is now a small s/r. I think MM had that S/R too.
Below 1102 will target 1088.00 with some support at 1098.00 s/r.
Will see what happens between now and closing.
ES now trading 1104.00 @ 13:26
Below 1102 will target 1088.00 with some support at 1098.00 s/r.
Will see what happens between now and closing.
ES now trading 1104.00 @ 13:26
Originally posted by sandoxe
Will follow up on the 60 minute chart tonight.
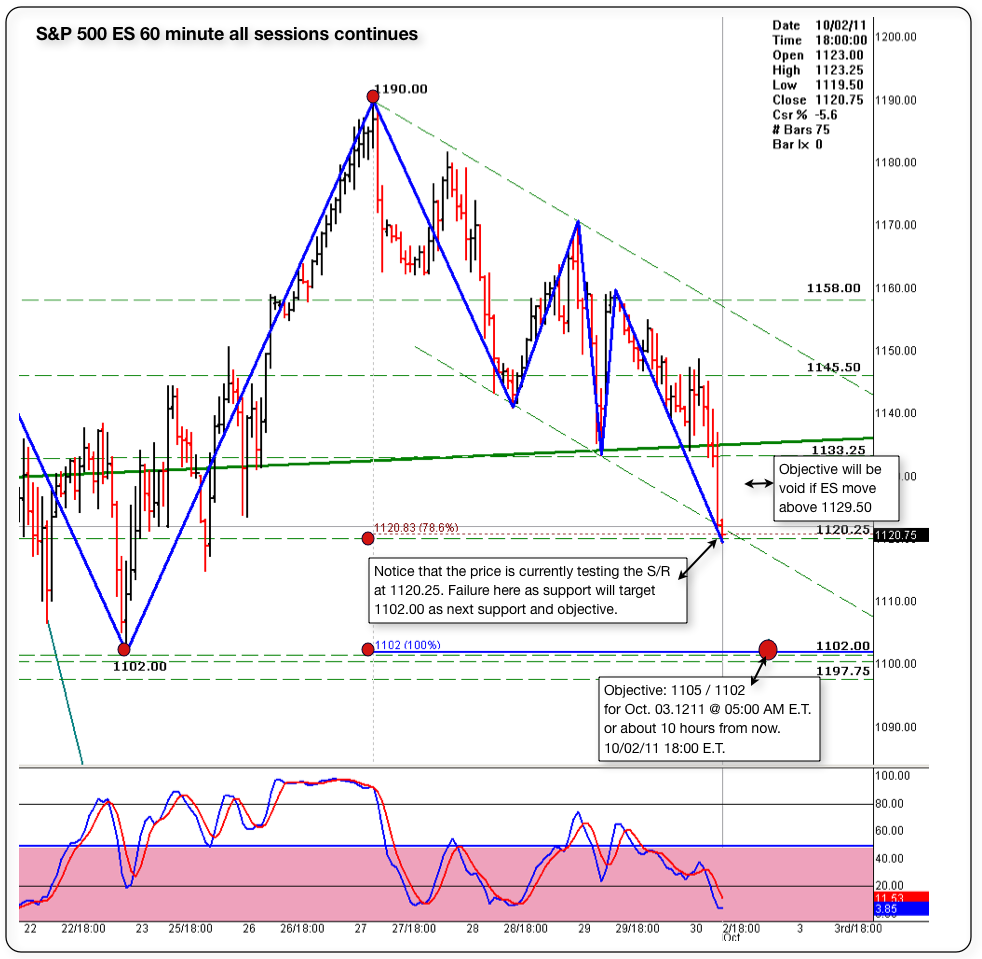
Interesting moves today. Is like it's fighting to move above 1120 but fails to do so. The pivot to change the down trend, is at 1129.50 (short term). Other than that? 1102.00 here we come, soon or latter. -- The price has all the time in the world to make it there. Next cycle time to 1102.00 is at 15:30 E.T.
ES now trading 1115.00 @ 12:33 E.T.
Will see, in due time the market will show us the way.
Originally posted by sandoxe
Here's a 60 minute chart with the objective for tomorrow AM.
Looks like a long shot, but what do I know?
Will see. The market always has the last word and in due time will show us the way.
I see for you the same I see for my self: Having the best of luck, fun, and awesome profitable trading day!!
Click image for original size
sandoxe, wasn't the objetive voided when es traded above 29.5 earlier this morning?
Yes. It voids the objective but it has to find support at at 1129.50. The 1129.50 means it's most likely the price will not look back. It works 90% of the time. I think I explained some time ago how it works. But I also leave it to people's common sense.
this selloff seems to have started a bit early...laying my money on a retest of 1110....those 07 ledge should go first...
bruce! what are referring to as early??
just for the record I had the 1112.50 as a key area and I am a bit surprised that the retest has come for that......YET!!!
I had 06.25 as a key number...gotta check my notes and other computer as the 1112.50 may have been high volume...Lisa do u have that as HV !!
two sets of single prints, a potential ledge and an early selloff has me not participating in the short side trade now !!....sometimes the best market / volume profile can offer us is reason NOT to trade in a particulat direction....for me the odds are against the downside....from here...of course we could tank into the close but I need to go with the probabilities and that is for the upside test into the areas mentioned
ES moved down to 1098 s/r and found support. I think for the rest of the session the ES will try to base here between 1102/1098 then late session or tomorrow AM a small rally.
bellow 1098 will open the door for 1088. --
Gals and guys I'm using the numbers as reference, don't get stack on my words. Go by what you see in your charts. If you find that some of your s/rs and M/P model is congruent with some of the numbers posted by other people, maybe you got something to work from, a potential trade may unfold from that area.
Originally posted by sandoxe
ES hit 1102.50 objective at 13:18. Now some bouncing and testing, Notice that the price did zig-zag a bit in the 1107/8 area. (seeing in the 1M chart) That area is now a small s/r. I think MM had that S/R too.
Below 1102 will target 1088.00 with some support at 1098.00 s/r.
Will see what happens between now and closing.
ES now trading 1104.00 @ 13:26
Originally posted by sandoxe
Will follow up on the 60 minute chart tonight.
Interesting moves today. Is like it's fighting to move above 1120 but fails to do so. The pivot to change the down trend, is at 1129.50 (short term). Other than that? 1102.00 here we come, soon or latter. -- The price has all the time in the world to make it there. Next cycle time to 1102.00 is at 15:30 E.T.
ES now trading 1115.00 @ 12:33 E.T.
Will see, in due time the market will show us the way.
Originally posted by sandoxe
Here's a 60 minute chart with the objective for tomorrow AM.
Looks like a long shot, but what do I know?
Will see. The market always has the last word and in due time will show us the way.
I see for you the same I see for my self: Having the best of luck, fun, and awesome profitable trading day!!
Click image for original size
That selloff started at 12:30 eastern time....better selloffs and rallies usually happen at the 2 - 2:30 time frame...so this one is early...I'm not saying it can't keep going but I'm gonna sit out any decline now and look to be more agressive on the long side for the retest mentioned....I also go much lighter at this time as the first 90 minutes of the day is my bread and butter trade time
I confimed that the 1112.50 was high volume......so the 06 was the better retest trade. I wasn't here to trade either
I confimed that the 1112.50 was high volume......so the 06 was the better retest trade. I wasn't here to trade either
Originally posted by palmer
bruce! what are referring to as early??
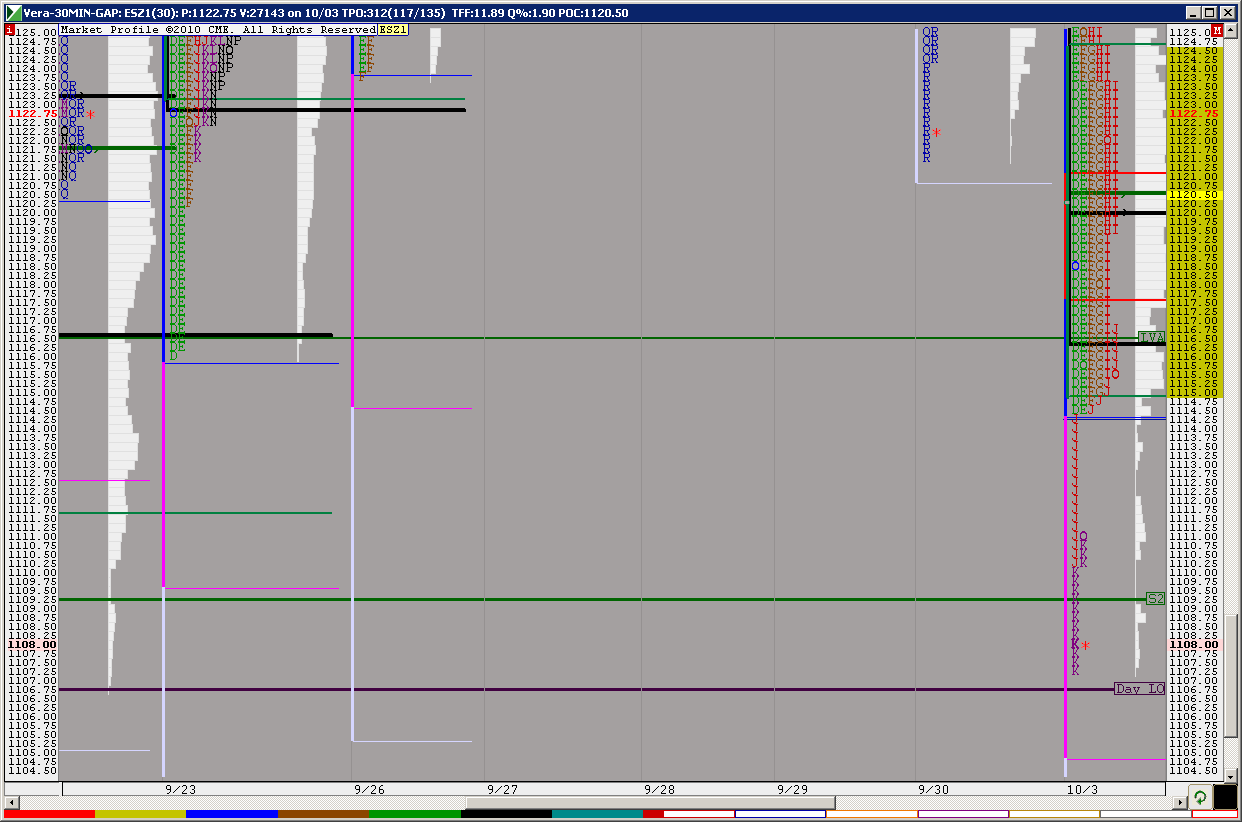
Here's the 60 minute follow up chart. The chart is self explanatory, showing how I used and see s/rs.
The time and price objectives shown in this chart is about the same as the previous time and price chart posted some time ago, where the price hits the objective before the time and moves lower, but, returns to the price objective at or near the time cycle.
I hope this charts help in some way.
The time and price objectives shown in this chart is about the same as the previous time and price chart posted some time ago, where the price hits the objective before the time and moves lower, but, returns to the price objective at or near the time cycle.
I hope this charts help in some way.
Click image for original size
Originally posted by sandoxe
ES moved down to 1098 s/r and found support. I think for the rest of the session the ES will try to base here between 1102/1098 then late session or tomorrow AM a small rally.
bellow 1098 will open the door for 1088. --
Gals and guys I'm using the numbers as reference, don't get stack on my words. Go by what you see in your charts. If you find that some of your s/rs and M/P model is congruent with some of the numbers posted by other people, maybe you got something to work from, a potential trade may unfold from that area.
Originally posted by sandoxe
ES hit 1102.50 objective at 13:18. Now some bouncing and testing, Notice that the price did zig-zag a bit in the 1107/8 area. (seeing in the 1M chart) That area is now a small s/r. I think MM had that S/R too.
Below 1102 will target 1088.00 with some support at 1098.00 s/r.
Will see what happens between now and closing.
ES now trading 1104.00 @ 13:26
Originally posted by sandoxe
Will follow up on the 60 minute chart tonight.
Interesting moves today. Is like it's fighting to move above 1120 but fails to do so. The pivot to change the down trend, is at 1129.50 (short term). Other than that? 1102.00 here we come, soon or latter. -- The price has all the time in the world to make it there. Next cycle time to 1102.00 is at 15:30 E.T.
ES now trading 1115.00 @ 12:33 E.T.
Will see, in due time the market will show us the way.
Originally posted by sandoxe
Here's a 60 minute chart with the objective for tomorrow AM.
Looks like a long shot, but what do I know?
Will see. The market always has the last word and in due time will show us the way.
I see for you the same I see for my self: Having the best of luck, fun, and awesome profitable trading day!!
Click image for original size
Emini Day Trading /
Daily Notes /
Forecast /
Economic Events /
Search /
Terms and Conditions /
Disclaimer /
Books /
Online Books /
Site Map /
Contact /
Privacy Policy /
Links /
About /
Day Trading Forum /
Investment Calculators /
Pivot Point Calculator /
Market Profile Generator /
Fibonacci Calculator /
Mailing List /
Advertise Here /
Articles /
Financial Terms /
Brokers /
Software /
Holidays /
Stock Split Calendar /
Mortgage Calculator /
Donate
Copyright © 2004-2023, MyPivots. All rights reserved.
Copyright © 2004-2023, MyPivots. All rights reserved.