ES Monday 10-3-11
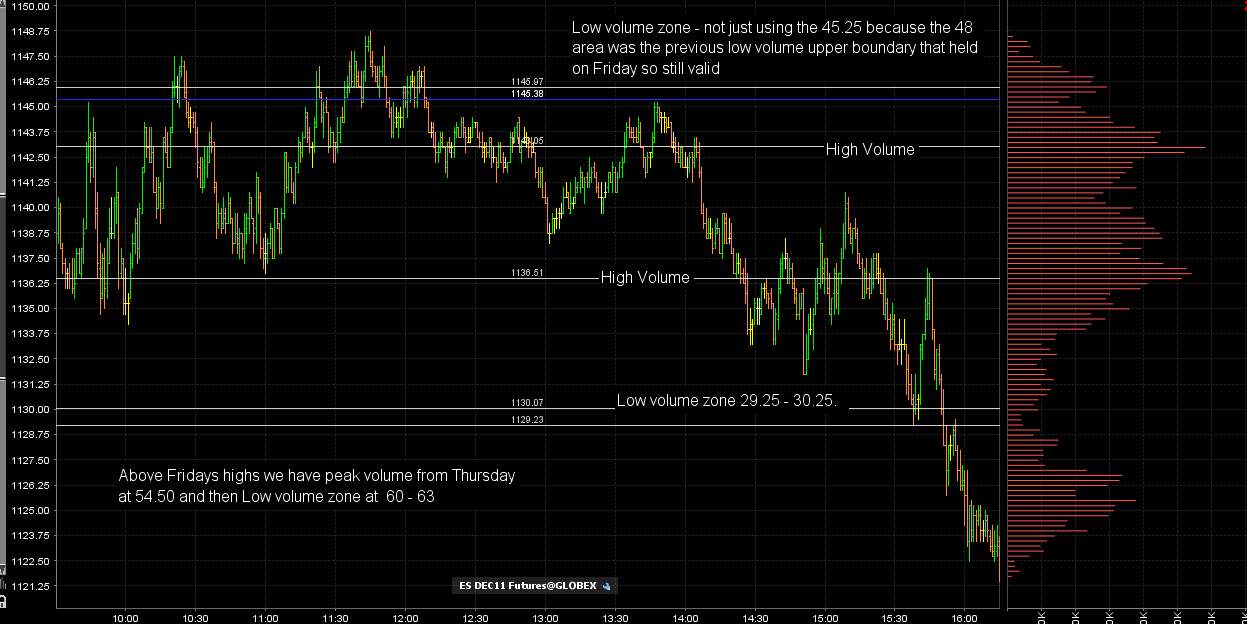
Here is how I have Fridays chart marked off...I have it on the one minute so some can see the price action at these points. A few things to keep in mind:
1) On friday the 47 - 48 low volume zone from Thursday held prices down. So even though I only have the 45.50 - 46 area marked off we still need to be aware of that entire zone from 45,50 - 48.75 as it is all really low volume.
2)Even though I have the 29.25 - 30.25 marked off we really have low volume up to 32.50 and then the histogram starts getting wider and volume starts to buldge
The traditional Market profile has the VA low at 35 and our secondary high volume number is 36.50 so that will be a point that I will not trade from due to that high volume.
The Va high comes in at 45 and we begin our low volume zone there so that will be a good number to trade from. The ideal trade up there would see them push through the 45 low volume zone and then find a short that will attempt to come back to fill in not only the 45 but come back down to the high volume magnet near 1143...!! Again using the high volume as targets instead of entry points.
Will forumulate a better trading plan once we see how the overnight does.
Click image for original size
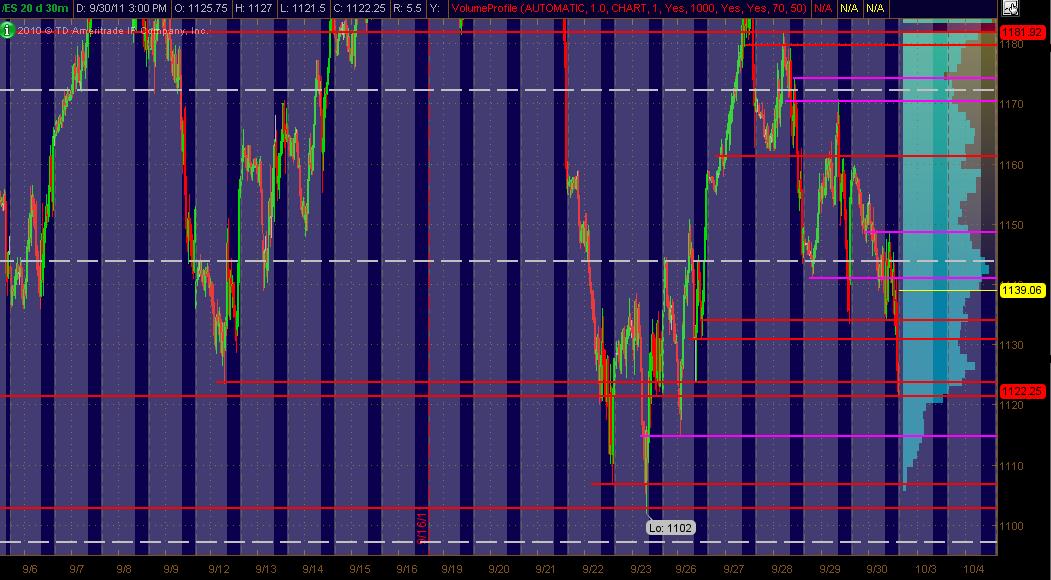
Here’s what I’ve got for my ES MAP going into Monday’s trading looking at a 30m chart. Some overlap with Bruce’s numbers in an area or two above Friday’s RTH close:
1149-50 is 1) Friday’s RTH High 2) a Daily Pivot 3) 20 day Low Vol area on Vol Profile
1143 area is 1) 20 day High Vol spike as per Vol Profile 2) Weekly Pivot 3) a .382 Fib Retracement 4) DeMark Daily R1 pvt
1134-35 is 1) potential significant PASR level 2) Thursday’s RTH Low and Friday’s RTH morning Low 3) Daily Pivot 4) a minor 20 day Vol Profile spike in volume
BELOW Friday's RTH close I've got potentially significant PASR levels of:
1115 area and then 1107 area
Here's the 30m ES chart with Red lines as potentially signif PASR levels and Magenta lines as potentially "semi"-significant PASR levels. The White Dashed lines are Wkly Pvts. The Light Blue "profile" on the right vertical axis is a 20 day Volume Profile. Hope this is useful as a MAP for folks.
(fyi, the grayed out background is overnight trading on this All Trading Hours chart)
Click image for original size
Thanks Bruce and MM, I'm feeling good as it confirms my areas that I laid out Friday night.
I can only add, we have a single print Friday at 1131.50, correct?
Good trading to all come Monday.
I can only add, we have a single print Friday at 1131.50, correct?
Good trading to all come Monday.
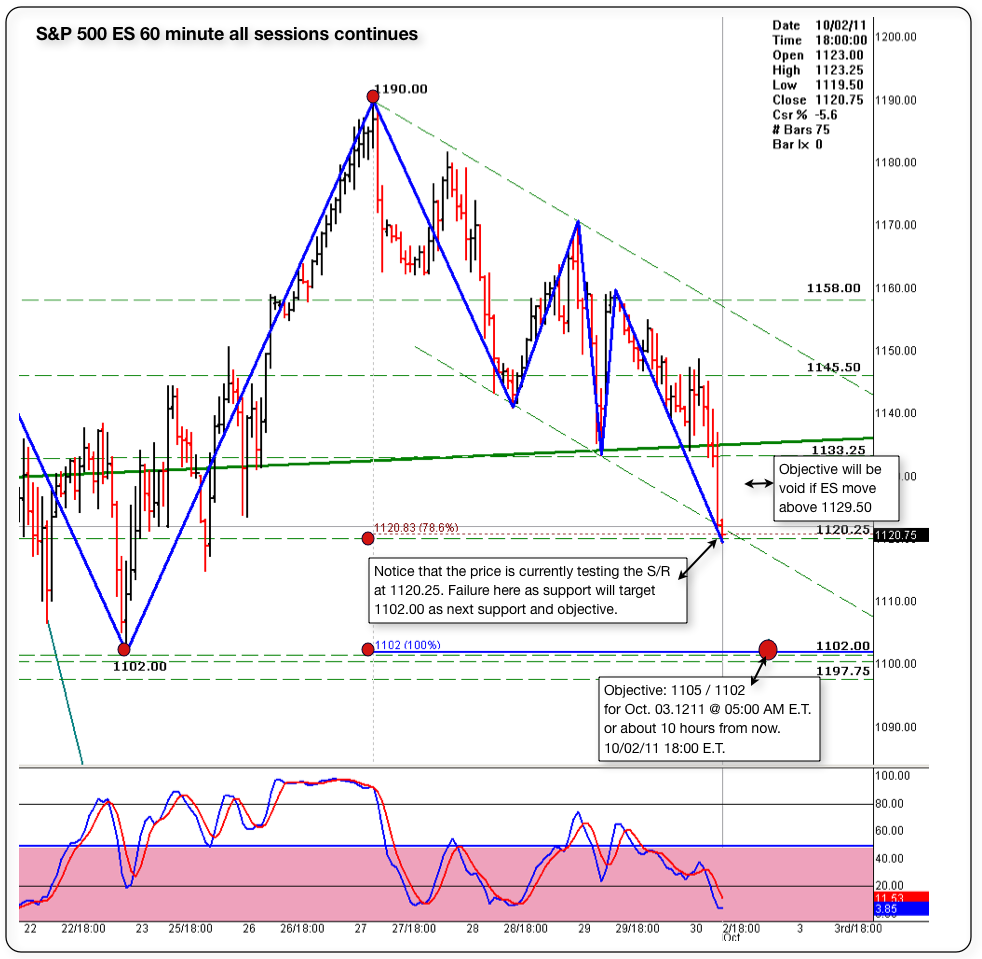
Here's a 60 minute chart with the objective for tomorrow AM.
Looks like a long shot, but what do I know?
Will see. The market always has the last word and in due time will show us the way.
I see for you the same I see for my self: Having the best of luck, fun, and awesome profitable trading day!!
Looks like a long shot, but what do I know?
Will see. The market always has the last word and in due time will show us the way.
I see for you the same I see for my self: Having the best of luck, fun, and awesome profitable trading day!!
Click image for original size
I show a single print at 1131.50 also.
same here...sorry for the delay
For any other stock traders out there ... here's a potential LONG play IF the overall market indices move up during the RTH. High risk but worth watching for Monday and the next few days UNLESS it breaks down below support that you'll see on the daily chart (which may make for a good tight small initial stop loss)
HANS
(funky mkt. and funky stock movement ... and the big cap stocks will track the index ... but this 'un may offer upside potential ... and don't slag me if it drops 10 points)
MM
HANS
(funky mkt. and funky stock movement ... and the big cap stocks will track the index ... but this 'un may offer upside potential ... and don't slag me if it drops 10 points)
MM
Great posts guys!! I have:
- 1135 as a bias area for me.. it has VAL/PIV/3day rolling pivot low within ticks from each other.. Bruce mentioned HVL is just [email protected] so be careful initiating position there with a stop @ the HVL..
- 1131 is the Fisher daily pivot range low.. If the market stays under 31 shows confirmed weakness, and we may be gunning for Friday's lows..
Happy Trading all!!
TZ
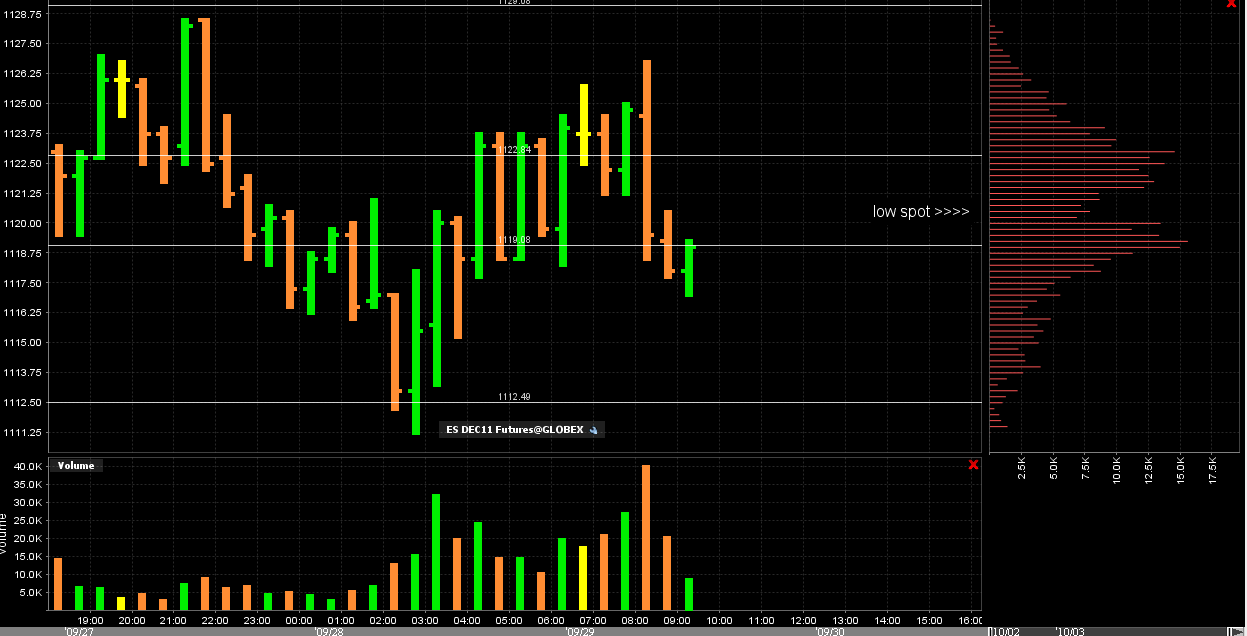
My trade plan:
Overnight market is balanced with high volume coming in at the 18.75 and 22.75 areas...they are trying to make that a bell curve so as I type there is a "low" spot in between those numbers. Neither matters too much to the plan and here is why.
1)I will buy if we open in RTH and drop down First to the 3 a.m Sunday open and lower below 15.75. Other attemtpt at longs will be below the O/N lows at 1112.50 ( I had a low voume number there from a previous RTH session). Target on the Long entry will be the 1118.75 high volume. Either long will need a signal from the delta.
2)Since the current overnight high stopped only 2 tics below our key low volume zone then the plan will be to sell that zone especially on any attempt to trade up there first. Trading there will take out the Overnight highs and fall into the 29 - 30 area already identified. Target will be the high volume at 22.75 ultimately.
The general theme I am looking at early on is that they still want to fill in the low spots between the areas on the Overnight session.
here is a picture..the low spot is also last weeks RTH low !!!! a critical price anyway.
Click image for original size
for those who don't know this already you can click on a chart to make it bigger or scroll it to the left to see the whole thing...
Lets all trade well today and follow your rules and plan. Patience !!!! I have it taped on my computer!!
Lets all trade well today and follow your rules and plan. Patience !!!! I have it taped on my computer!!
Be aware the September low is at 1106.75. This is a major reference point as is the August low just below it.
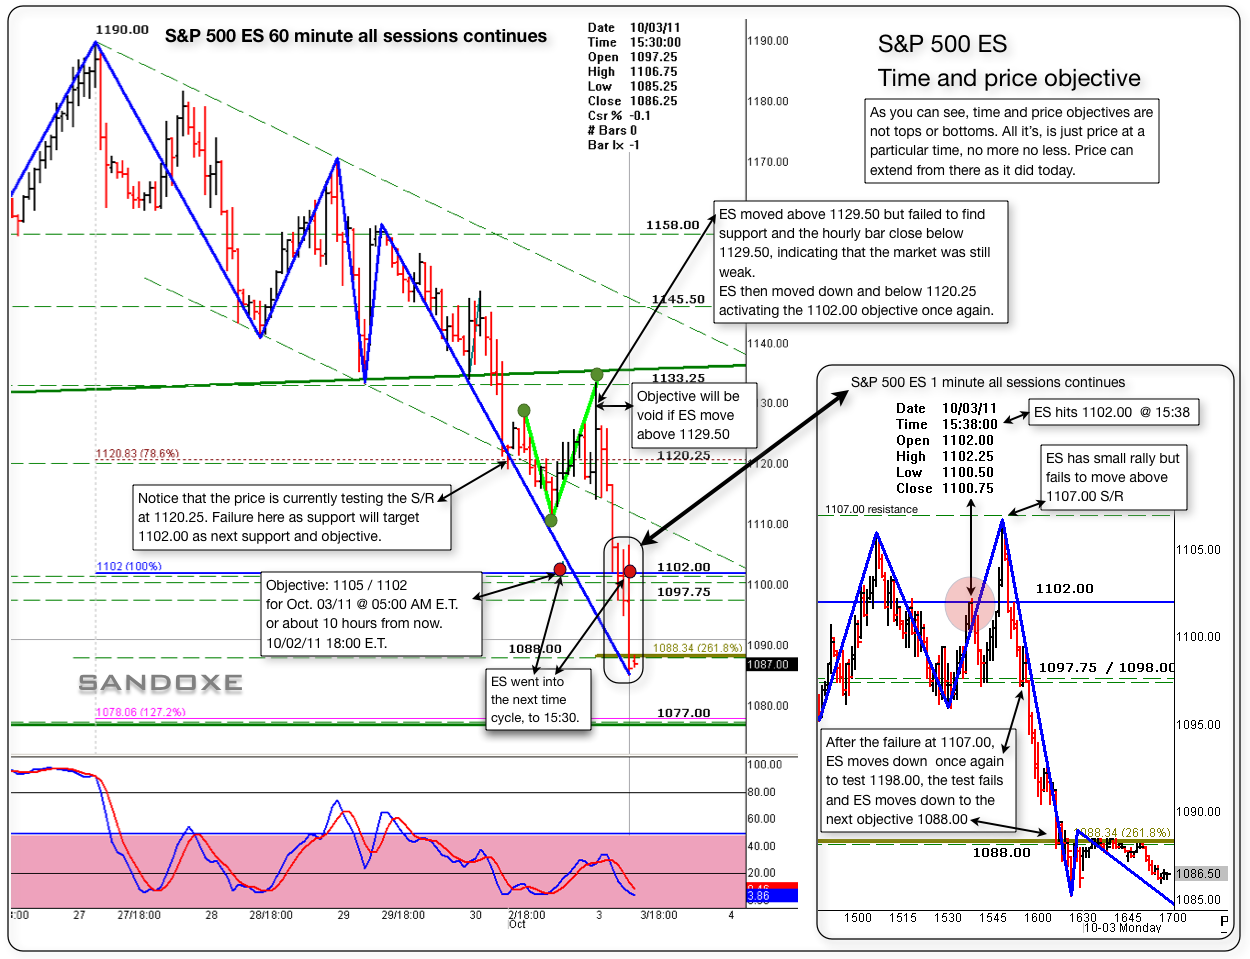
Here's the 60 minute follow up chart. The chart is self explanatory, showing how I used and see s/rs.
The time and price objectives shown in this chart is about the same as the previous time and price chart posted some time ago, where the price hits the objective before the time and moves lower, but, returns to the price objective at or near the time cycle.
I hope this charts help in some way.
The time and price objectives shown in this chart is about the same as the previous time and price chart posted some time ago, where the price hits the objective before the time and moves lower, but, returns to the price objective at or near the time cycle.
I hope this charts help in some way.
Click image for original size
Originally posted by sandoxe
ES moved down to 1098 s/r and found support. I think for the rest of the session the ES will try to base here between 1102/1098 then late session or tomorrow AM a small rally.
bellow 1098 will open the door for 1088. --
Gals and guys I'm using the numbers as reference, don't get stack on my words. Go by what you see in your charts. If you find that some of your s/rs and M/P model is congruent with some of the numbers posted by other people, maybe you got something to work from, a potential trade may unfold from that area.
Originally posted by sandoxe
ES hit 1102.50 objective at 13:18. Now some bouncing and testing, Notice that the price did zig-zag a bit in the 1107/8 area. (seeing in the 1M chart) That area is now a small s/r. I think MM had that S/R too.
Below 1102 will target 1088.00 with some support at 1098.00 s/r.
Will see what happens between now and closing.
ES now trading 1104.00 @ 13:26
Originally posted by sandoxe
Will follow up on the 60 minute chart tonight.
Interesting moves today. Is like it's fighting to move above 1120 but fails to do so. The pivot to change the down trend, is at 1129.50 (short term). Other than that? 1102.00 here we come, soon or latter. -- The price has all the time in the world to make it there. Next cycle time to 1102.00 is at 15:30 E.T.
ES now trading 1115.00 @ 12:33 E.T.
Will see, in due time the market will show us the way.
Originally posted by sandoxe
Here's a 60 minute chart with the objective for tomorrow AM.
Looks like a long shot, but what do I know?
Will see. The market always has the last word and in due time will show us the way.
I see for you the same I see for my self: Having the best of luck, fun, and awesome profitable trading day!!
Click image for original size
Emini Day Trading /
Daily Notes /
Forecast /
Economic Events /
Search /
Terms and Conditions /
Disclaimer /
Books /
Online Books /
Site Map /
Contact /
Privacy Policy /
Links /
About /
Day Trading Forum /
Investment Calculators /
Pivot Point Calculator /
Market Profile Generator /
Fibonacci Calculator /
Mailing List /
Advertise Here /
Articles /
Financial Terms /
Brokers /
Software /
Holidays /
Stock Split Calendar /
Mortgage Calculator /
Donate
Copyright © 2004-2023, MyPivots. All rights reserved.
Copyright © 2004-2023, MyPivots. All rights reserved.