ES Tuesday 10-11-11
The following resistance points are created from trade on 9-20 and 9-21.
1193.75 Low volume
1200 key number
1205 - 1206 Low volume and the best low volume number as we move up..assuming we move up
support points are created from Mondays trade at :
1186 - 1188 low volume
1182.50 peak volume - I will not use this area for entry
1180 - 1181 low volume
1175.75 - 1176.50 low volume
71.50 - breakout point from overnight trade
as usual the low volume is where the better trades are at.
Honorable mention to the 1214 - 1215 area in case we really get a move up
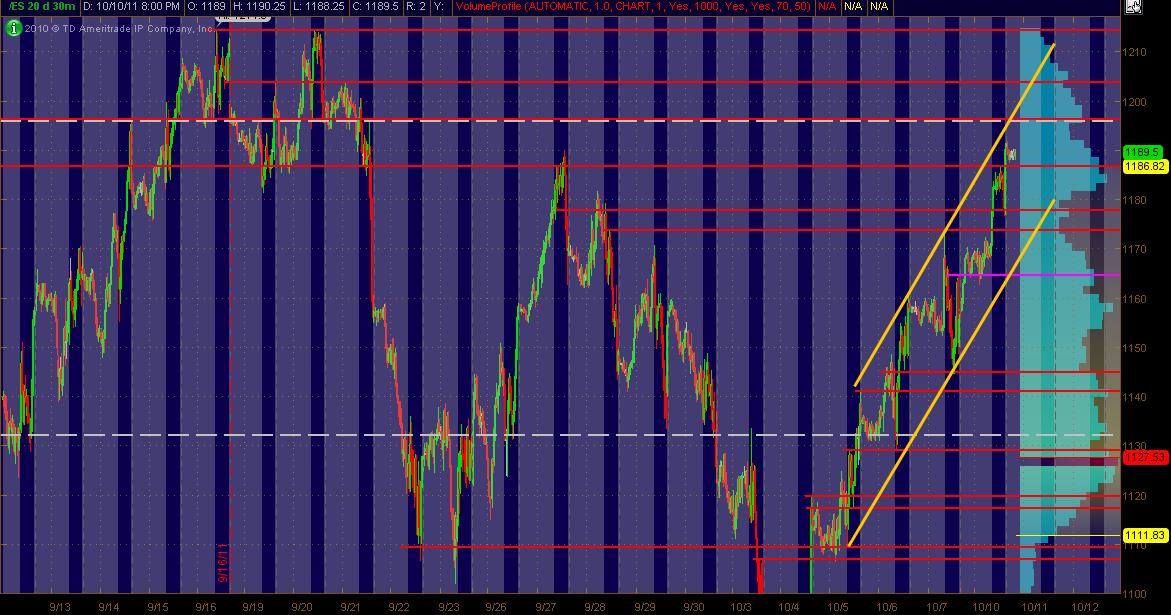
Here's my 20 day ES 30min chart MAP coming into Tusday's trading. The Red lines are potentially significant PASR levels with Magenta being semi-significant. The White dashed lines are Weekly Pivots. Also, I've drawn in a Trend Channel in Yellow that's currently containing price. The right vertical Light Blue reflects 20 days of Volume Profile activity. The gray background is "overnight" trading on this All Trading Hours chart. Hope some find this helpful!
(btw ... any PASR lines that are within 2-4 points of each other represent a ZONE between them)
(btw ... any PASR lines that are within 2-4 points of each other represent a ZONE between them)
Click image for original size
I love this! Every body is putting it together and looking toward some objectives and possibilities. Very simple! Latter, I will post a chart with the pivots generate by the pivot calculator we have here at the My Pivots website.
Will see what the ES have for us tomorrow.-.-.
Will see what the ES have for us tomorrow.-.-.
80-81 LVN has some confluence though in somewhat of an odd location..
79.50 has - pivot/prev high/val
81 has - 3 day rolling piv high
All the numbers + the LVN may show some significance in this area..
1160 also has prev high + 3day rolling pivot low, may be the bottom of a move if we get that far..
79.50 has - pivot/prev high/val
81 has - 3 day rolling piv high
All the numbers + the LVN may show some significance in this area..
1160 also has prev high + 3day rolling pivot low, may be the bottom of a move if we get that far..
Referencing the 30min ES chart MAP above, I'm looking at the following numbers as described:
1204-1206 - PASR level, Fib cluster, Daily R1 Pivot
1196 - Wkly Pivot, PASR, Midline of Trend Channel, 20-day Low Volume area as per VolProf
1174-1178 - PASR "zone", Trendline, Fib Rtc cluster, DeMark S1 Pvt
1164-1165 - minor PASR, minor Fit Rtc cluster, 20-day Low Volume area as per VolProf
1204-1206 - PASR level, Fib cluster, Daily R1 Pivot
1196 - Wkly Pivot, PASR, Midline of Trend Channel, 20-day Low Volume area as per VolProf
1174-1178 - PASR "zone", Trendline, Fib Rtc cluster, DeMark S1 Pvt
1164-1165 - minor PASR, minor Fit Rtc cluster, 20-day Low Volume area as per VolProf
destiny | 10-Oct-2011 at 9:43 PM | Rep: 260 | Posts: 74 | mail
Time to reflect on ones trading over last 2 weeks.
http://www.screencast.com/t/cZkrjSRScHJx
Time to reflect on ones trading over last 2 weeks.
http://www.screencast.com/t/cZkrjSRScHJx
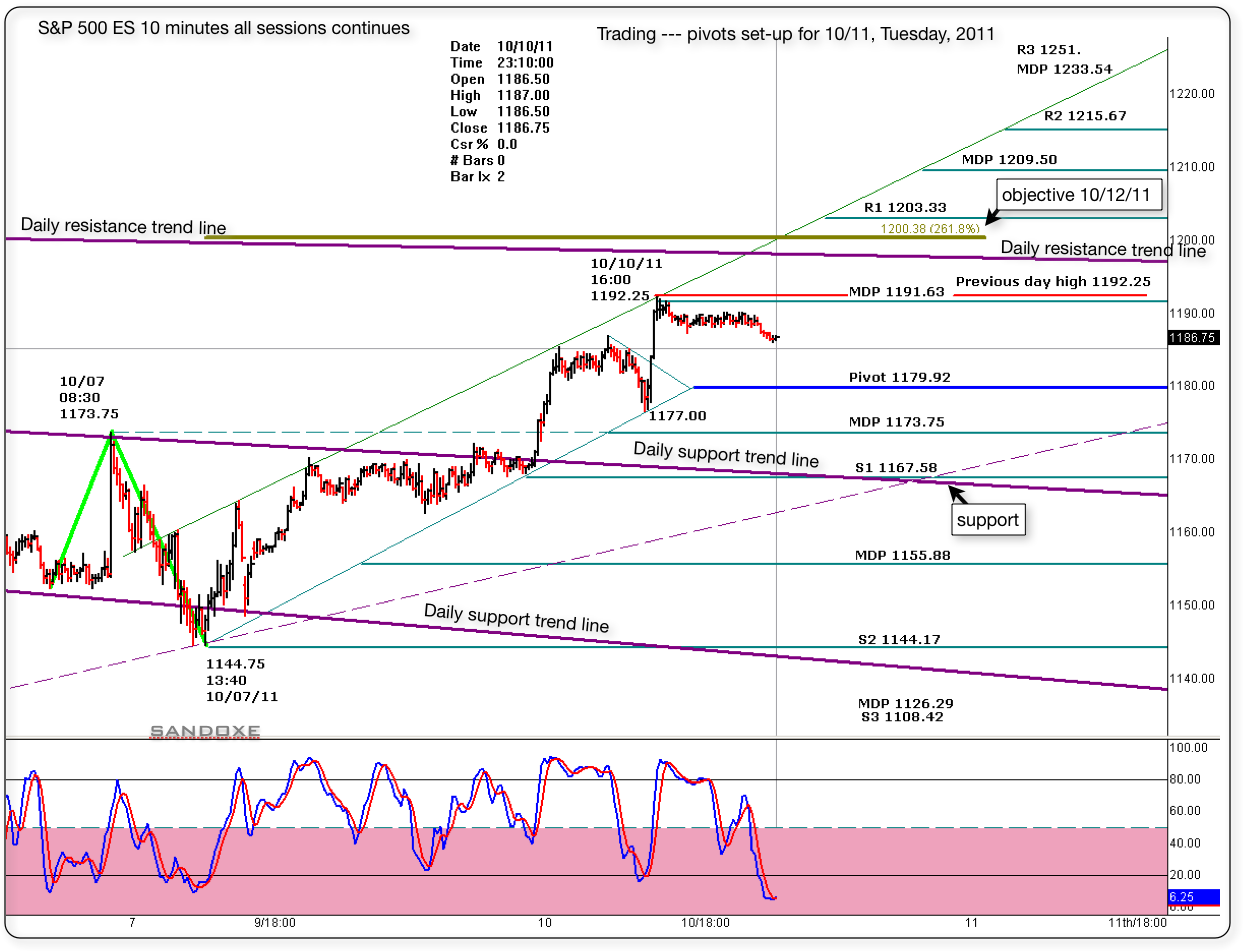
Here's an all sessions 10 minute chart with the pivots for tomorrow. As you can see, some of the levels are congruent with previous highs and lows.
The 1167.00 S1 level is a nice support bc the daily trend line is crossing that area tomorrow morning. So "if" (don't you hate that word?" ) the market moves down, it's a good place to consider taking profits and maybe look for a buying set-up. Below that, the next level will be 1144.25. Way down there, but it's good to know that's there.
For the outside. Notice that we have an MDP at 1191.50. And today's high is near by at 1192.25. So, moving above 1192.25 will target 1200.00 (I have 1200 objective for 10/12/11 but it could due it tomorrow) and possibly the 09/20 high at 1214.50. But there's a daily resistance trend line crossing tomorrow at about 1195.00. Will be great if it jumps it overnight and never looks back. That will be bullish!!!!
Will see. As always, the market has the last word and in due time will show me the way.
I see for you the same I see for my self: Having the best of luck and fun, awesome profitable trading day!
Click image for original size
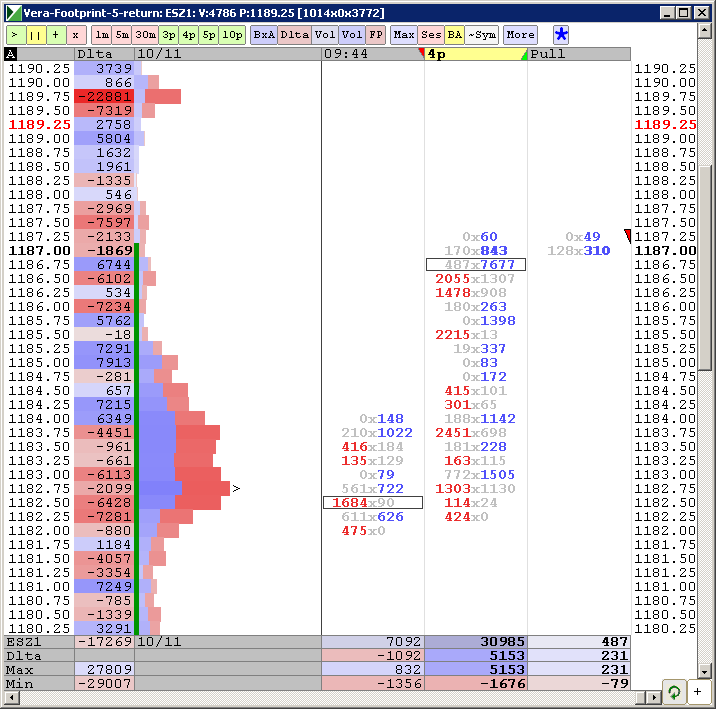
my trade plan once 9 a.m hits is to be a buyer at these current lows near 80 - 81......next buy zone down below is 75 - 76.....all trades need to be aware of that high volume at 82.50
best sells will be up at the 86 - 88 area......BUT the concern is that we have a ledge in the overnight right at the 4 pm close of yesterday at 1190.25.......so we need to be careful on fades too early ....these may be false signals so I plan to trade a bit lighter up there
we are on schedule to open inside yesterdays bell curve so the basic plan is to buy at the lower edge and sell at the upper edge...
Other sell area will be in the 94 - 96 zone but I will not take trades near the 1200 today....I will wait for that 1204 - 1206 area for fades...
that 82.50 is shaping up to be a strong magnet so far!!
volume very light
Click image for original size
starting sells at 88 ..air below
new video Steidlmayer Volume Strips: A New Method to Analyze the Markets http://www.cmegroup.com/education/steidlmayer-volume-strips-video.html
Emini Day Trading /
Daily Notes /
Forecast /
Economic Events /
Search /
Terms and Conditions /
Disclaimer /
Books /
Online Books /
Site Map /
Contact /
Privacy Policy /
Links /
About /
Day Trading Forum /
Investment Calculators /
Pivot Point Calculator /
Market Profile Generator /
Fibonacci Calculator /
Mailing List /
Advertise Here /
Articles /
Financial Terms /
Brokers /
Software /
Holidays /
Stock Split Calendar /
Mortgage Calculator /
Donate
Copyright © 2004-2023, MyPivots. All rights reserved.
Copyright © 2004-2023, MyPivots. All rights reserved.