ES Wednesday 3-21-12
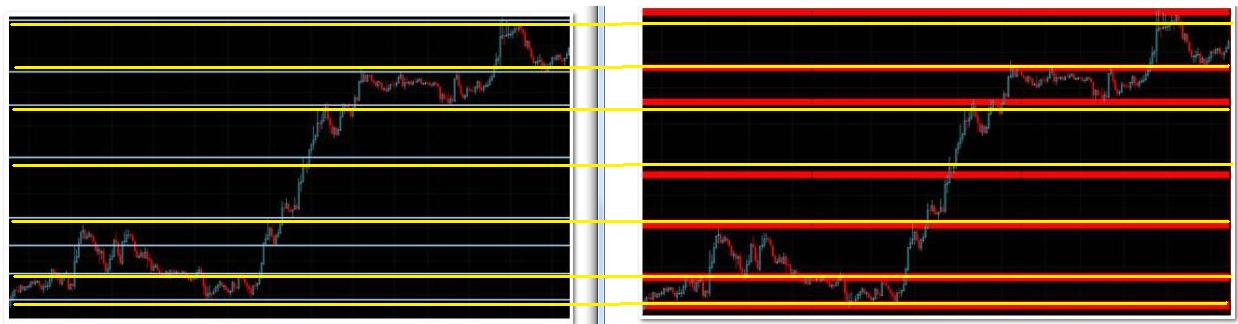
A bit different post to launch the ES Daily topic today. There are SUPPORT/RESISTANCE fee for services out ther that I've alluded to before. One had a promo online gig Tuesday night. They had a chart with just S/R lines drawn in cyan based on past chart price swings. Then, after describing how they incorporate multi-time frame S/R, Fib analysis, the variety of calculated pivot formulas, Ewave, Moving Averages, Volume Profile, Market Profile, and the KITCHEN SINK thrown in ... they showed the subsequent weighted statistical alalysis chart displaying their final and best way cool UBER S/R ZONES in thick Red lines. Here's a comparison of the initial chart ... and the proprietary high-end analysis chart. Ya gotta love this:
I've got the before chart on the left with the after chart on the right. And, I drew Yellow lines across both that shows how much high-end statistical/multi-framed/20-types of analysis hones down the valuable and high-probability UBER ZONES for S/R levels/zones.
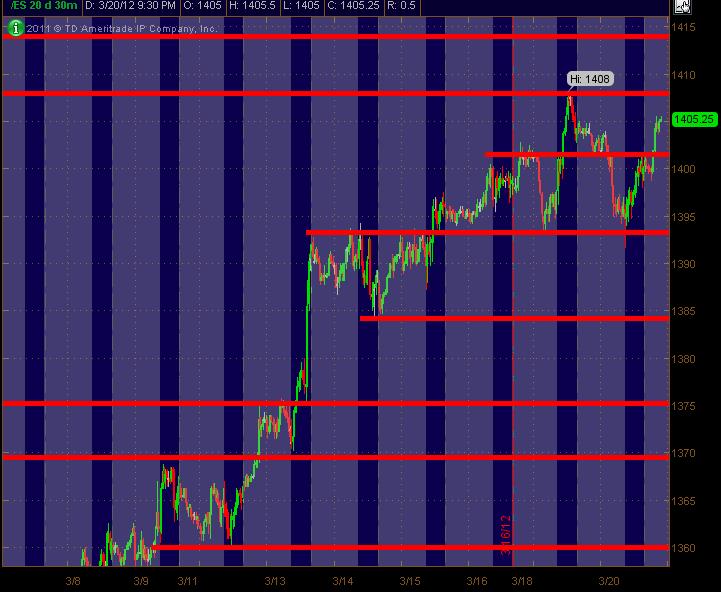
Notice anything interesting? They're the freaking same price levels except for one they "killed off" on the initial/left chart ... it wasn't a good line to begin with. So, ya can pay for this stuff or do your own ... easy peasy! And now, MY famous high intensity S/R MONKEY ZONES. Btw, they were derived from only the prior S/R levels I visually observed and drew in ... the same as the fee for service (left chart) from a vendor. I'm curious how similar the MONKEY ZONES line up with the vendorama's zones for Wednesday's trading levels. Anyway, hope it's helpful to some as a MAP for trading tomorrow.
These are the official KICK ASS MONKEY ZONES!
I'm MM, and I approve this message.
Click image for original size
I've got the before chart on the left with the after chart on the right. And, I drew Yellow lines across both that shows how much high-end statistical/multi-framed/20-types of analysis hones down the valuable and high-probability UBER ZONES for S/R levels/zones.
Notice anything interesting? They're the freaking same price levels except for one they "killed off" on the initial/left chart ... it wasn't a good line to begin with. So, ya can pay for this stuff or do your own ... easy peasy! And now, MY famous high intensity S/R MONKEY ZONES. Btw, they were derived from only the prior S/R levels I visually observed and drew in ... the same as the fee for service (left chart) from a vendor. I'm curious how similar the MONKEY ZONES line up with the vendorama's zones for Wednesday's trading levels. Anyway, hope it's helpful to some as a MAP for trading tomorrow.
Click image for original size
These are the official KICK ASS MONKEY ZONES!
I'm MM, and I approve this message.
Here’s some more info/educational/tutorial-type stuff to be your own S/R ZONE service!
http://www.mypivots.com/dictionary/definition/464/pasr
http://www.mypivots.com/board/topic/7277/1/es-thursday-2-23-2012
This should look familiar … was the same charting from months back on another promo from the same vendor.
http://www.mypivots.com/site/uf/20732/sr-trading-scam-services.doc
http://www.mypivots.com/dictionary/definition/464/pasr
http://www.mypivots.com/board/topic/7277/1/es-thursday-2-23-2012
This should look familiar … was the same charting from months back on another promo from the same vendor.
http://www.mypivots.com/site/uf/20732/sr-trading-scam-services.doc
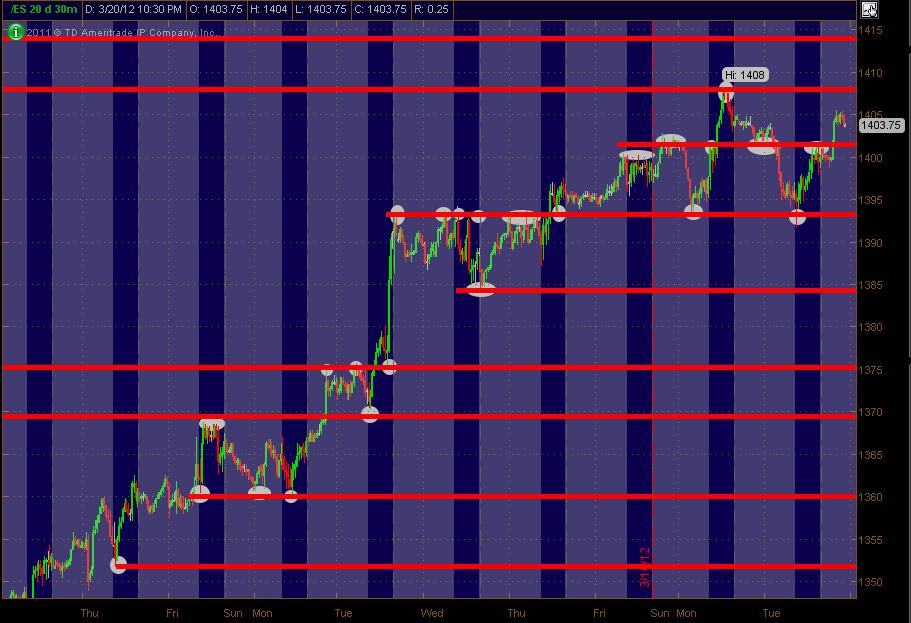
Btw, here's the White Circles/Ovals on past price action on the ES 30 min chart that I saw to create the Red Lines on the above MONKEY ZONES chart above fwiw. Maybe this also helps.
Hope all bank some tomorrow!!!
Click image for original size
Hope all bank some tomorrow!!!
so useful Monkey that I had to vote them all up !
MM Great job.
I also have found that S/R hits just about all the "right" levels including those of Market Profile. After all, the other levels are based off price action and resifted into another format which may be easier to see for some and not others.
I also have found that S/R hits just about all the "right" levels including those of Market Profile. After all, the other levels are based off price action and resifted into another format which may be easier to see for some and not others.
damn Jing is acting up..had a cool tool to share but will have to wait...looking to buy into 98 area to target 1400 and up into low volume node of 1402..
low volume at 98.25 and pivot is 97.50...so will take multiple tries down here....
low volume at 98.25 and pivot is 97.50...so will take multiple tries down here....
second try on longs from 96.75 to reach 1402....harder as we already tested the 1402 low volume
this will not be good if we fail at both the LVN 's at 1402 and at 1398.25 and then make new lows...that means that Logically they rejected both areas..
how my brain works video.....demonstrates a useful tool and some context to go with the great stuff MM posted.
thanks bruce!
How 'bout them MONKEY ZONES today!?! Some day's they're more effective than others ... but it's all about that confluence thingy as a trader folds it into their own analysis and strategery.
So, ya ain't gotta pay for a service. Ya can do 'em yourself.
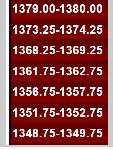
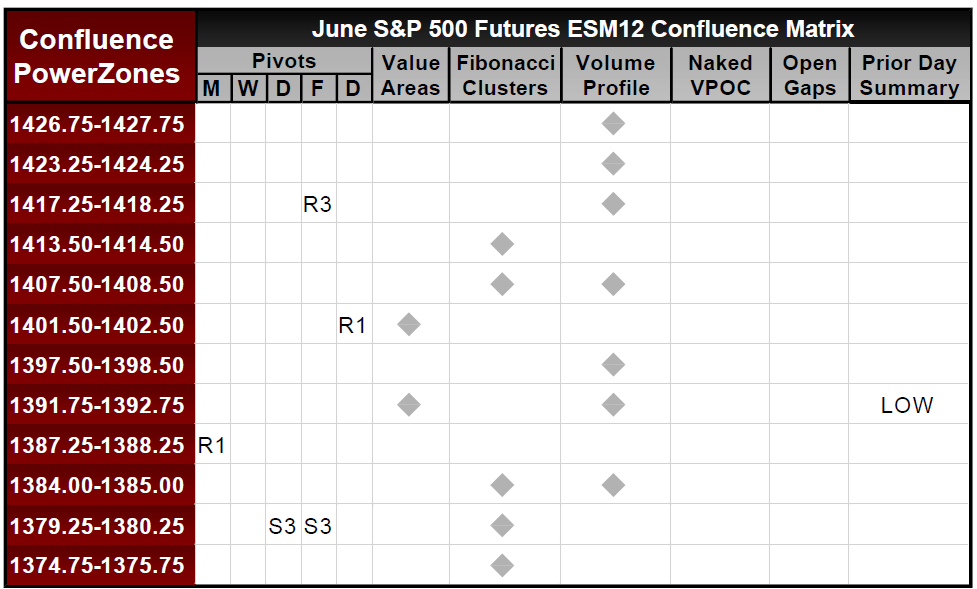
Btw, Khamore1 has posted some levels from a fee-for-service that looked like this:
If you've got the levels for today's (Wednesday's) trading, could you post 'em? It'd be interesting to see how they line up with what I posted and anyone else could create on their own as per my first few educational-type posts on the thread today.
And as Big Mike alluded to ... these are often (not always, but typically) Low Volume areas or nodes using Volume Profile.
Anyway, just trying to help out ... simple as that!
MM
So, ya ain't gotta pay for a service. Ya can do 'em yourself.
Btw, Khamore1 has posted some levels from a fee-for-service that looked like this:
Click image for original size
If you've got the levels for today's (Wednesday's) trading, could you post 'em? It'd be interesting to see how they line up with what I posted and anyone else could create on their own as per my first few educational-type posts on the thread today.
And as Big Mike alluded to ... these are often (not always, but typically) Low Volume areas or nodes using Volume Profile.
Anyway, just trying to help out ... simple as that!
MM
Click image for original size
Emini Day Trading /
Daily Notes /
Forecast /
Economic Events /
Search /
Terms and Conditions /
Disclaimer /
Books /
Online Books /
Site Map /
Contact /
Privacy Policy /
Links /
About /
Day Trading Forum /
Investment Calculators /
Pivot Point Calculator /
Market Profile Generator /
Fibonacci Calculator /
Mailing List /
Advertise Here /
Articles /
Financial Terms /
Brokers /
Software /
Holidays /
Stock Split Calendar /
Mortgage Calculator /
Donate
Copyright © 2004-2023, MyPivots. All rights reserved.
Copyright © 2004-2023, MyPivots. All rights reserved.