ES Thursday 9-27-12
some level I'm watching..on video I say R2 when referring to S2...also didn't mention that the weekly IB is 12 points ..that is the range of Monday and Tuesday combined..so if you subtract 12 points from tuesdays lows you get 1423 !! look where are low so far is for the week...so half of that range is 6 points...so we can add and subtract 6 points from Tuesdays lows to see if we get any confluence..
rounding I get 6 points off of the 1434 ( I'm splitting the weekly IB)low of tuesday///so ::
1440 - Near single prints and yesterdays O/N highs
1428 - ( right near our 1427 number)
u get the idea
we doubled weekly IB by Wednesdays trade....that seems too fast...so I don't expect that current weekly low to be broken really quick
95 % of the time the market will take out the overnight high or low sometime the next day..we never really know WHEN..us sellers are watching that poc from the overnight and todays open at 1333.50 carefully because if we get it right we will get runners down to the O/N low, gap close and closing VPOC and our 27 number from yesterday
lots of conflict in here so I don't suggest trying to hold many contracts ..this market has such tight range that in the past we could expect 2 -3 point reaction points but now it is one 1/2 of that...DIFFICULT !
lots of conflict in here so I don't suggest trying to hold many contracts ..this market has such tight range that in the past we could expect 2 -3 point reaction points but now it is one 1/2 of that...DIFFICULT !
my plan is to try and hold for 1428 and get out ahead of all that other stuff....sellers have tried to enter from 1432 exactly so on new lows we need to hope that those folks have some power ..otherwise they will come back to that volume at 1432 again
one alternative play for later or WHENEVER it comes is to watch 1434.75......we will either get a nice short trade there or they will blow through and volume will dry up as price moves up and they will drop back down to test that number..so u need to watch your entry signals for those two scenarios
volume now building in the center of the IB so this offers no predictive value for the breakout of the IB range
this 1432 is POWERFUL today
volume now building in the center of the IB so this offers no predictive value for the breakout of the IB range
this 1432 is POWERFUL today
the last three 15 minute periods has volume tapering off which certainly doesn't imply any strong trend and it seems that 1432 is the current magnet..watching the IB high and that 1434.75 closely !!
any additional fades up here will have to use 1432 as a target first unless we get the dramatic blow through of the 1434.75
any additional fades up here will have to use 1432 as a target first unless we get the dramatic blow through of the 1434.75
missed my entry at 33.50 but am looking again...target as said is that 32 but it's no good if you don't enter ....LOL!!
Plan still in place but we can't be sure they are done with that 1432....big volume sellers joined us at 1432.50 but there were buyers that came in at 30.50 earlier..now it just come down to luck as to see who really is stronger...we need that hour low to break and they have price stay below 30.50 after that break in order to get to our 1428 target...
damn this is tuff today
damn this is tuff today
Click image for original size
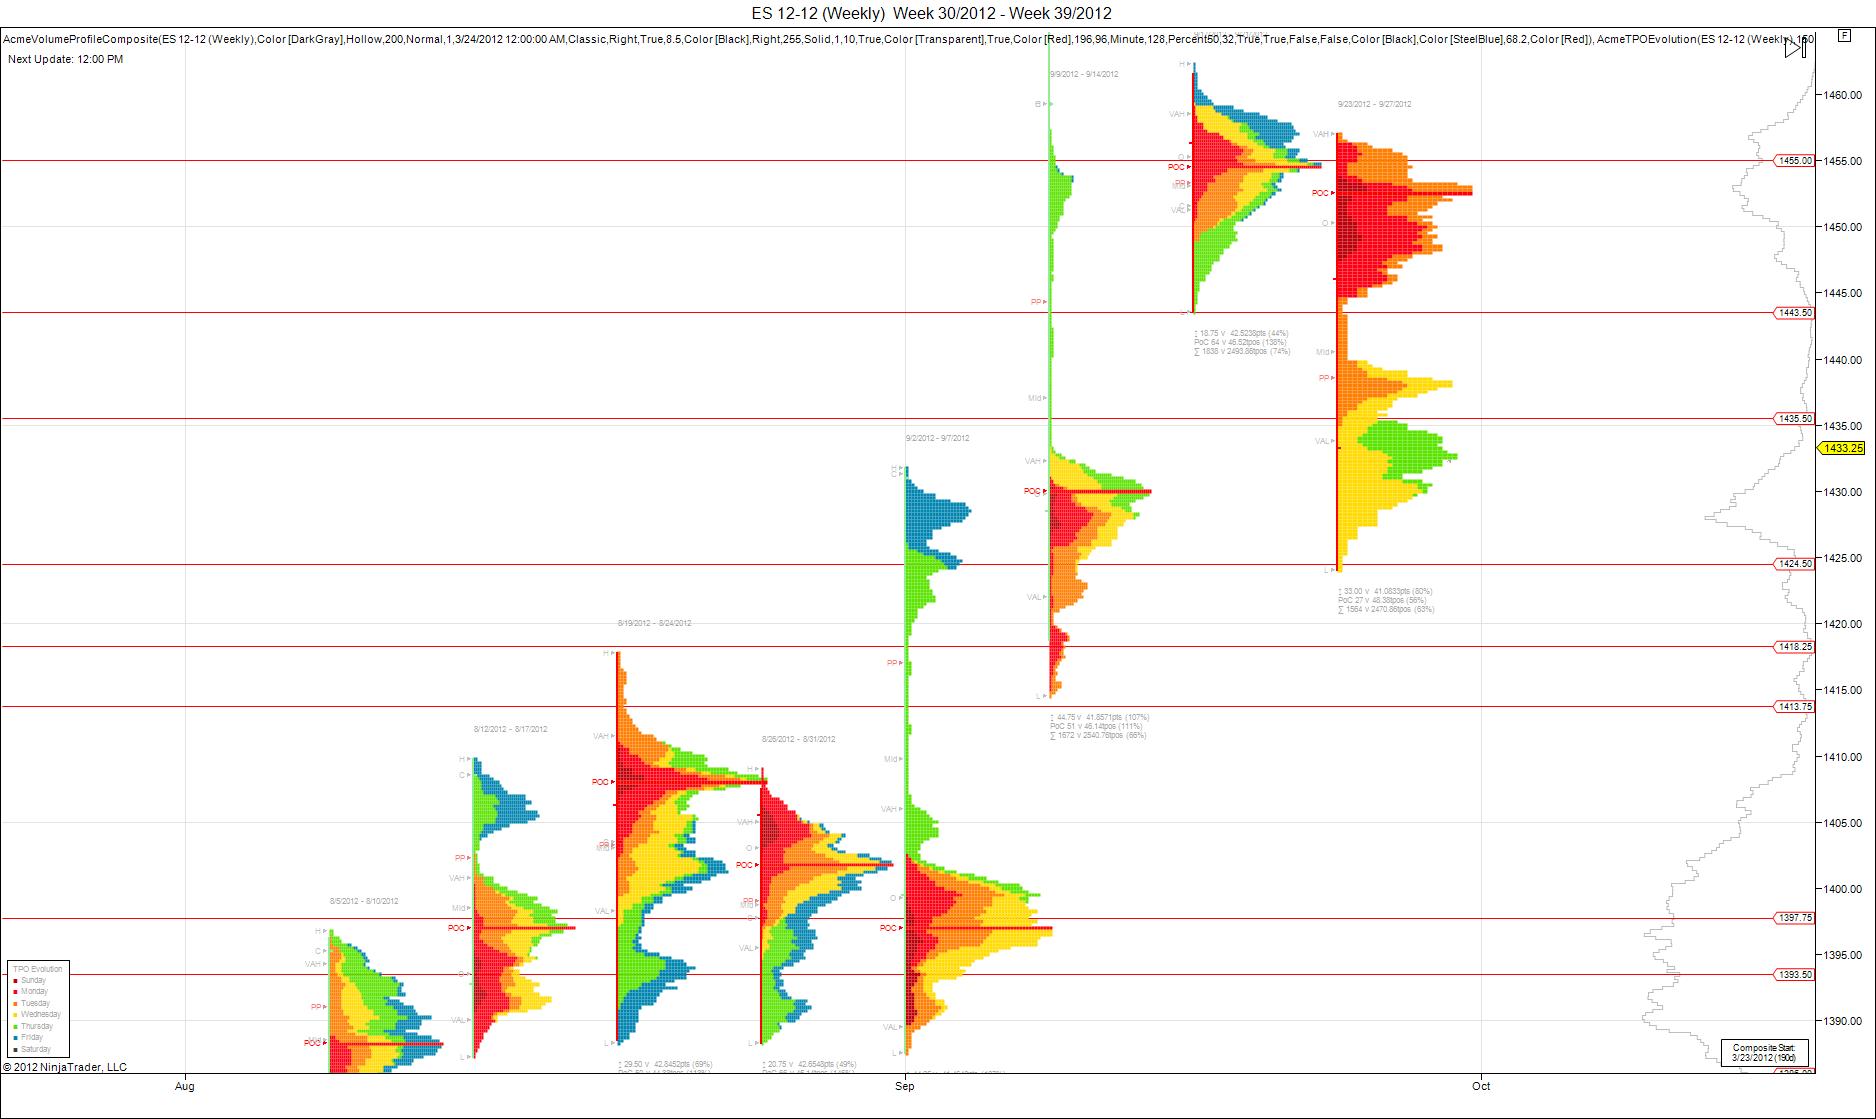
This is a weekly TPO chart by day of the week. This is time only with Volume profile on far right. Notice gap in time between 1435.50 ]and 1443.50. Also, LVN's in that zone. My thinking is sooner or later the market will fill in this gap of time and price and form a bell curve in that area. I guess time will tell.. Ha Ha
Not a trade recommendation, trade your own method.
Notice that the market just reacted of the "D" time frame (11:00am-11:30am EST)on a 30 min TPO chart again today and went higher..I don't know coincidence or pattern?
My first signals are coming off the 1438.75 volume...if the theory is to hold true they should come back for 1434.75..this is always tuff because not only are we wrong sometimes but we are wrong in a public forum which seems to make it worse somedays..
it is what it is....will take multiple tries up here
it is what it is....will take multiple tries up here
first target and possible support will be the 1436.50...will try these trades up into 1441 but will only try 3 times maximum...this is the first try!
thank you both
Emini Day Trading /
Daily Notes /
Forecast /
Economic Events /
Search /
Terms and Conditions /
Disclaimer /
Books /
Online Books /
Site Map /
Contact /
Privacy Policy /
Links /
About /
Day Trading Forum /
Investment Calculators /
Pivot Point Calculator /
Market Profile Generator /
Fibonacci Calculator /
Mailing List /
Advertise Here /
Articles /
Financial Terms /
Brokers /
Software /
Holidays /
Stock Split Calendar /
Mortgage Calculator /
Donate
Copyright © 2004-2023, MyPivots. All rights reserved.
Copyright © 2004-2023, MyPivots. All rights reserved.