ES Tuesday 2-11-14
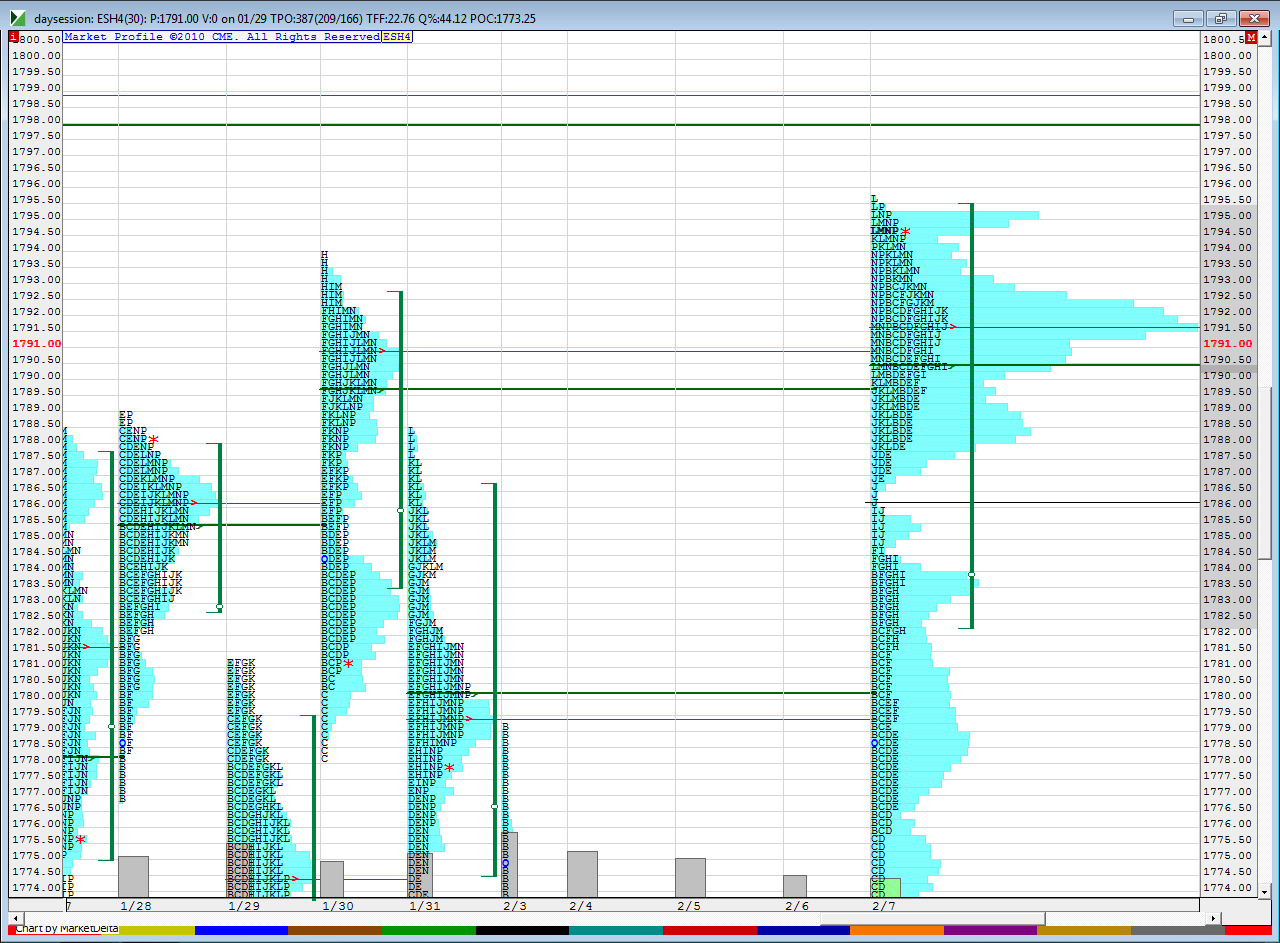
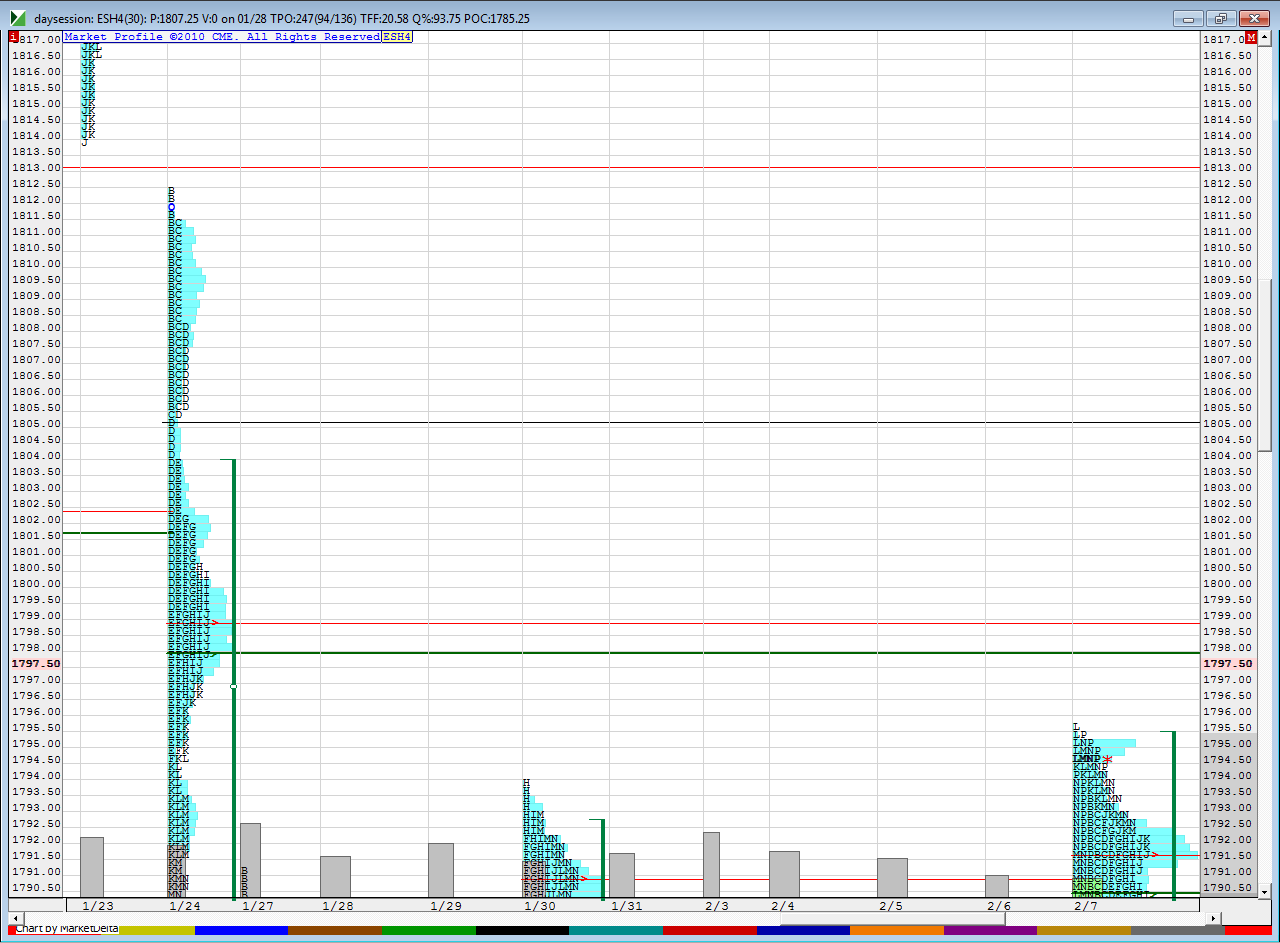
Yesterday had most of its range inside to friday and it was a lower volume day, so I combined the two days to make a nice symetric bell curve...note the LVn at 86 ...that is a single print area and part of the "Complex " area I mentioned yesterday.
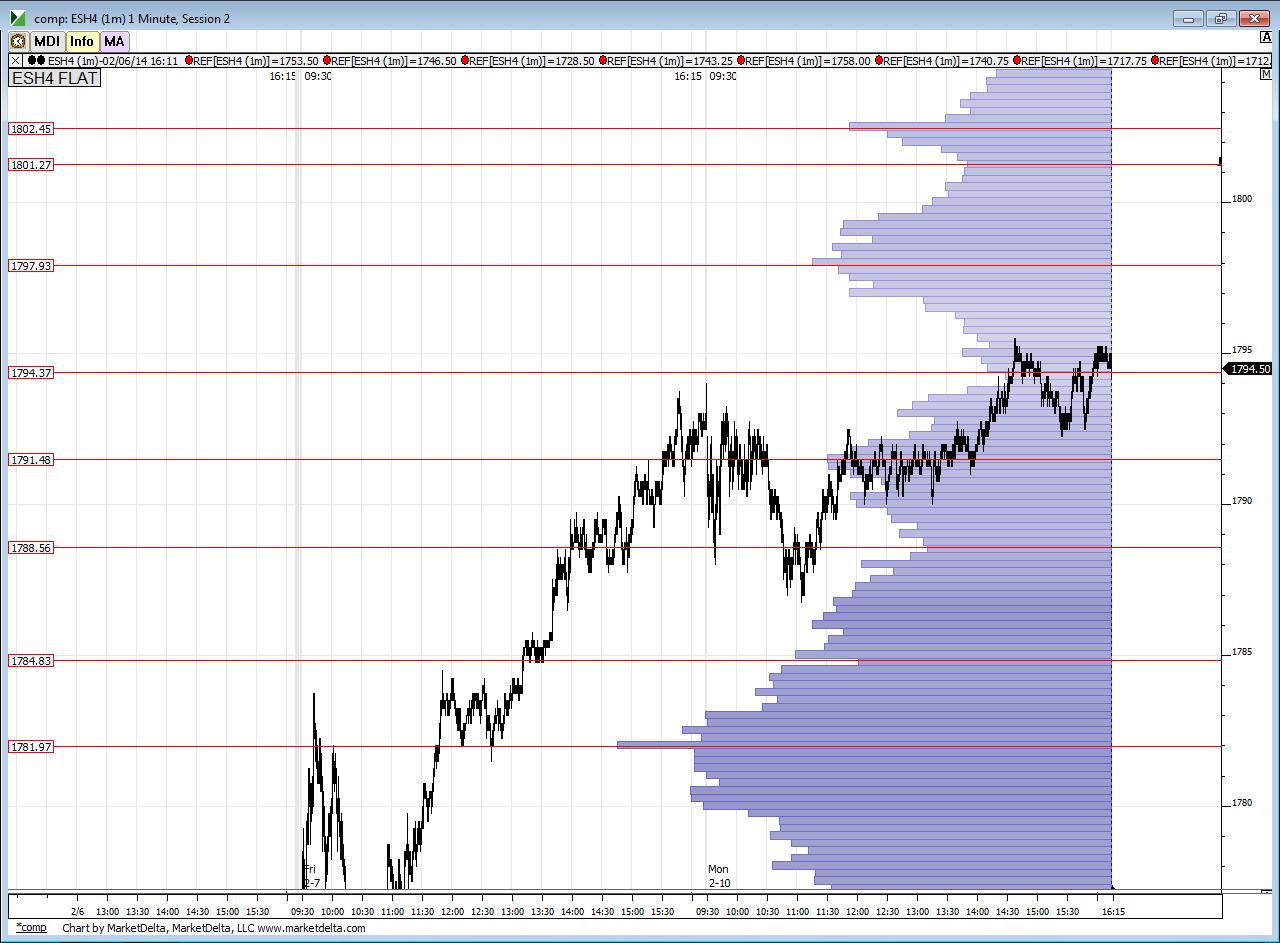
next we have the one minute composite ..this is good for an overall view but I still prefer to use day to day area
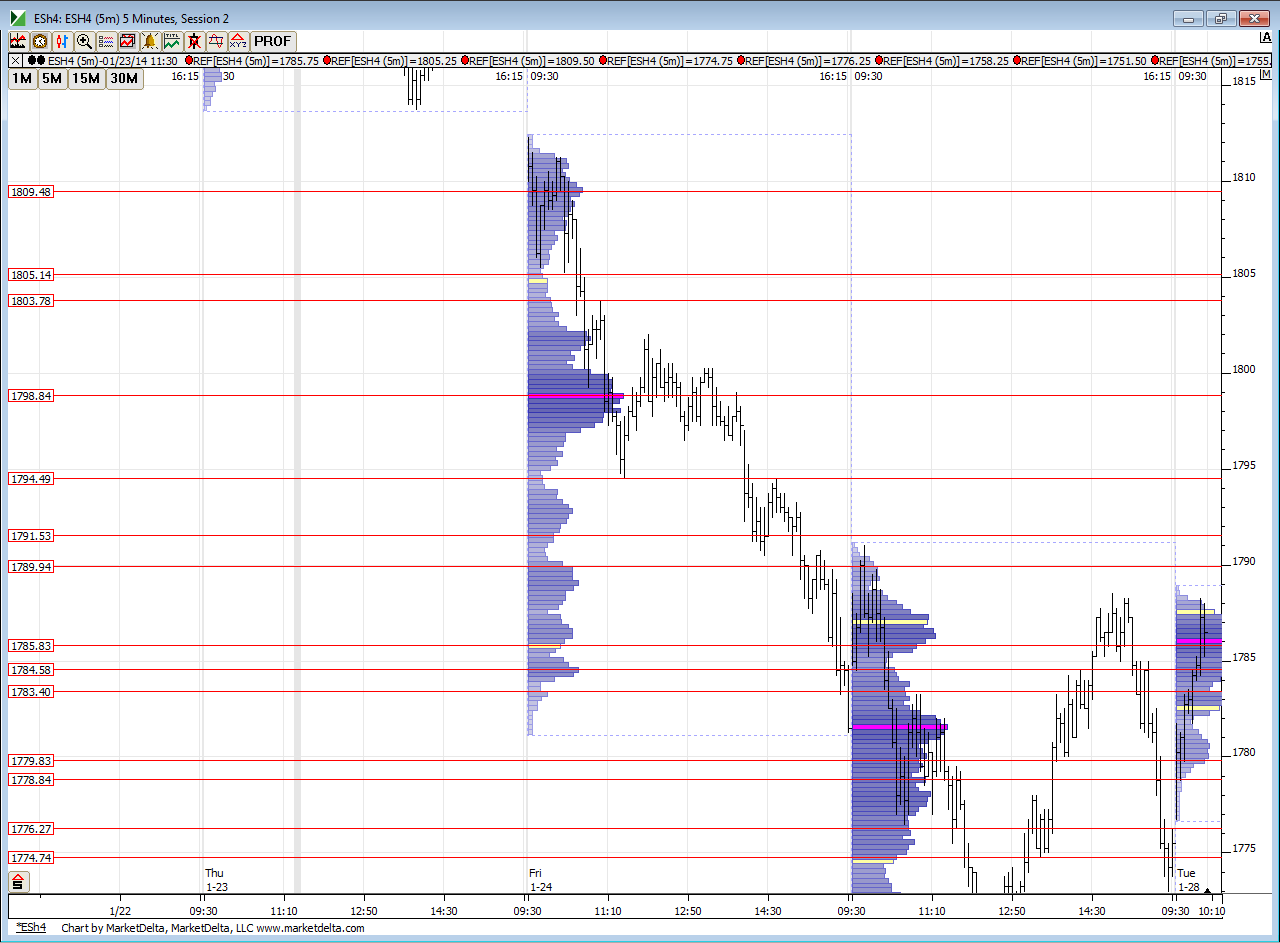
next we have a close up of what happened on Friday 1-24-14 because we rallied up here in the O/N session
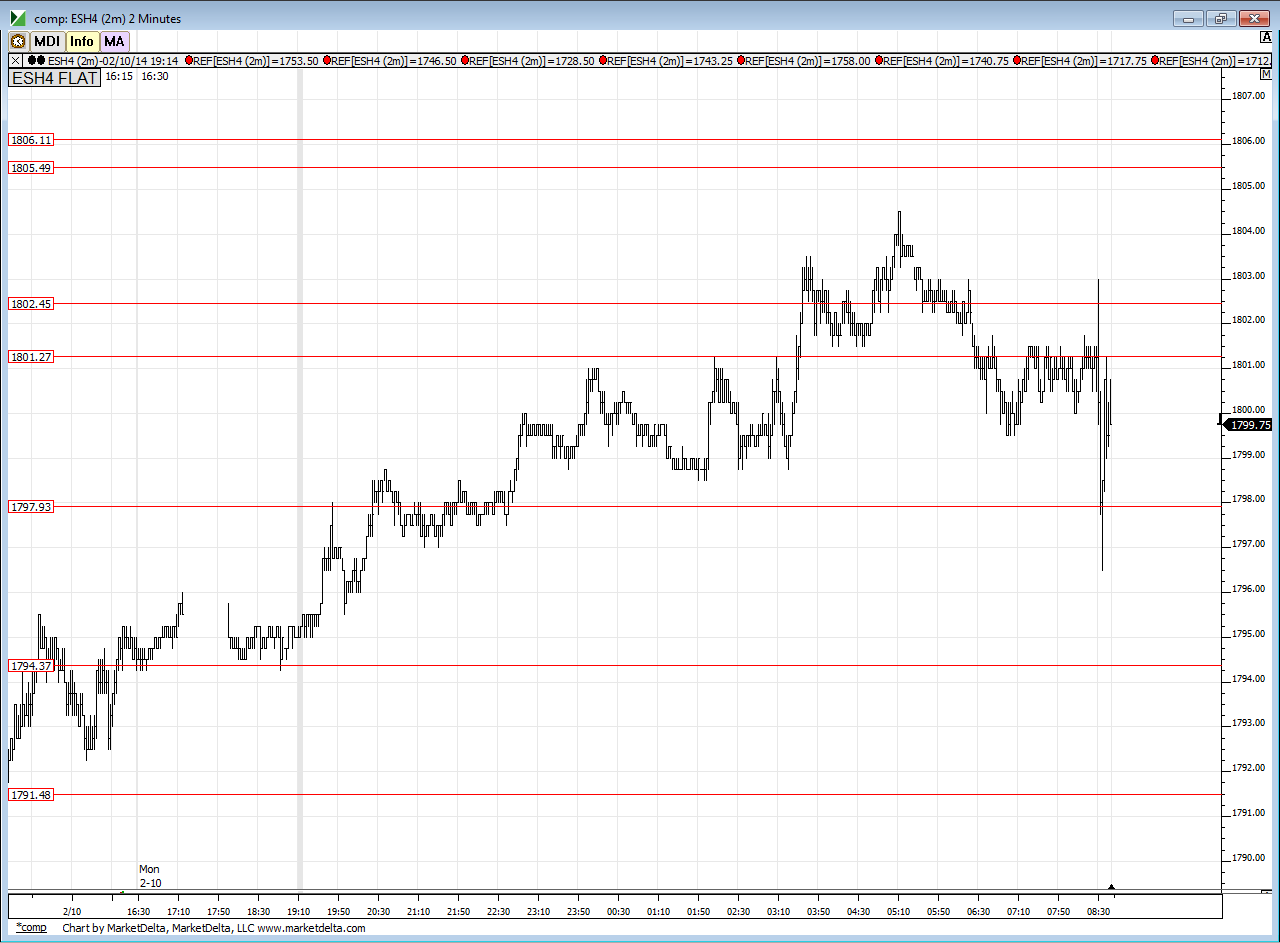
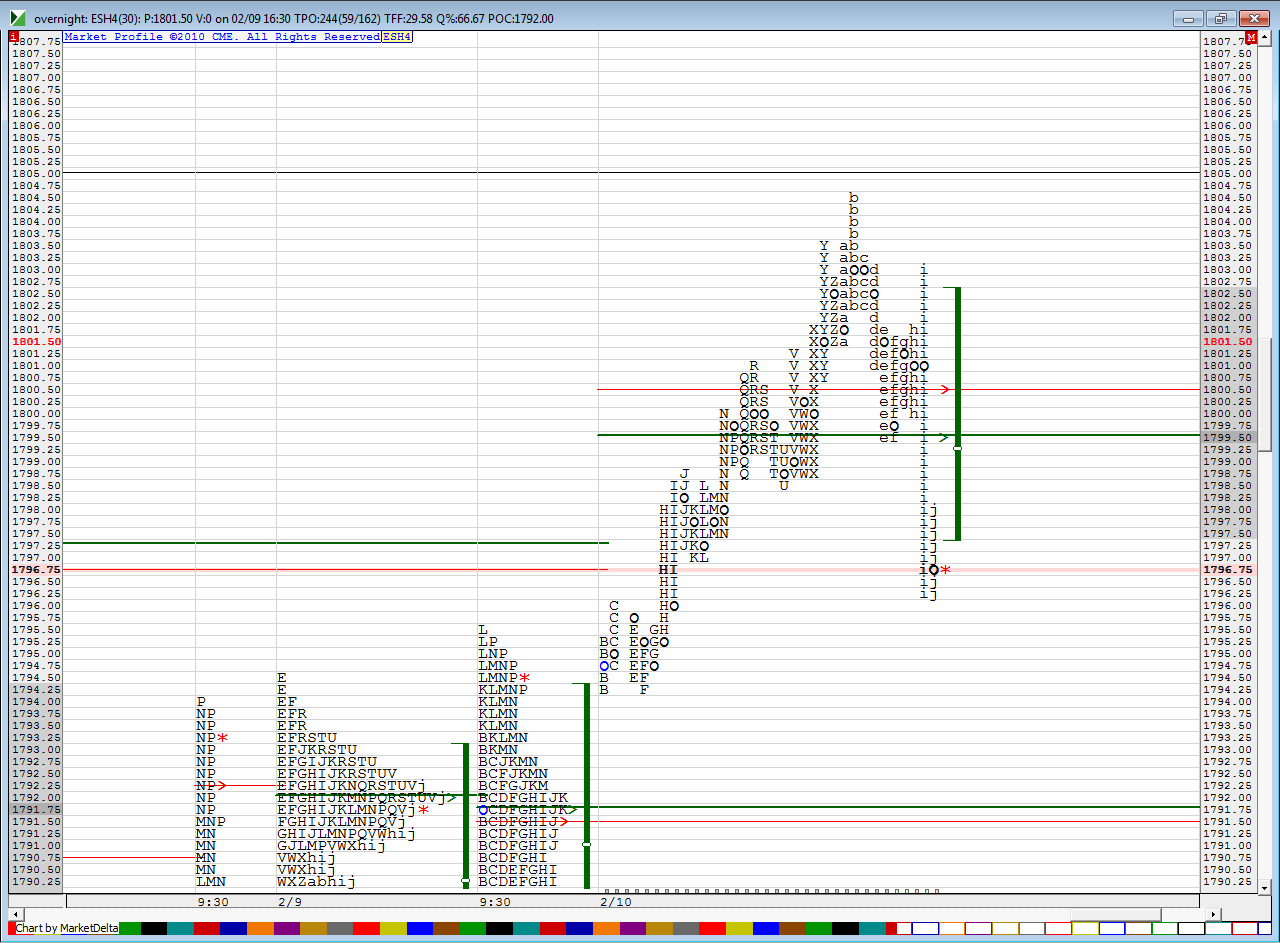
and finally we have the composite chart with the overnight data on it...as I type we can see that the 1801-1802 area ( there is a previous O/N session high there too) and the 97 - 98 will be our keys area. so far......this chart doesn't show it but the O/N high stopped right in our zone from the 1-24-14 chart above....
.
I will be watching what happens at the 97 - 98.....as that is the bulk of volume from 1-24....holding that would target in the overnight high where the single prints are and VA high is from 1-24...failure in there will probably run it back to the center of our bell curve below in the 91- 92 area with a few bumps along the way....here is Friday 1-24...you can see on the very left side that the 1801 - 1802 is an old POC/VPOC......I'm not crsytal clear on that particular area yet but the O/N has played off it...and above you can see the VA high and single prints in the 04 - 05 area..so this will all be about which side of the 1-24 bell curve we open on and then to see if the center of that becomes support or resistance...if we have low volume today then we should mean revert
Click image for original size
next we have the one minute composite ..this is good for an overall view but I still prefer to use day to day area
Click image for original size
next we have a close up of what happened on Friday 1-24-14 because we rallied up here in the O/N session
Click image for original size
and finally we have the composite chart with the overnight data on it...as I type we can see that the 1801-1802 area ( there is a previous O/N session high there too) and the 97 - 98 will be our keys area. so far......this chart doesn't show it but the O/N high stopped right in our zone from the 1-24-14 chart above....
.
Click image for original size
I will be watching what happens at the 97 - 98.....as that is the bulk of volume from 1-24....holding that would target in the overnight high where the single prints are and VA high is from 1-24...failure in there will probably run it back to the center of our bell curve below in the 91- 92 area with a few bumps along the way....here is Friday 1-24...you can see on the very left side that the 1801 - 1802 is an old POC/VPOC......I'm not crsytal clear on that particular area yet but the O/N has played off it...and above you can see the VA high and single prints in the 04 - 05 area..so this will all be about which side of the 1-24 bell curve we open on and then to see if the center of that becomes support or resistance...if we have low volume today then we should mean revert
Click image for original size
well we had a sell off since I posted all those charts...current On vpoc is at 1800.5 ( red line)so that is close enough to confirm the 1801 area...here is On as I type
so far it seems that they will want to drive back to the 91 - 92 area but I'm waiting till day session opens...best idea will be to try sells off the 1801 ( use 97 - 98 as a target)and if we open low enough the 97 - 98 zone.. to use the 95 and O/N low as a first target
so concludes today's over abundance of charts
Click image for original size
so far it seems that they will want to drive back to the 91 - 92 area but I'm waiting till day session opens...best idea will be to try sells off the 1801 ( use 97 - 98 as a target)and if we open low enough the 97 - 98 zone.. to use the 95 and O/N low as a first target
so concludes today's over abundance of charts
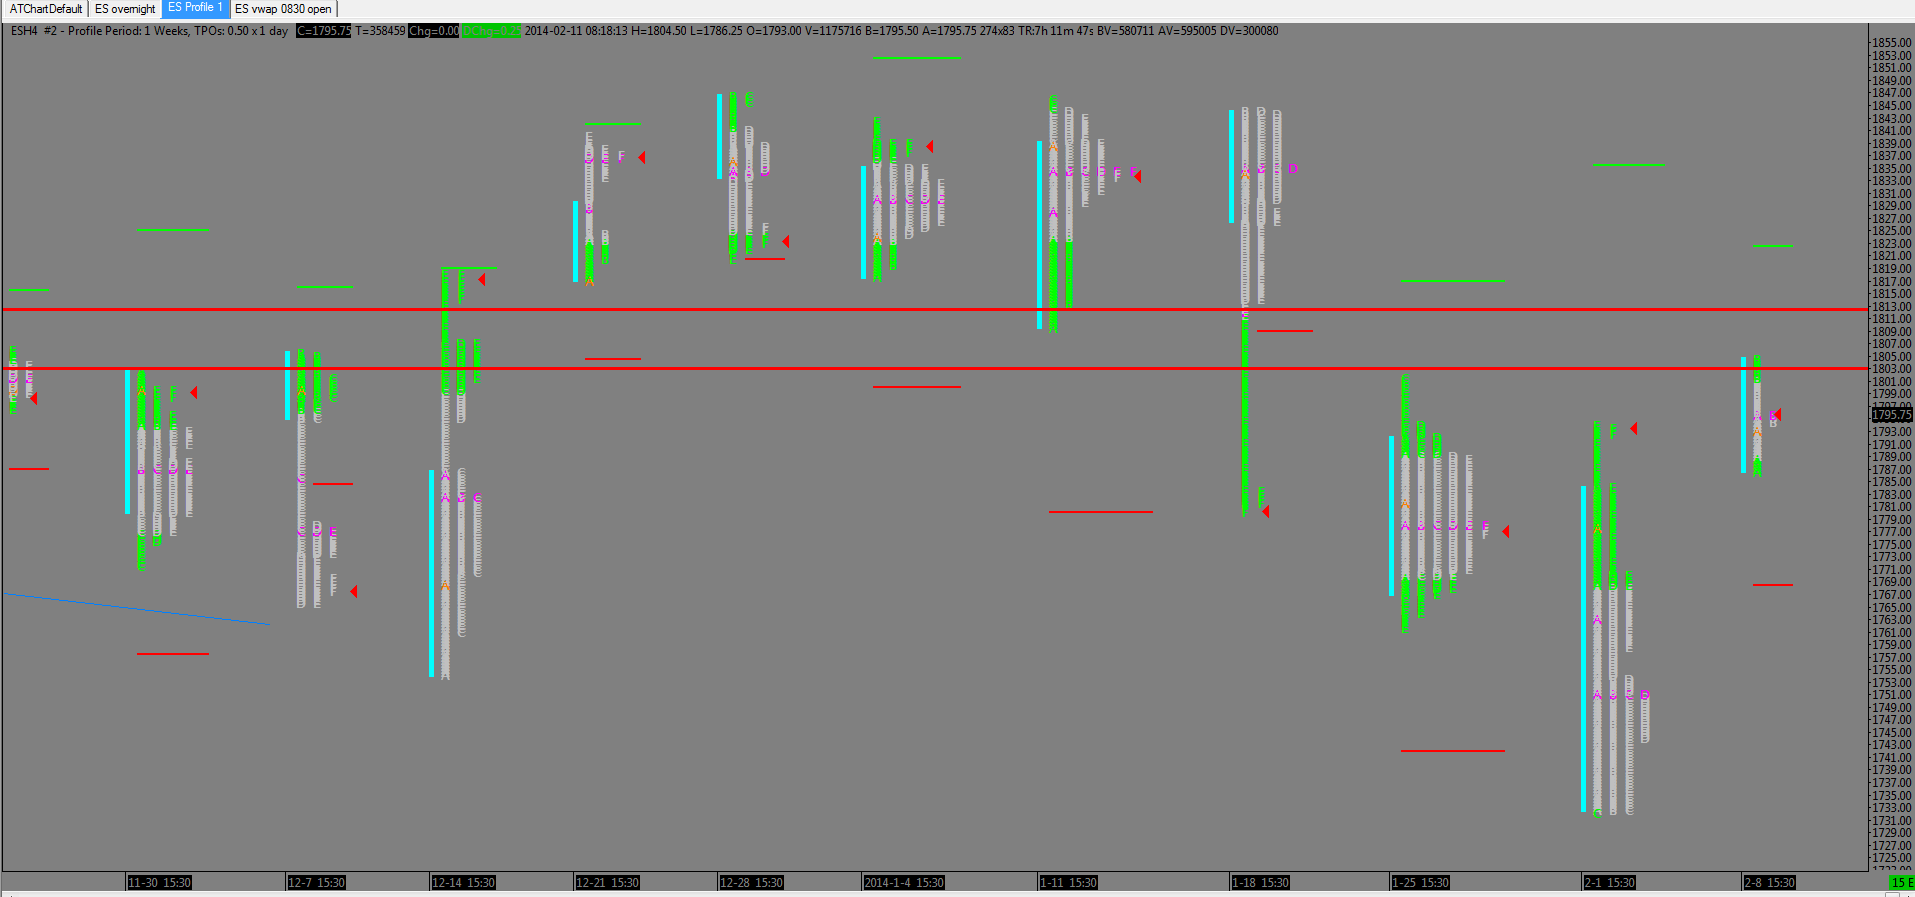
Nice work Bruce. I recall watching that 1803 level when we were trading above it. Here is a weekly profile chart for the March contract. The parallel red lines define an area that "could use some work" IMHO, however the bottom of that zine is right about 1803. I think that area may prove critical if we get back up to it.
Click image for original size
my plan is to sell into this 98 and I will also try the 1801 sells....not adding on..separate trade ideas for me
overnight low goes well with YD VA high and close....but don't wantto get blind sided...the 97 - 98 is a tuff area and we haven't hit O/N midpoint yet
short 98.50 now...we'll see
first loser..selling the 1801.75 now and will target 99
coming out heavy at 99 due to first loser...so I want to make more back faster when first trade is a loser...and we also know that we have that big bulk of volume at the 97 - 98.....gonna try to hold last two a bit longer and wider and try to get overnight low.......knowing that this 97 - 98 may be a real pain
making one target 95.75...not the O/N low...if runners are lucky...may need to sit through lots of crap
Looks like your patience paid off on that one, especially across the top of the hour. Hope it continues for you
so this will basically just come down to one simple thing and that is this.......will the bell curve center from 1-24 become support to push out O/N highs of will they be able to crack it and get the O/N lows ??
I think a good failure up here will get us back to 05.50.....that is single print they blew through and all sellers got trapped.....out of my preferred time zone but good luck and catch up with ya tomorrow...
glad to hear it helps somewhat radyk
glad to hear it helps somewhat radyk
Emini Day Trading /
Daily Notes /
Forecast /
Economic Events /
Search /
Terms and Conditions /
Disclaimer /
Books /
Online Books /
Site Map /
Contact /
Privacy Policy /
Links /
About /
Day Trading Forum /
Investment Calculators /
Pivot Point Calculator /
Market Profile Generator /
Fibonacci Calculator /
Mailing List /
Advertise Here /
Articles /
Financial Terms /
Brokers /
Software /
Holidays /
Stock Split Calendar /
Mortgage Calculator /
Donate
Copyright © 2004-2023, MyPivots. All rights reserved.
Copyright © 2004-2023, MyPivots. All rights reserved.