ES Friday 6-27-14
a video and the weekly chart..I snapped lines at the critical support point today that needs to hold if bullish seasonals are going to work..
Click image for original size
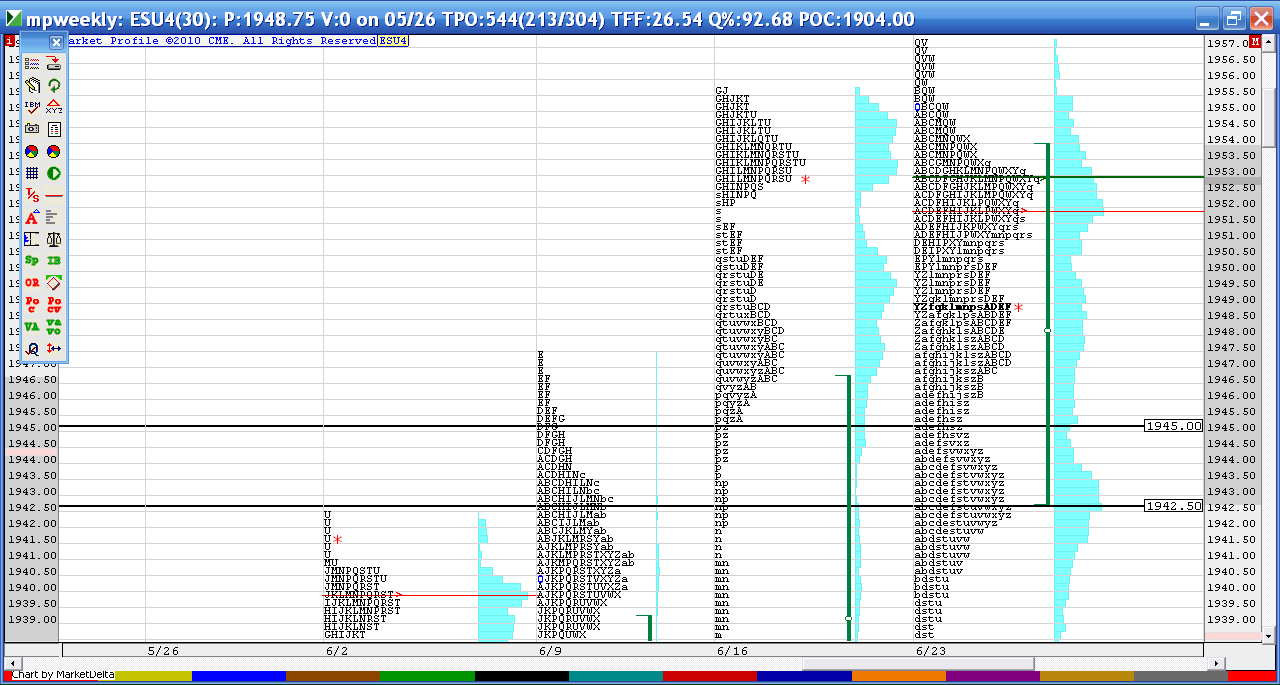
in the center of the chart you are looking at yesterdays high and how it stopped right at the vpoc from Wednesdays afternoon selling tail....these are all 30 minute bars...just day session with VPOC's on each 30 minute bar....let me know if that helps...this can help me see where volume may be building up
Originally posted by Aladdin
Thanks Bruce.
Could you please explain what I am looking at in your chart?
http://www.sierrachart.com/image.php?l=1403882905750.png
that is the trendline i am watching...once that breaks significantly i am out of this long...we now have rth vwap and mi at 47.5 and vpoc at 47.75 so much below that and sayonara to the long
that is the trendline i am watching...once that breaks significantly i am out of this long...we now have rth vwap and mi at 47.5 and vpoc at 47.75 so much below that and sayonara to the long
Yes, I can see it now.
Thanks for explaining, Bruce.
Thanks for explaining, Bruce.
1950.00 was the overnight High... Don't you consider that a natural spot for some sort of a retracement on first test?
I'm just asking, not implying anything...
I do not like Mondays or Fridays in the summertime it gets awfully thin.
Also, just an observation (that can easily be wrong)... If you look at yesterday's Profile, there is an OK, pretty good looking selling tail 50.25 to 51.50...
I have been trying to understand when a selling (or buying) tail is strong and can reject price on a first test that only manages to just print at the closest part of the tail (not wiping it out) ... the selling tail that is in place right now (from yesterday), has a couple of things I am starting to try to observe... Tail has more than 3 TPOs and a well defined area at it's edge... Having some sort of other measure defining the return to the normal profile (Helping define the end of the Tail seems to be important... like a buying tail singles that end (on the way up) coinciding with the VAH of the day, I am only eyeballing charts, but it seems to me there has to be some tails that are strong and some that are weak... The description I gave is sort of based on Bruce's own comment a couple of days ago that when price breaks out of an IB, he likes to see singles on the move...
yeah apk..I'm not digging this too much myself...we are building value higher and one time framing but I never like when they can come back to things like value area highs so often and hold things like daily pivots and push so easy back under the IB high....the bigger context looks ok but trying to hold something is rather ridiculous in this slow summer trade...this requires patience and the ability to LOOK AWAY from the charts and not follow every squiggle that happens...much different then the first hour of trade although that wasn't setting the world on fire either.......that current high on my mp charts matches the overnight and that ledge from yesterday...even if my MP charts are a tic off it still is not a very strong high...
Originally posted by apk781
yeah, i took taht break as well and i am not liking it one bit...still playing inside that big hvn/bell curev from yest...the pace is awful and we are coming into lunch hour on a friday in the summer...what could be worse? lol
i took the long at the open since we held that 43-44.75 area i mentioned in my post and took a couple of points to 47.75 (i had that 47.75-50 area i mentioned as well)...tried the short there back down to that big lvn and should have called it a day but here i am stuck with this long...i think if they break this 50 they will go for taht 52.5-53.5 area so will hold for that or whenever we trade significantly below the trend line that connects 42.75 and 45
Originally posted by BruceM
i have an average in price of 48.50 and I'm only trying for 1950 ledge break.....gheesh.....very unusual that my best trade came in the O/N session so far...stop point now is near 47...so this is an even steven risk to reward...not a great trade at all..
whoops, in that example...I meant VAL...
like a buying tail singles that end (on the way up) coinciding with the VAL (not VAH) of the day, I am only eyeballing charts,
like a buying tail singles that end (on the way up) coinciding with the VAL (not VAH) of the day, I am only eyeballing charts,
a video for some who may be new and want to see what ledges look like etc and my failed RTH short trade earlier
the short answer is YES Paul....and normally I like to see those tests done as early in the day as possible....the more info that drips into the market the more confusing it can become and I think it gives players more time to build up a position if that is their plan...so yes I do expect some kind of reaction when we get there but for me I can also get blinded by obvious areas that I think will get run out......like those multiple highs at a key number of 1950 etc ...it's classic stuff between buyers and sellers opinions......It took us 90 minutes to reach that O/N high ...so that is a long time in my world and time from somebody to build up long inventory perhaps...
I'm not saying I will be right, I am only sharing what runs through my brain ....I always like the tests sooner than later...
I'm not saying I will be right, I am only sharing what runs through my brain ....I always like the tests sooner than later...
Originally posted by PAUL9
1950.00 was the overnight High... Don't you consider that a natural spot for some sort of a retracement on first test?
I'm just asking, not implying anything...
I do not like Mondays or Fridays in the summertime it gets awfully thin.
Also, just an observation (that can easily be wrong)... If you look at yesterday's Profile, there is an OK, pretty good looking selling tail 50.25 to 51.50...
I have been trying to understand when a selling (or buying) tail is strong and can reject price on a first test that only manages to just print at the closest part of the tail (not wiping it out) ... the selling tail that is in place right now (from yesterday), has a couple of things I am starting to try to observe... Tail has more than 3 TPOs and a well defined area at it's edge... Having some sort of other measure defining the return to the normal profile (Helping define the end of the Tail seems to be important... like a buying tail singles that end (on the way up) coinciding with the VAH of the day, I am only eyeballing charts, but it seems to me there has to be some tails that are strong and some that are weak... The description I gave is sort of based on Bruce's own comment a couple of days ago that when price breaks out of an IB, he likes to see singles on the move...
thanks for the video...
I'm done... I hate Fridays in the summertime more than I dislike Mondays.
good luck to all
I'm done... I hate Fridays in the summertime more than I dislike Mondays.
good luck to all
Originally posted by BruceM
...the bigger context looks ok but trying to hold something is rather ridiculous in this slow summer trade...this requires patience and the ability to LOOK AWAY from the charts and not follow every squiggle that happens...
I agree, I will now LOOK AWAY and let the market do its thing...
(I have a long working from 1946.00)
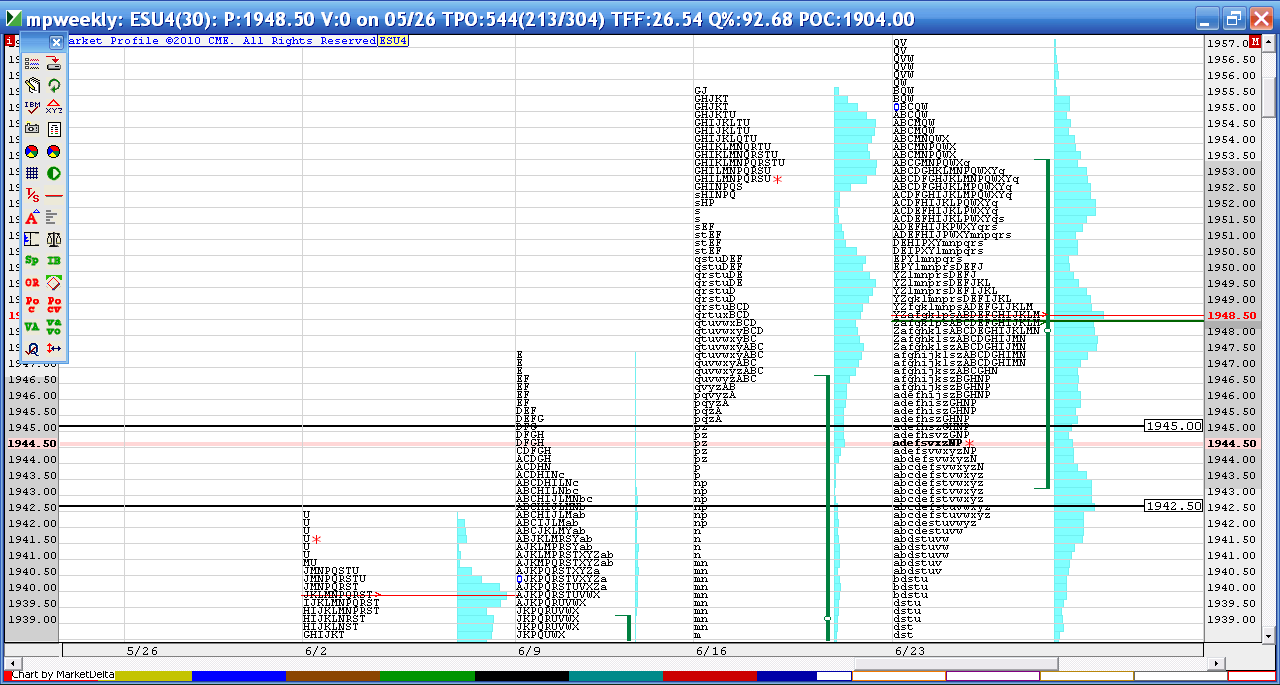
my last post today is this...u can compare the weekly posted this morning to this current one,,,,,note the poc/vpoc flip lower...so in theory traders agree on lower prices.....we are currently in the key support zone - the black lines at 42.50 - 45.....so do we ping pong between the support zone and the poc at 48.50..? red asterisk is current trade price....it will be fun to see how we end up today.......on Monday I will most likely following the concept of Friday strength or weakness spills over into monday....thanks for all who posted today and gave feedback...
Click image for original size
Emini Day Trading /
Daily Notes /
Forecast /
Economic Events /
Search /
Terms and Conditions /
Disclaimer /
Books /
Online Books /
Site Map /
Contact /
Privacy Policy /
Links /
About /
Day Trading Forum /
Investment Calculators /
Pivot Point Calculator /
Market Profile Generator /
Fibonacci Calculator /
Mailing List /
Advertise Here /
Articles /
Financial Terms /
Brokers /
Software /
Holidays /
Stock Split Calendar /
Mortgage Calculator /
Donate
Copyright © 2004-2023, MyPivots. All rights reserved.
Copyright © 2004-2023, MyPivots. All rights reserved.