What happened to BruceM ?
does anyone know anything about him? DT do you have any news of him?
he was such a good trader and educator...i really miss his morning videos/charts
wherever u r hope u r doing great man
he was such a good trader and educator...i really miss his morning videos/charts
wherever u r hope u r doing great man
I find that I can get more information out of a one minute time histogram like the ones I have been posting....It shows the areas of rejection and acceptance through the buildup ( accumulation , big bulk of time - the bell centers) and rejection ( the low time areas, air pockets= rejection).........these seem to simulate volume very well.... I also still keep track of my standard 30 minute value areas and poc's on the daily and the weekly charts as many follow that...for a while I was looking at my Think or swim Value areas that were suppose to be volume but they really aren't .....I question my IB data so I don't put as much faith in the Volume value areas it derives...it really all comes down to price action and these time profiles show/ confirm the price action superbly ................
Originally posted by Aladdin
Thanks Bruce.
I am studying your 1-min chart and I am seeing the low times you mentioned at 1885, 1893 area and 1905.
Am I correct that you only use the volume profile to identify the LVN's?
Or do you also look at the 1-min bars for additional info?
simple today but hard to trade...using 52 as the magnet number to be long above and would like to target 57 - 59.... sellers holding under 52 will target key support at 42 - 44 area....
35 - 37 and 29 - 31 are my next key zones.......odds favor another tpo print up at 1850 before the week is out...perhaps even before today is over so no more shorts for me...I'd rather be buying near the 35 - 37 and the 29 - 31 zone...EDIT : here is how that looks so far....note the VA low from week labeled 1/18
Click image for original size
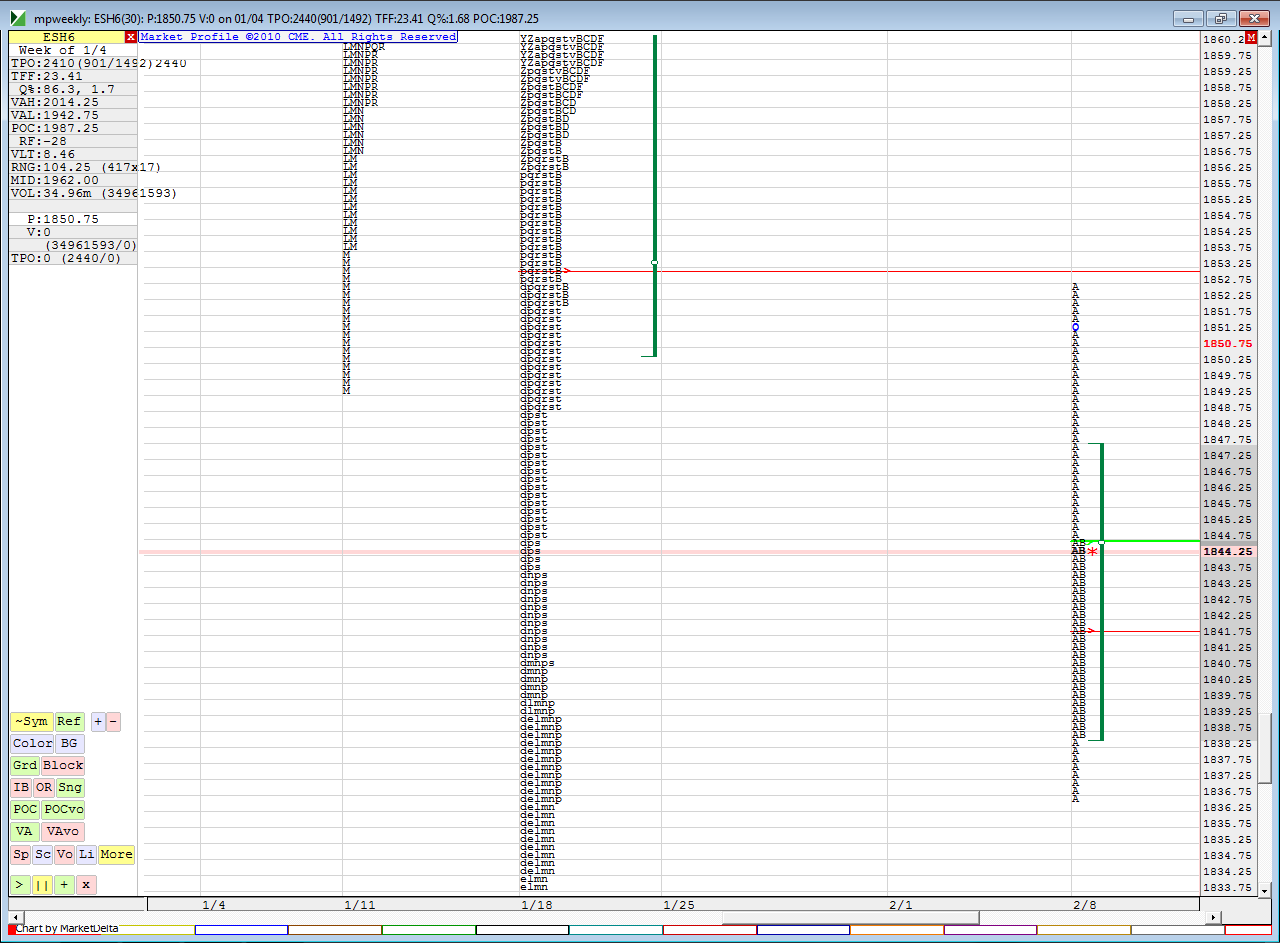
50.25 is a VA low off a weekly bar...only one tpo print so far...it would be unusual to see that get left alone and have a true breakdown off a previous weekly VA...but naturally it is best to just trade off your most current lines and hope for the bigger run on runners only so if you were long off the 36 area then naturally you'd be wathcing the other zone at 42 - 44 and try to take something off there in case in becomes resistance
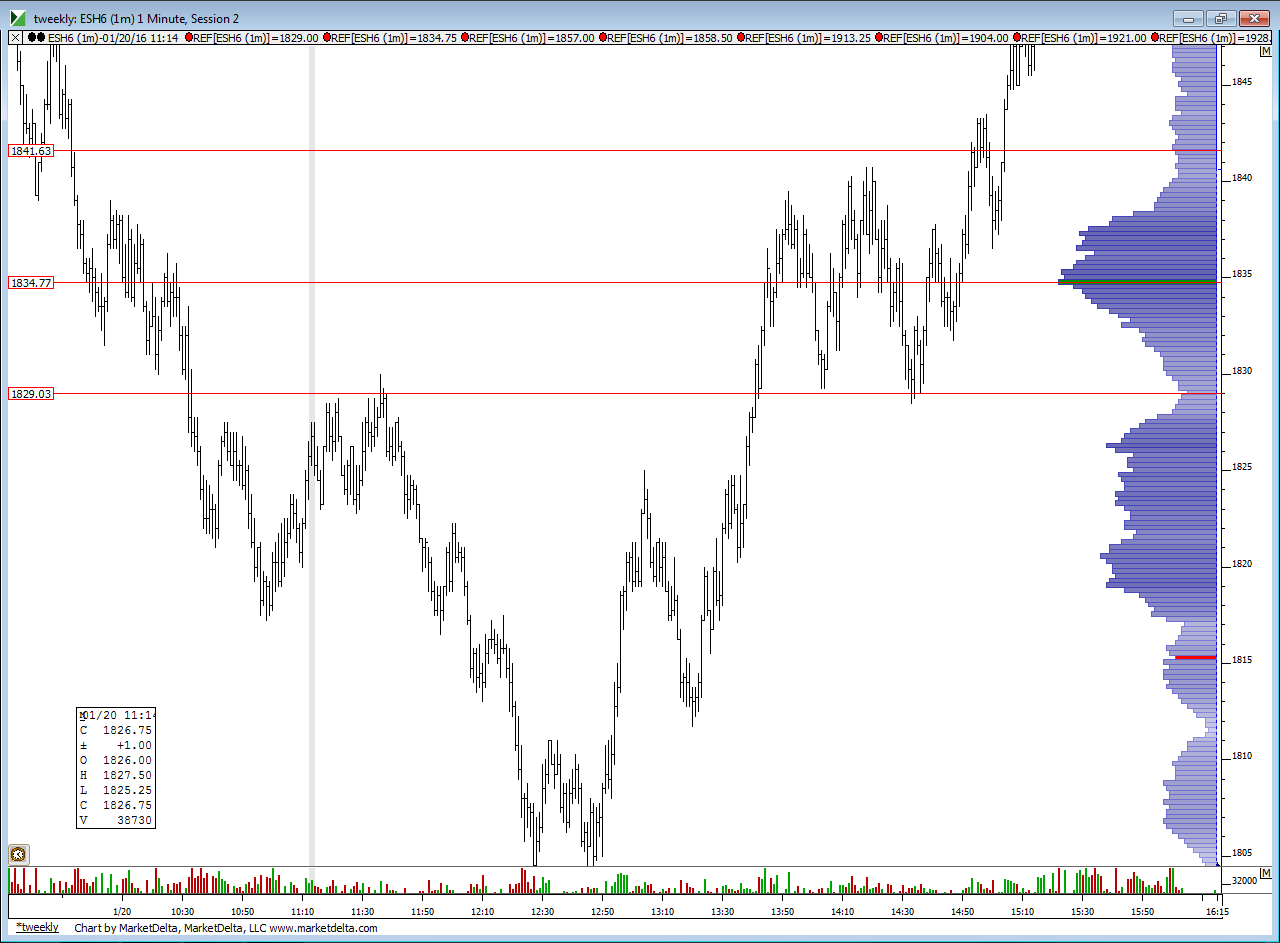
a close up of the key bell curve area that needs to hold from 1/20 trading day
Click image for original size
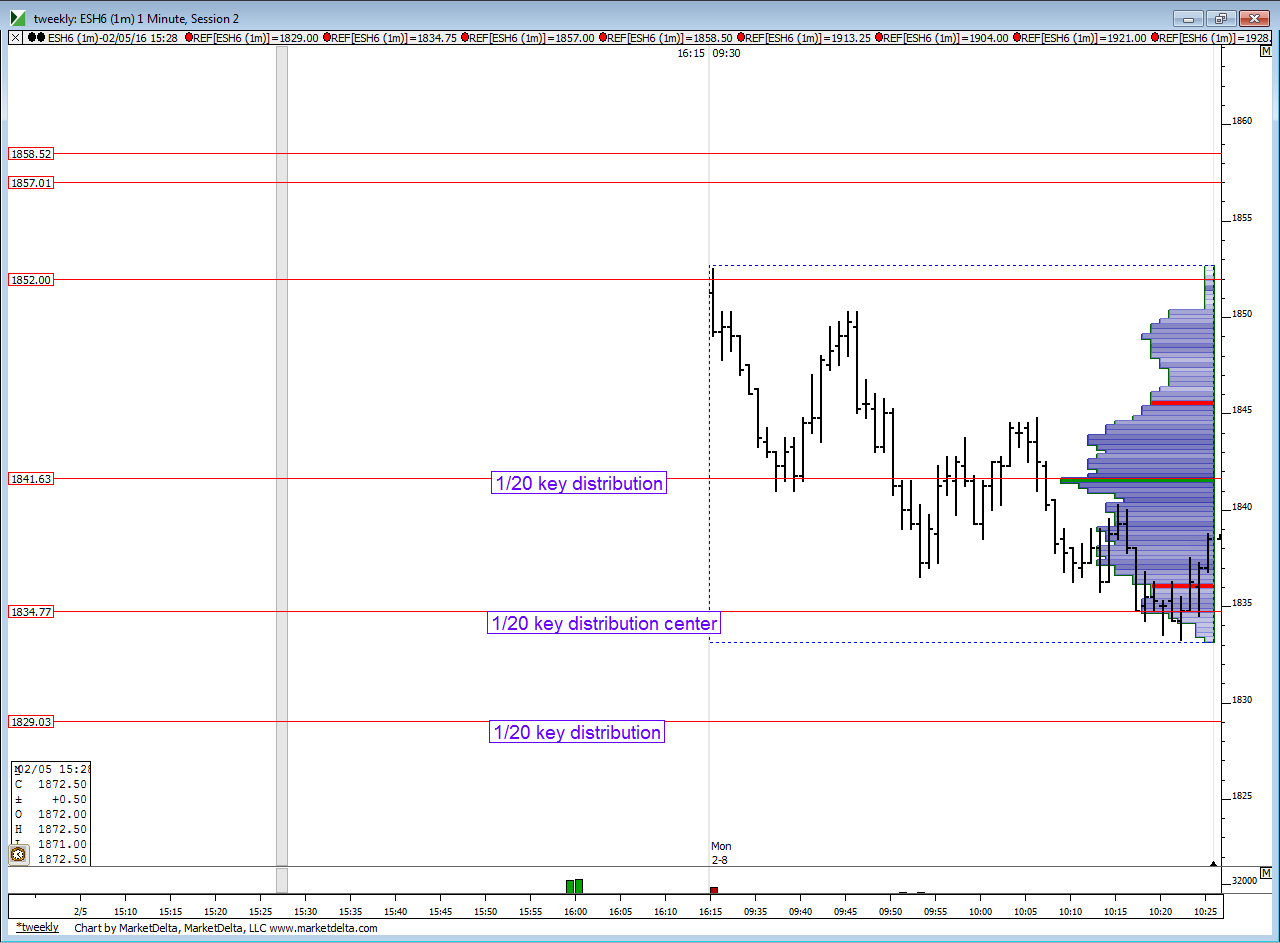
us buyers will continue to use that 42 - 44 area as a magnet as time is building up today right at 41.50.......so an obvious key area many are watching
ok..one for the road...here is today unfolding against the 1-20 key distribution areas...some good battles and if they keep working on the center then down it would go to the lower edge at 1829...but also note the time building today at 41.75....see green horizontal area on histogram on right
Click image for original size
all right so there seems to be about two or three of us hanging around...LOL..I'll catch up with ya in a few months...I hope all stay well and take good trades...c ya
wow good to see u back Bruce...i will be sure to check the forum tomorrow to catch u live and even share some thoughts (if i have any lol)
cheers
cheers
Emini Day Trading /
Daily Notes /
Forecast /
Economic Events /
Search /
Terms and Conditions /
Disclaimer /
Books /
Online Books /
Site Map /
Contact /
Privacy Policy /
Links /
About /
Day Trading Forum /
Investment Calculators /
Pivot Point Calculator /
Market Profile Generator /
Fibonacci Calculator /
Mailing List /
Advertise Here /
Articles /
Financial Terms /
Brokers /
Software /
Holidays /
Stock Split Calendar /
Mortgage Calculator /
Donate
Copyright © 2004-2023, MyPivots. All rights reserved.
Copyright © 2004-2023, MyPivots. All rights reserved.