Pitbull setup Part II
To be honest I donot know if I will be able to articulate this but I will try. This is probably more of a concept then a setup and today wasn't the perfect day but I'll attempt it anyway. Some key ideas 1) many Market profile users and traders consider areas on a price that have not been traded at on the same day more than once to be areas of low volume ( You may need to study the Single print concept to really get this) but I have noticed on the one minute time frame that prices actually push away from other prices on High Volume and you will not see price bar overlap on the one minute....some examples from today may help...but you have been warned....
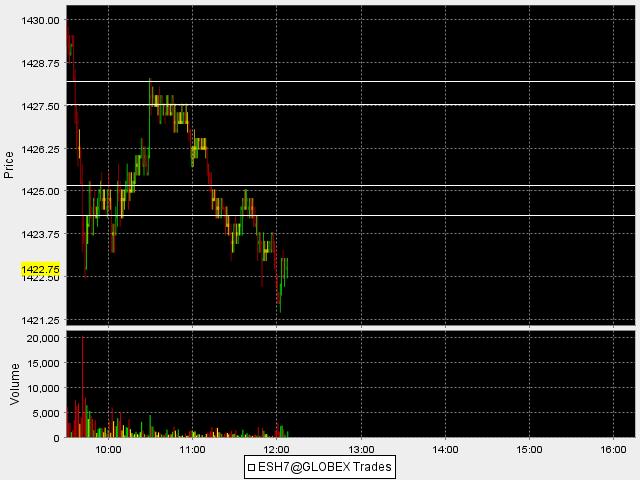
You will notice on the far right of the screen that prices broke down on high volume...and left an area that was pushed away from rather quickly. Well the point of this post is to demonstrate that on many days these areas are tested as if the market particpants are saying " Hey, they broke it down from here before , lets see if they can do it again."....so from this chart you can see that the 1435 -1435.25 area was pushed away from fast. That being the case this High Volume area will need to be tested....so here is what happened soon after
Notice how the market comes back up to test this area..
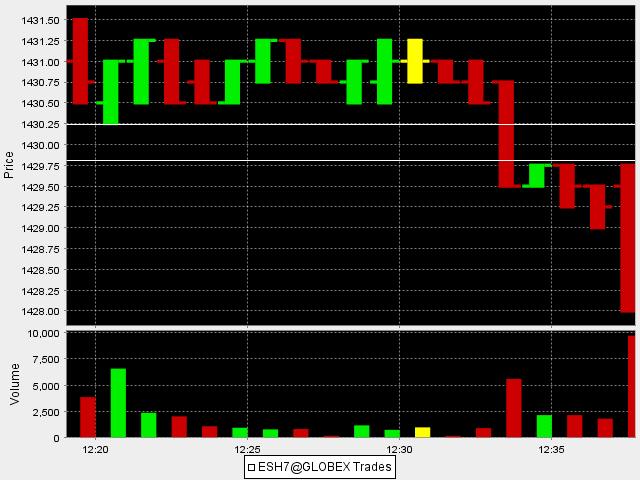
Later on in the day we get another push down on high volume here is a shot of that..notice the horizontal lines drawn at the 1429.75 - 1430.25 area..there is no price bar overlap on this high volume push..so the theory being that this area should be tested...here is the push down
and here is the retest..
I have found that these are excellent areas to trade for..I have also found that on trend days this counter trend approach will kill you.
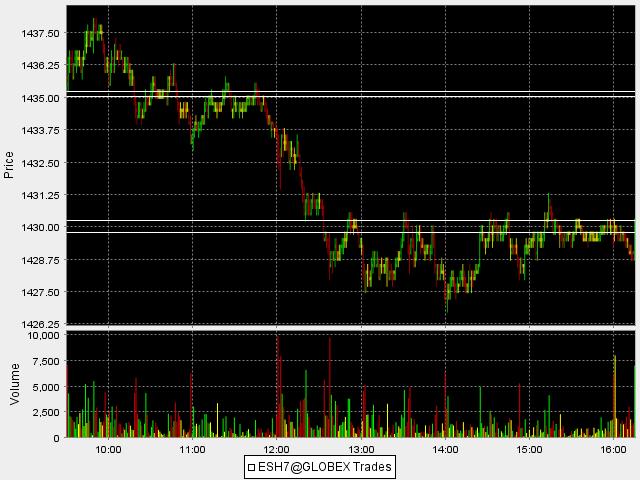
These high volume areas also become dynamic support and resistence areas for the rest of the day quite often...so here are those high push areas and how they affected the market for the rest of todays trading....this is the entire day with those horizontal push out areas left in place
Ask me questions if unclear as this is hard for me to put into words..it makes sense to me but we may need to view a few days before you can see what the H-E-L-L I'm writing about..
Bruce
Click image for original size
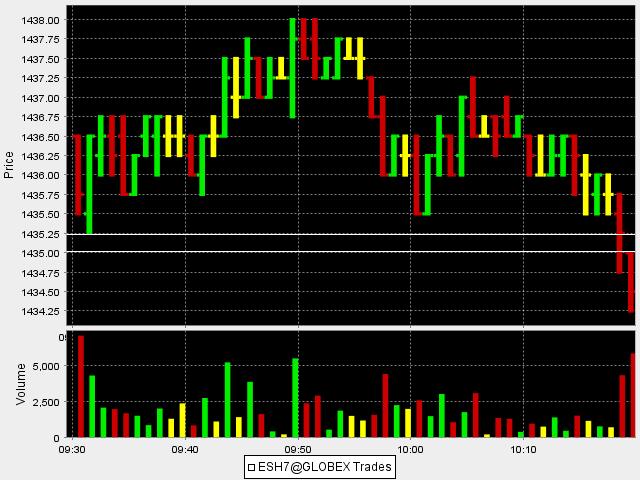
You will notice on the far right of the screen that prices broke down on high volume...and left an area that was pushed away from rather quickly. Well the point of this post is to demonstrate that on many days these areas are tested as if the market particpants are saying " Hey, they broke it down from here before , lets see if they can do it again."....so from this chart you can see that the 1435 -1435.25 area was pushed away from fast. That being the case this High Volume area will need to be tested....so here is what happened soon after
Click image for original size
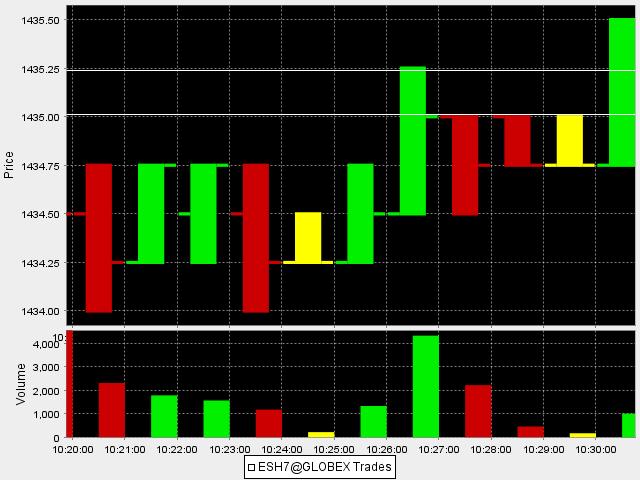
Notice how the market comes back up to test this area..
Later on in the day we get another push down on high volume here is a shot of that..notice the horizontal lines drawn at the 1429.75 - 1430.25 area..there is no price bar overlap on this high volume push..so the theory being that this area should be tested...here is the push down
Click image for original size
and here is the retest..
Click image for original size

I have found that these are excellent areas to trade for..I have also found that on trend days this counter trend approach will kill you.
These high volume areas also become dynamic support and resistence areas for the rest of the day quite often...so here are those high push areas and how they affected the market for the rest of todays trading....this is the entire day with those horizontal push out areas left in place
Click image for original size
Ask me questions if unclear as this is hard for me to put into words..it makes sense to me but we may need to view a few days before you can see what the H-E-L-L I'm writing about..
Bruce
Bruce, where did you pick up this concept ?
I had never considered viewing price/volume in quite this way, nicely done !
Notice my 10:00am long trade entry this morning was the first re-test of the first dynamic support level on your chart.
Would it be valid to draw another line at that 11:00am low, notice the volume spike, and subsequent rejection later at 12:00pm.
Interesting in today's session how price became trapped below each level, retesting it several times but eventually failing to get through.
When I look at this, I see these levels as reactive price levels. I also like your term of them being dynamic support or resistance. They are dynamic in the sense of being created in real-time during the trading session, but are reactive in the sense that price is drawn to them and then price reacts to them when touched.
I also note how your lower price level is exactly where the POC ended up for today's session. In this case the dynamic price became a magnet gathering more volume and time by holding price in a tight range near it.
Bruce, do these levels play a role in subsequent trading sessions ?
Another interesting observation on your chart for today, that first dynamic level is very close to the final VAH for today's session.
Hi PT...you make some very ineteresting observations and conclusions..very sharp...Beleive it or not this is something I uncovered on my own about three years ago...I have never written about it except in a few emails to friends so this is it's debut..perhaps someone has done resarch on this already so I won't name it after myself like DeMark and Williams do just yet...lol
It would not be valid to draw another line at the 11 am low because there was no "air pocket" created when that 11 am low was broken...the bars that broke that low overlaped each other and there was minor congestion although there was still that big volume spike so that is saying something in itself. It is not unusual for these levels to be part of a volume profile and I keep track of the areas that are left unfilled for further reference...in otherwords the areas that don't make it back to be tested become targets and areas to watch. Again we are refering to a high volume area that was successful in it's push out and the market players couldn't find enough energy to bring it back up or back down for the retest. So we want to be careful there. Thanks for reviewing that and I hope I have answered your questions.....I will post some more examples as they develope or at the days end.......On trend days you will obviously see many of these high volume breakouts or breakdowns that don't get retested....so like all things we need entry signals to trade for them to be filled or to take an entry once they are tested and seem to be holding.....sometimes I will watch how much time is spent above or below these high volume areas as a "heads up "as to what will happen next
Bruce
quote:
Originally posted by pt_emini
Bruce, where did you pick up this concept ?
Notice my 10:00am long trade entry this morning was the first re-test of the first dynamic support level on your chart.
Would it be valid to draw another line at that 11:00am low, notice the volume spike, and subsequent rejection later at 12:00pm.
Interesting in today's session how price became trapped below each level, retesting it several times but eventually failing to get through.
When I look at this, I see these levels as reactive price levels. I also like your term of them being dynamic support or resistance. They are dynamic in the sense of being created in real-time during the trading session, but are reactive in the sense that price is drawn to them and then price reacts to them when touched.
I also note how your lower price level is exactly where the POC ended up for today's session. In this case the dynamic price became a magnet gathering more volume and time by holding price in a tight range near it.
Here is the YM..I have only left the lines on the chart that have been unfilled..so far today..let see what happens...I don't trade the dow and there where other areas that did get filled but these haven't been...yet???
Click image for original size
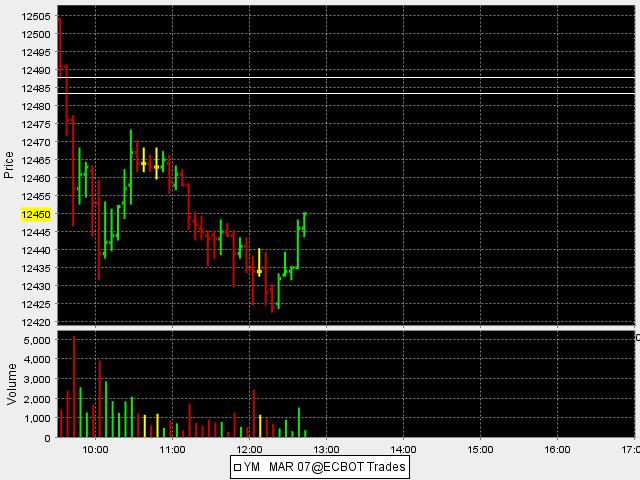
Good work Bruce. I notice that the areas of high volume coincide with the Gap (1435.25) and S1 (1430.00). Your observation supports the concept of using Pivots and other areas of support/resistance to initiate trades.
12/22/2006 : 9:11:23 << moved from pitbull thread per BruceM's request >>
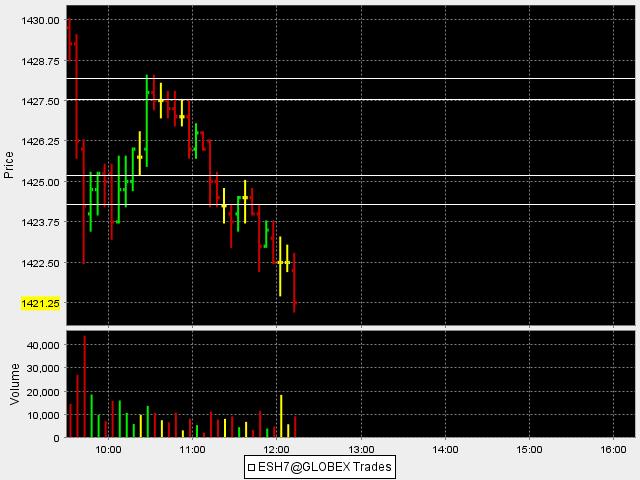
here are todays levels...the top two horizontal lines where created at about 8 minutes into the trading day...the bottom two where created on the 9:42 and 9:43 EST bar....
If anyone is interested I can zoom in and show more detail if anyone has a true desire to learn/analyze this
here are todays levels...the top two horizontal lines where created at about 8 minutes into the trading day...the bottom two where created on the 9:42 and 9:43 EST bar....
Click image for original size
If anyone is interested I can zoom in and show more detail if anyone has a true desire to learn/analyze this
12/22/2006 : 9:23:35 << copied from pitbull thread ...to maintain continuity for the portions relevant to the Part II setup. >>
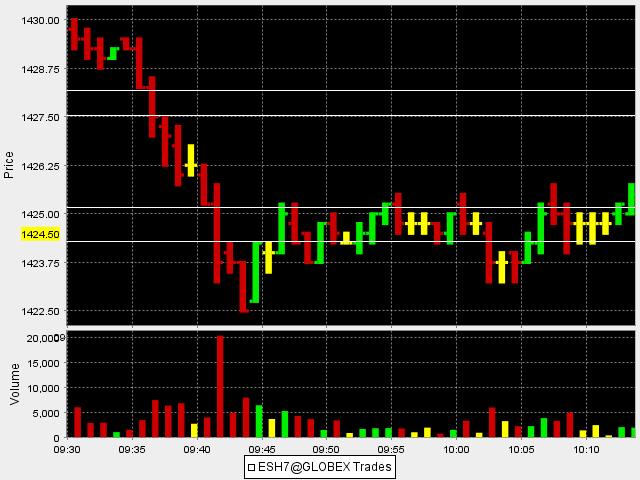
here is a five minute bar chart...can anyone spot the attempted breakdown at the 10 a.m bar on low volume which set up the signal to get long...a mini 1-2-3 pattern.....look what the ticks where doing then too....look how high the Ticks got on the push up into that top zone in the 1427.50 - 1428 area....at 10 am the dow was making new lows ( see pitbull set up number 1 ) but not the SP..for the market divergence trade...If anyone need me to post the Tick or dow chart I will later..Wife has last minute X-mas plans for me...lol
see how we can incorporate both concepts to set up a winning trade..?
here is a five minute bar chart...can anyone spot the attempted breakdown at the 10 a.m bar on low volume which set up the signal to get long...a mini 1-2-3 pattern.....look what the ticks where doing then too....look how high the Ticks got on the push up into that top zone in the 1427.50 - 1428 area....at 10 am the dow was making new lows ( see pitbull set up number 1 ) but not the SP..for the market divergence trade...If anyone need me to post the Tick or dow chart I will later..Wife has last minute X-mas plans for me...lol
Click image for original size
see how we can incorporate both concepts to set up a winning trade..?
12/22/2006 : 10:23:27 <<moved from pitbull thread per BruceM's request>>
Bruce, when you get a free minute, i am having difficulty understanding how you came to draw that upper channel at the 1428 level off the open. Perhaps if you post a 1 minute chart and walk us through it in a little more detail it will help my comprehension.
In response to the dow leadership, I did observe the cash dow index was leading to the downside right off the open this morning. At the start of this downtrend, way back on last Friday, the ER2 and NQ were the leaders to the downside and the ES / YM were reluctant to give up the bullish sentiment, but that has role has shifted to the dow the past two days.
12/22/2006 : 12:40:03 << moved from pitbull thread per BruceM's request >>
Ok PT...here is my attempt....Note on the chart below that the high of the 8th one minute bar didn't overlap any other bar but the 7th bar on the day..which left an "air pocket " from the 6th bars low to the 8th bars high....then later on you can see on the down level that the 13th bars highs didnot overlap any other bar except the twelths bar up until that point in time so the lines are drawn from the low of the 11th bar to the high of the 13th bar......these areas where obviously both traded back to and the second one was filled in quickly.....there is still one more area on the chart..that has an air pocket...look at the 7th bar of the days high and the 4th bars low...the 7th bar only overlapped the 6th bar and no other one so far today so you would also draw a line from the 4th bars low to the 7th bars high...I know it's a bit confusing...
Ok PT...here is my attempt....Note on the chart below that the high of the 8th one minute bar didn't overlap any other bar but the 7th bar on the day..which left an "air pocket " from the 6th bars low to the 8th bars high....then later on you can see on the down level that the 13th bars highs didnot overlap any other bar except the twelths bar up until that point in time so the lines are drawn from the low of the 11th bar to the high of the 13th bar......these areas where obviously both traded back to and the second one was filled in quickly.....there is still one more area on the chart..that has an air pocket...look at the 7th bar of the days high and the 4th bars low...the 7th bar only overlapped the 6th bar and no other one so far today so you would also draw a line from the 4th bars low to the 7th bars high...I know it's a bit confusing...
Click image for original size
Thanks DT, there is the 1445 officially hit in the day session. Seems like a good place for shorts with that gap down below....we'll see...there exists a band at the 41 area so that would make a good target if this market can get some steam together on the downside
Bruce
I had to edit this again as my own post made me laugh - Imagine a 4 point move is over half the average days range now and I say that you need "steam" to get to such a target. The bottom line is that these dimished ranges are pathetic.
Bruce
I had to edit this again as my own post made me laugh - Imagine a 4 point move is over half the average days range now and I say that you need "steam" to get to such a target. The bottom line is that these dimished ranges are pathetic.
quote:
Originally posted by day trading
Good market read!
Emini Day Trading /
Daily Notes /
Forecast /
Economic Events /
Search /
Terms and Conditions /
Disclaimer /
Books /
Online Books /
Site Map /
Contact /
Privacy Policy /
Links /
About /
Day Trading Forum /
Investment Calculators /
Pivot Point Calculator /
Market Profile Generator /
Fibonacci Calculator /
Mailing List /
Advertise Here /
Articles /
Financial Terms /
Brokers /
Software /
Holidays /
Stock Split Calendar /
Mortgage Calculator /
Donate
Copyright © 2004-2023, MyPivots. All rights reserved.
Copyright © 2004-2023, MyPivots. All rights reserved.