Single Prints Forward Test - May 2005
I have been trying to back test single prints as high probability reversal areas but have been unable to do it so far. As a second prize I'm toying with the idea of forward testing this in simulated real-time using the ER2 contract and testing during the month of May 2005.
So far I've come up with the following rules. Jump in and add or question a rule if you wish:
So far I've come up with the following rules. Jump in and add or question a rule if you wish:
- The single print must be less than a month old to be used.
- The single print must be a confirmed single print.
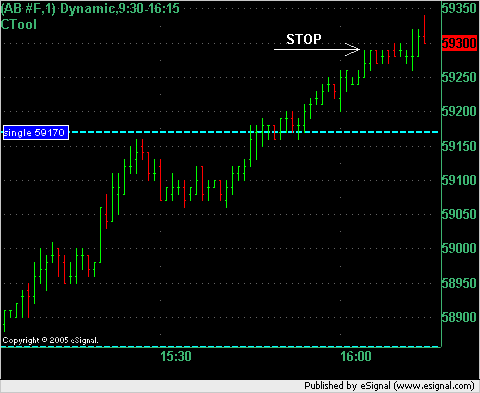
- The entry price is one tick inside the single print and an entry will only be recorded if the price touches the single.
- A stop of one handle will be used.
- 4 contracts will be traded.
- Partial profits will be taken at 1, 2, 3, and 4 points.
- Commissions will be $5 per contract.
- Stop will be moved to break even after first partial profit has been taken.
- Stop will not be trailed after moved to break even.
- No re-entries if stopped out but re-entries always taken if all 4 contracts are taken off profitably and re-entry is then only allowed on that day. (This is logical because single tick will not be there on subsequent days.)
- All single trades will be taken irrespective of other news items or announcements that are being made at that point.
- If multiple singles created in same day or time period then all of them will be traded using the same stops and targets and rules.
- No overnight carry. Any open contracts are closed out at the last traded price (not the settlement price) that is traded during RTH which in this case is usually at 16:14:59 or 16:15:00 EST. Although you would not be able to implement this in real trading it appears to be the fairest way to measure this strategy. In reality you will close the trade before this time and get a slightly more or less favorable price.
quote:
Originally posted by phylup
which ones are the singles? not all the prices with single letters?
The first single TPO's that were created are the singles. So in this case it's the ones at the top because the singles were left behind on our way down: 591.7 and 589.1
If the market was moving up then it would be the singles at the bottom of the range - which is not the case here.
quote:
Originally posted by phylup
did you see this?
quote:
On 11-May-05, at 7:20 AM
> I started forward testing the MP 'Single Prints' strategy at the
> beginning of this month. Hasn't traded much. Second trade (and second
> loser) yesterday, so the running loss is now at $840.
What is the " Single Print " strategy?
Never heard of it put in a package like that.
There is no blind buy/sell of single prints.
Furthermore arbitrary stops are useless. Entries and stops are to be
placed based on "structure ".
If interested I will tell you how to properly use single prints.
No offense but over the past 2 years I have not met more than one
other trader who applies MP correctly.
They all seem to pull out a thing or two and try to put together a
rule based system. Doesn't work that way.
Hence the "if MP really worked everyone using it would make money"
type of statement.
D.
Yes I did see it and I sent the guy an email. I'd like to hear from him.
He has a good point about the use of fixed stop/target sizes but I'm not 100% sure that I agree with him about the entries. A stop of 1 point (like I'm doing in this test) can be a bad idea if we have (for example) the VAL or some other key support number 1.5 points below us. That stop would be uneccessarily tight if the single was the first price to be hit in a cluster of price levels. We would be better off using a stop a fixed distance beyond the outer price in this price cluster.
Also with targets. I think that the targets are perhaps too conservative here and that we should be leaving on a couple of contracts as runners to aim for bigger targets. And I agree that the use of market structure for picking the targets would be better than fixed target sizes.
However, having said all that, I decided to keep it as simple as possible to start with and annotate each trade in the spreadsheet and see where and how it can be improved and see what parts of the boiler plate strategy work and what parts don't and go from there.
Personally I think that this strategy has great potential once the basic stats have been worked out.
Hi Guy,
Thanks for starting this interesting thread.
Do you find that trading on single prints in the upper and lower tails better winners than those else where?
Thanks for starting this interesting thread.
Do you find that trading on single prints in the upper and lower tails better winners than those else where?
quote:
Originally posted by BUZZ200
Hi Guy,
Thanks for starting this interesting thread.
Do you find that trading on single prints in the upper and lower tails better winners than those else where?
I haven't seen any bias like that and partly because I've never looked at that. That would definitely be an interesting subcategory to explore and I'll keep my eye on that.
Having said that I've just had a thought. Wouldn't all single print trades be in an upper or lower tail anyway? Because, by definition the single print hasn't been touched since it was created so you would have to be in a developing buying or selling tail in order to trigger the single print trade anyway wouldn't you?
13 May 2005: Intraday update:
Single at 589.1 was touched which means that the strategy went short at 589.0 at 09:31 ET and took off 1 contract at 588.0 and moved the stop for the other 3 contracts to breakeven (589.0).
Single at 589.1 was touched which means that the strategy went short at 589.0 at 09:31 ET and took off 1 contract at 588.0 and moved the stop for the other 3 contracts to breakeven (589.0).
Last trade made gross profit of $1,000 in 23 minutes.
Running profit after this last trade is now $1,120. I've updated the spreadsheet:
Click here to download a spreadsheet.
Running profit after this last trade is now $1,120. I've updated the spreadsheet:
Click here to download a spreadsheet.
Re-entry on the first single trade today at 11:00 EST. i.e. a short again at 589.0
First contract closed at 588.0 and stop moved to breakeven.
This is in accordance with our rules that we re-enter the single if we took the full profit on the previous entry of that single and were not stopped out.
The other 3 contracts were stopped out at breakeven 589.0
First contract closed at 588.0 and stop moved to breakeven.
This is in accordance with our rules that we re-enter the single if we took the full profit on the previous entry of that single and were not stopped out.
The other 3 contracts were stopped out at breakeven 589.0
quote:
Originally posted by guy
quote:
Originally posted by BUZZ200
Hi Guy,
Thanks for starting this interesting thread.
Do you find that trading on single prints in the upper and lower tails better winners than those else where?
I haven't seen any bias like that and partly because I've never looked at that. That would definitely be an interesting subcategory to explore and I'll keep my eye on that.
Having said that I've just had a thought. Wouldn't all single print trades be in an upper or lower tail anyway? Because, by definition the single print hasn't been touched since it was created so you would have to be in a developing buying or selling tail in order to trigger the single print trade anyway wouldn't you?
In your image attachment for May10, the single print G(59810)I presume is not a tail. To my understanding single prints can occur anywhere in the MP distribution. I may be wrong.
I wanted to ask you another question. Do you take Rotation Factor into consideration before entering a trade?
We had another single trade short at 15:12 EST today which was stopped out for a $420 loss. Cumulative profit $780 now
The spreadsheet has been updated: Click here to download a spreadsheet.
If you take a look at the XLS workbook and go to the summary sheet you will see the difference between the amounts won/lost versus the number of winners/losers.
Have a safe weekend everyone.
The spreadsheet has been updated: Click here to download a spreadsheet.
If you take a look at the XLS workbook and go to the summary sheet you will see the difference between the amounts won/lost versus the number of winners/losers.
Have a safe weekend everyone.
quote:
Originally posted by BUZZ200
In your image attachment for May10, the single print G(59810)I presume is not a tail. To my understanding single prints can occur anywhere in the MP distribution. I may be wrong.
I wanted to ask you another question. Do you take Rotation Factor into consideration before entering a trade?
Hey Buzz,
No - singles don't form in tails. Singles only form if there are multiple TPO's on either side of single TPOs. Otherwise the single TPOs above and below the Market Profile bell curve are buying and selling tails.
So in order to create a single print we need it to be confirmed. This means that the bracket which is forming the single prints needs to close. In the example you just cited:
Click image for original size
the H bracket has to close before the single at G is confirmed. This is because H can still fill in that single and then it wouldn't be a single. Once the H bracket has closed then the single is confirmed.
Yes, I'm always watching the rotation factor. I have a little utility that pops up the Rotation Factors (that I'm watching) at the end of each half hour and sounds an audible alarm and lets me know what the Rotation Factors are. That way I'm always aware of what the RF's are at the end of each half hour and am always aware of what's happening. But I don't check them before I trade because I just refresh my mental image of the market w.r.t. the RF's at each half hour. Here is an example of what the RFTool shows me:
Click image for original size
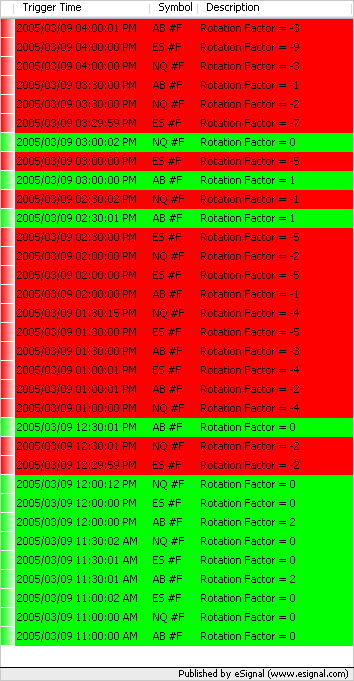
It also keeps me abreast of the RF's in multiple markets at the same time so I can see if the RF in the ES is going up and in the ER2 and YM might be going down... which is obviously useful info.
Hope this helps.
Guy
The White Board is a discontinued indicator because its functionality was automated through the use of the DVATool which is much faster and more reliable in managing Single Prints - which is primarily what the White Board was used for.
Emini Day Trading /
Daily Notes /
Forecast /
Economic Events /
Search /
Terms and Conditions /
Disclaimer /
Books /
Online Books /
Site Map /
Contact /
Privacy Policy /
Links /
About /
Day Trading Forum /
Investment Calculators /
Pivot Point Calculator /
Market Profile Generator /
Fibonacci Calculator /
Mailing List /
Advertise Here /
Articles /
Financial Terms /
Brokers /
Software /
Holidays /
Stock Split Calendar /
Mortgage Calculator /
Donate
Copyright © 2004-2023, MyPivots. All rights reserved.
Copyright © 2004-2023, MyPivots. All rights reserved.