Candle Pattern
After the move up we had I thought we would see an "M"
Click image for original size
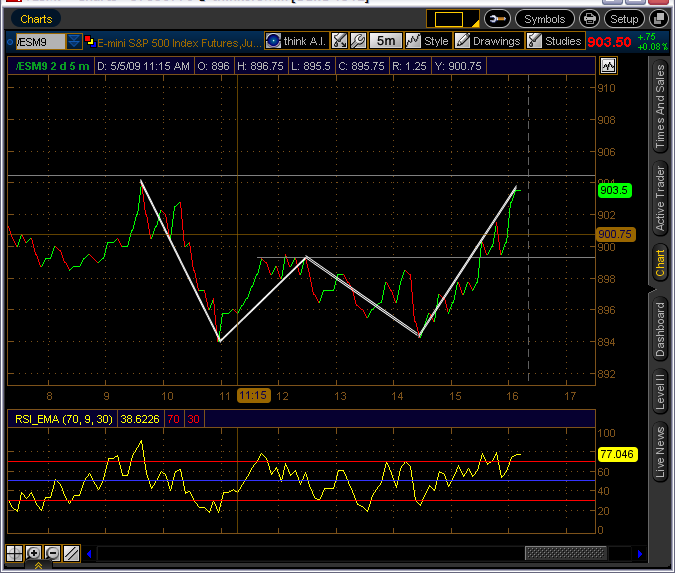
A measured move above the "W" is about 914.00 I have an r3 in that area
but we need a good close above 904.75
but we need a good close above 904.75
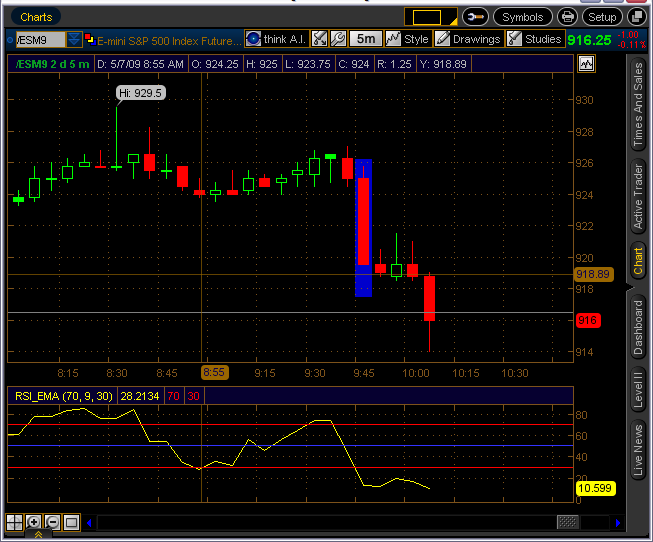
Click image for original size
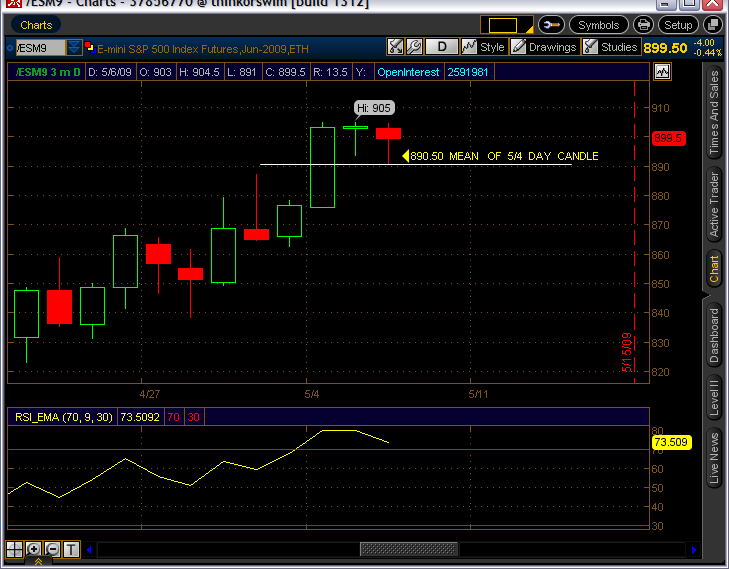
The 8:15am edt candle is now a dominate candle
thanks Red..I have ny short blinders on today ...a 30 minute RTH close above 912.50 will get me to question my short bias...I like these candles...please keep em coming
I noticed in the (18:12:16) post above, I have 914 as r3 / should be r4
quote:
Originally posted by redsixspeed
Here are some projections I ran off that dominate candle I posted 4/9. The mid point of this candle
acted as support @ the 833/834 area
From the low @ 826.50 + 1.618% = 839.75 + 2.618% = 848.00 + 3.618% = 856.50 + 4.618% = 864.75
+ 5.618% = 873.00 + 6.618% = 881.25 + 7.618% = 889.50......889.50 is todays r2/ the next to upside
897.75....when/if we move back down we may get a bounce A these areas...FWIW
Pretty amazing you found that 89 confluence. I faded 07 to find a bottom here. Paying close attention to your work and that dominate candle at the confluence projects a peak at 932 from 823. I believe you came up with close to that if I remember correctly, or maybe that's counter indication you not liking that far out.
The short of it: I believe you came up with something sweet. Jolly cool of you to share it, Red.
I Have daily R2 up at the 912 and the weekly R2 at 915 so that became a good zone....Glad your keeping it simple and not trying to make trading harder then it is...if we can keep these closes on the 30 minute below the high of yesterday and the current 30 minute low then we may get an outside day to the downside which takes out yesterdays RTH low...FWIW!!
quote:
Originally posted by redsixspeed
I noticed in the (18:12:16) post above, I have 914 as r3 / should be r4
900 even should be good support.
I don't trade with MAs ... but recently I started looking at them .. I have set up a quad chart with different time frame of MAs .. Today at 11:30am et. all four MAs came together and in fact price hit them about the same time .. I just got started with this so I'll post what I see from time to time .. looks good so far .. My intent is to use them as a confirming tool not a primary ...
Emini Day Trading /
Daily Notes /
Forecast /
Economic Events /
Search /
Terms and Conditions /
Disclaimer /
Books /
Online Books /
Site Map /
Contact /
Privacy Policy /
Links /
About /
Day Trading Forum /
Investment Calculators /
Pivot Point Calculator /
Market Profile Generator /
Fibonacci Calculator /
Mailing List /
Advertise Here /
Articles /
Financial Terms /
Brokers /
Software /
Holidays /
Stock Split Calendar /
Mortgage Calculator /
Donate
Copyright © 2004-2023, MyPivots. All rights reserved.
Copyright © 2004-2023, MyPivots. All rights reserved.