Candle Pattern
One of the key zones up here is 1135.00/1140.00...the mid point of
that zone is 1137.50...how cool is that.. There is another zone
above and will come into play if we get to these areas....first
things first...this is also expiration....
that zone is 1137.50...how cool is that.. There is another zone
above and will come into play if we get to these areas....first
things first...this is also expiration....
OK, we just hit the bottom of this key zone @ 1135.00....1137.50 is an important # in this zone
(see the post prior to this one for clarity) ^^
(see the post prior to this one for clarity) ^^
The zone 1135/1140 is a key area...we ticked thru the top of it
yesterday @ 1140.25 and moved down...Today we took the top of that
zone out...A close above is more bullish...
The other zone above it is 1163.25/1167.50 this is the same zone
we were in @ the bottom @ 1037.00 when the market turned...
This area is hit 80% of the time... I learned that from studying
Thomas Bulkowski
Will this area hit this time or will it be one of the 20% that
doesn't make it..
We are just under the 1135/1140 zone...a move thru and close above
would be bullish
would be bullish
Originally posted by redsixspeed
We are just under the 1135/1140 zone...a move thru and close above
would be bullish
====================================================================
Market closed above the top of the zone...may get a pull back..
the 1140/1135 zone should be tough...begining Sunday 6pm et
we'll see...
Broker Customer Service:
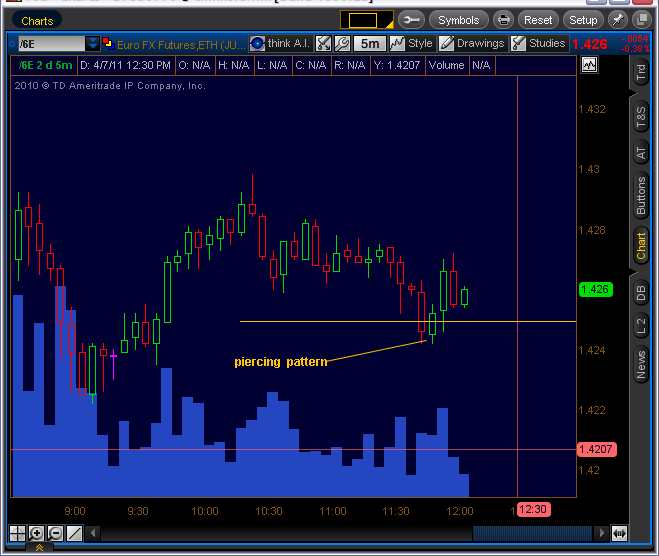
below is a 5min. piercing pattern on the 6e .. Nison says it should close more than half way into the prior candle .. but I use a different method ...
The yellow line is a key area .. if the pattern close above the key area it does not have to close more than half way into the prior candle...see how it plays out in this slow low volume lunch time
The yellow line is a key area .. if the pattern close above the key area it does not have to close more than half way into the prior candle...see how it plays out in this slow low volume lunch time
Click image for original size
Originally posted by redsixspeed
Measured Move:
===================================== 1155.00
===================================== 1150.00
Identify a box range, if the market breaks above/below,
rule says it should go at least the same distance as
the box. In the ex. above a break up = T1 1160.00
break below = T1 1145.00
=====================================================================
the higher time frame of the measured move on 6e projected 1.4630
6e 5min. bullish separating line .. if the data can be trusted, candle patterns can be powerful
Click image for original size

The Japanese don't like the number 4 and 9 because of their pronunciation. Four is pronounced "shi" which is the same pronunciation as death. Nine is pronounced "ku" which has the same pronunciation as agony or torture.
There are many hospitals that don't have these numbers as the room number or even the floor number. The Japanese also dislike Friday the13th, though many of them are not Christians. There are no seats with numbers 4, 9 and 13 on passenger planes of the All Nippon Airways.
Even in the US, some have said they will not buy the iphone4 because of the #4
I don't trade with MAs ... but recently I started looking at them .. I have set up a quad chart with different time frame of MAs .. Today at 11:30am et. all four MAs came together and in fact price hit them about the same time .. I just got started with this so I'll post what I see from time to time .. looks good so far .. My intent is to use them as a confirming tool not a primary ...
Emini Day Trading /
Daily Notes /
Forecast /
Economic Events /
Search /
Terms and Conditions /
Disclaimer /
Books /
Online Books /
Site Map /
Contact /
Privacy Policy /
Links /
About /
Day Trading Forum /
Investment Calculators /
Pivot Point Calculator /
Market Profile Generator /
Fibonacci Calculator /
Mailing List /
Advertise Here /
Articles /
Financial Terms /
Brokers /
Software /
Holidays /
Stock Split Calendar /
Mortgage Calculator /
Donate
Copyright © 2004-2023, MyPivots. All rights reserved.
Copyright © 2004-2023, MyPivots. All rights reserved.