Candle Pattern
Click image for original size
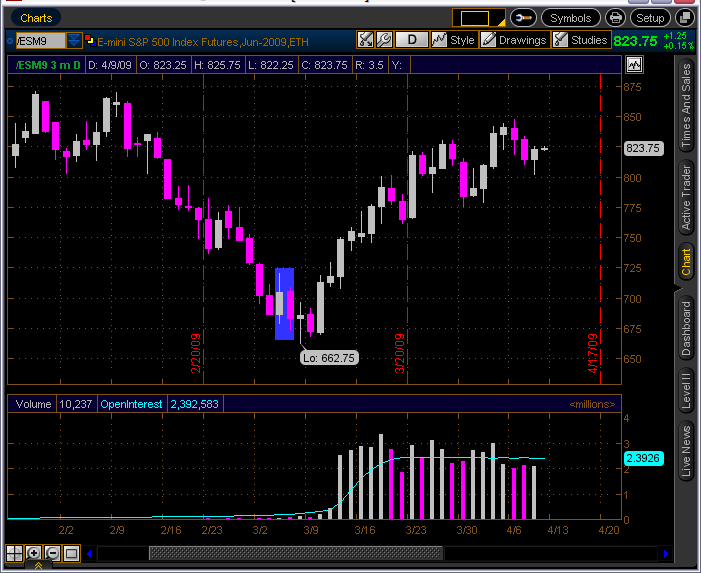
This is a "daily last engulf" from 3/4-3/5 I only show this
so you can see the patterns work @ all time frames. This
pattern would have been better if the white candle real
body was smaller & better volume on the red candle.
Now I am watching for a bullish engulf @ the top
Thanks for these Red!
Click image for original size
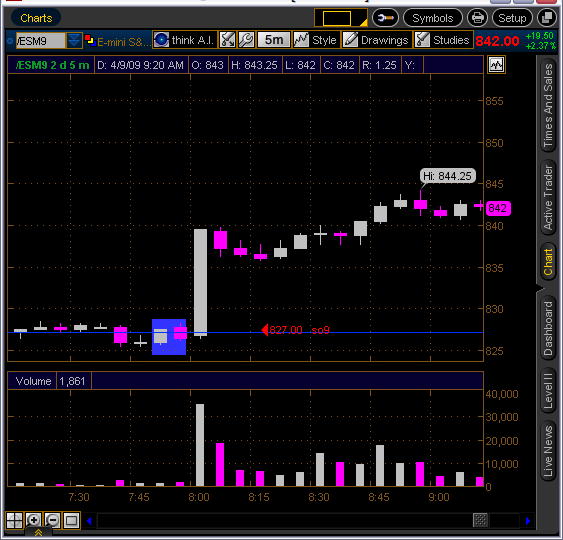
Did that cause all that move LOL
One area I'll be looking @ to the downside is the mid point of that big
5/15min. candle
5/15min. candle
I want to give some of you confidence in the candle patterns. The following helps me
understand what I am seeing when the pattern appears.
Consider this:
(1) The Japanese have studied them for 100 yrs./ there's your back test.
(2) Steve Nison has trained professionals in almost every major investment
firm in EIGHTEEN (18) different countries on how to apply these methods. He
has also taught at the Federal Reserve (let that sink in), The World Bank, and
numerous universities. He is an instructor at the New York Institute of Finance.
What does that mean to you as a trader sitting at home in your little office?
Well; once you understand how to identify the pattern the way Nison taught
you are seeing the samething as those traders in 18 different countries and
those big investment firms..... This is your army you join them.
At the very least you should put candle patterns in your tool box.
They work well with MP. I use them to confirm an area I belive to be
an s/r area.
Now can the pattern fail? Sure it can news can change the market, a threat of attack
a war, but under what may be called normal trading the pattern works.
a war, but under what may be called normal trading the pattern works.
Then the next time someone ask the question "does anyone
make money trading futures " You show them your
candles.
make money trading futures " You show them your
candles.
Any one knows why we got that huge green candle around 8 am yesterday???
I read a post something about Wells Fargo @ 8am but didn't get the details
Thanks redsixspeed, now that leads to another golden question. On earning calender I can't find this company, also how do we know which company report will cause high volatility???? Any comments anyone as it will be really useful
I don't trade with MAs ... but recently I started looking at them .. I have set up a quad chart with different time frame of MAs .. Today at 11:30am et. all four MAs came together and in fact price hit them about the same time .. I just got started with this so I'll post what I see from time to time .. looks good so far .. My intent is to use them as a confirming tool not a primary ...
Emini Day Trading /
Daily Notes /
Forecast /
Economic Events /
Search /
Terms and Conditions /
Disclaimer /
Books /
Online Books /
Site Map /
Contact /
Privacy Policy /
Links /
About /
Day Trading Forum /
Investment Calculators /
Pivot Point Calculator /
Market Profile Generator /
Fibonacci Calculator /
Mailing List /
Advertise Here /
Articles /
Financial Terms /
Brokers /
Software /
Holidays /
Stock Split Calendar /
Mortgage Calculator /
Donate
Copyright © 2004-2023, MyPivots. All rights reserved.
Copyright © 2004-2023, MyPivots. All rights reserved.