Candle Pattern
u should practice price action
Originally posted by daytraderjoel
u should practice price action
Would you be kind enough to show the way with some examples/ charts ifpossible
Originally posted by daytraderjoel
u should practice price action
=====================================================================
What I call pivot point "B" (PPB) and is my strongest pp
was 1165.00. I had projections to the downside T1 54/55 area
looking for a bounce. T2 was 50.25 also a projection and 51.75
was s3B. I see the price action now but these areas were
marked prior to the move.
Please post any price action you wish.
Go back to the chart I posted "counter attack". The close
of that pattern is 1161.50. My PP-B is 1161.50....lol
of that pattern is 1161.50. My PP-B is 1161.50....lol
In this early a.m. we are trading @ the 1161.50 area of that
"counter attack" pattern. Using the rule old resistance new
support. We'll see if it holds.
"counter attack" pattern. Using the rule old resistance new
support. We'll see if it holds.
We have bullish separating lines on the 5 & 15min. in the ES
Click image for original size

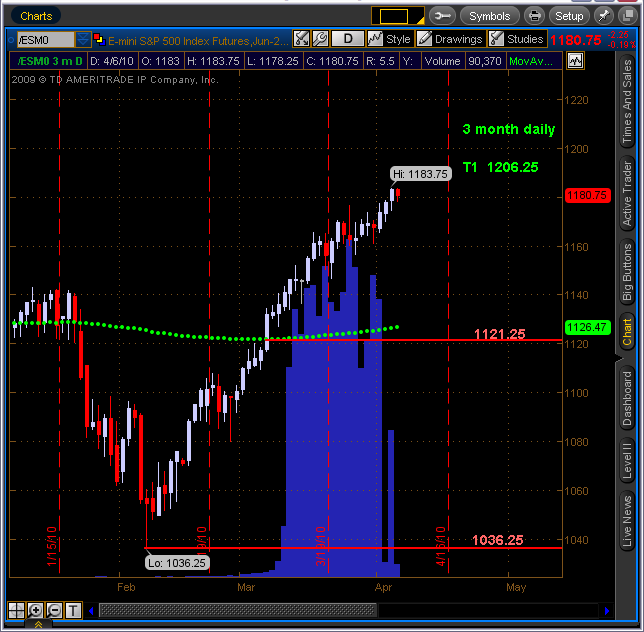
Trading by the numbers:
Don't know if we go there but the projection says its possible
Click image for original size
SPX hit 1191.8 on 4/6 just 8pts. away from 1200.00...PUSH HARD!!!...lol......Got to do battle @ 1187.50 first.
When we hit that 87.50 the other day my platform
went on vacation.
When we hit that 87.50 the other day my platform
went on vacation.
I don't trade with MAs ... but recently I started looking at them .. I have set up a quad chart with different time frame of MAs .. Today at 11:30am et. all four MAs came together and in fact price hit them about the same time .. I just got started with this so I'll post what I see from time to time .. looks good so far .. My intent is to use them as a confirming tool not a primary ...
Emini Day Trading /
Daily Notes /
Forecast /
Economic Events /
Search /
Terms and Conditions /
Disclaimer /
Books /
Online Books /
Site Map /
Contact /
Privacy Policy /
Links /
About /
Day Trading Forum /
Investment Calculators /
Pivot Point Calculator /
Market Profile Generator /
Fibonacci Calculator /
Mailing List /
Advertise Here /
Articles /
Financial Terms /
Brokers /
Software /
Holidays /
Stock Split Calendar /
Mortgage Calculator /
Donate
Copyright © 2004-2023, MyPivots. All rights reserved.
Copyright © 2004-2023, MyPivots. All rights reserved.