Candle Pattern
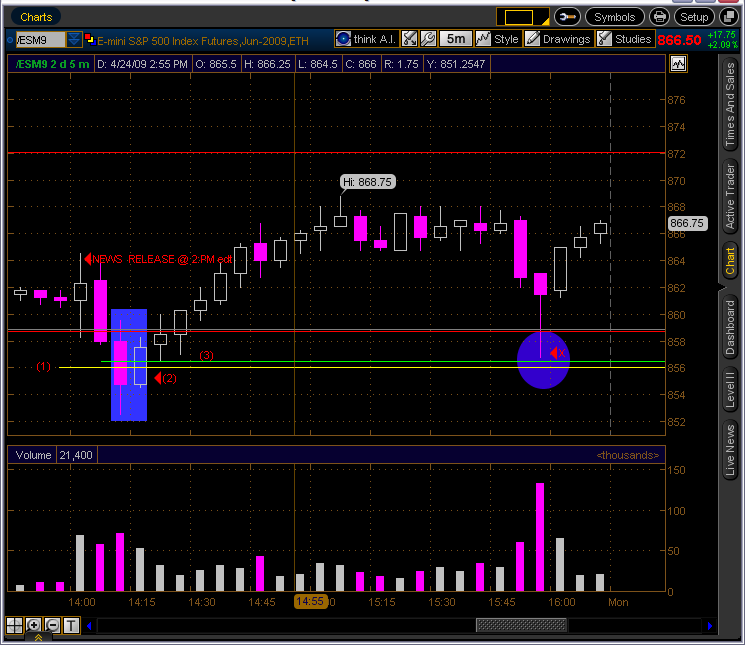
After the news Friday @ 2pm edt 4/24 we get reaction that gave a bullish candle pattern:
(1) support / yellow line
(2) candle pattern & signal
(3) mean of white candle & support / green line
As I heard a trader say "set ups happen quick and we have to be Johnnie on the spot" meaning act fast.
"Where a candle pattern or line appears within the market picture is often more important than the individual candle pattern"
This is a good example of the candle pattern within the market
picture. 868.75 is a +100% projection of range
Click image for original size
Yea; I know I said I wouldn't post anymore in here; so sue me. lol
I've read a few other contradicting opinions about how the FED forward assessing troubled banks will affect the market. That's a nice pattern, but all it's going to take to tank the market again is an unexpected positive number worrying about inflationary growth.
The good news is they traded opposite of sentiment; the bad news: I fear they ran up and made a first leg to a move by my numbers ended at 868 before they broke down.
I'm liking 802 S&P.
But here, jump in on this:
http://www.google.com/finance?q=NYSE:RF
The good news is they traded opposite of sentiment; the bad news: I fear they ran up and made a first leg to a move by my numbers ended at 868 before they broke down.
I'm liking 802 S&P.
But here, jump in on this:
http://www.google.com/finance?q=NYSE:RF
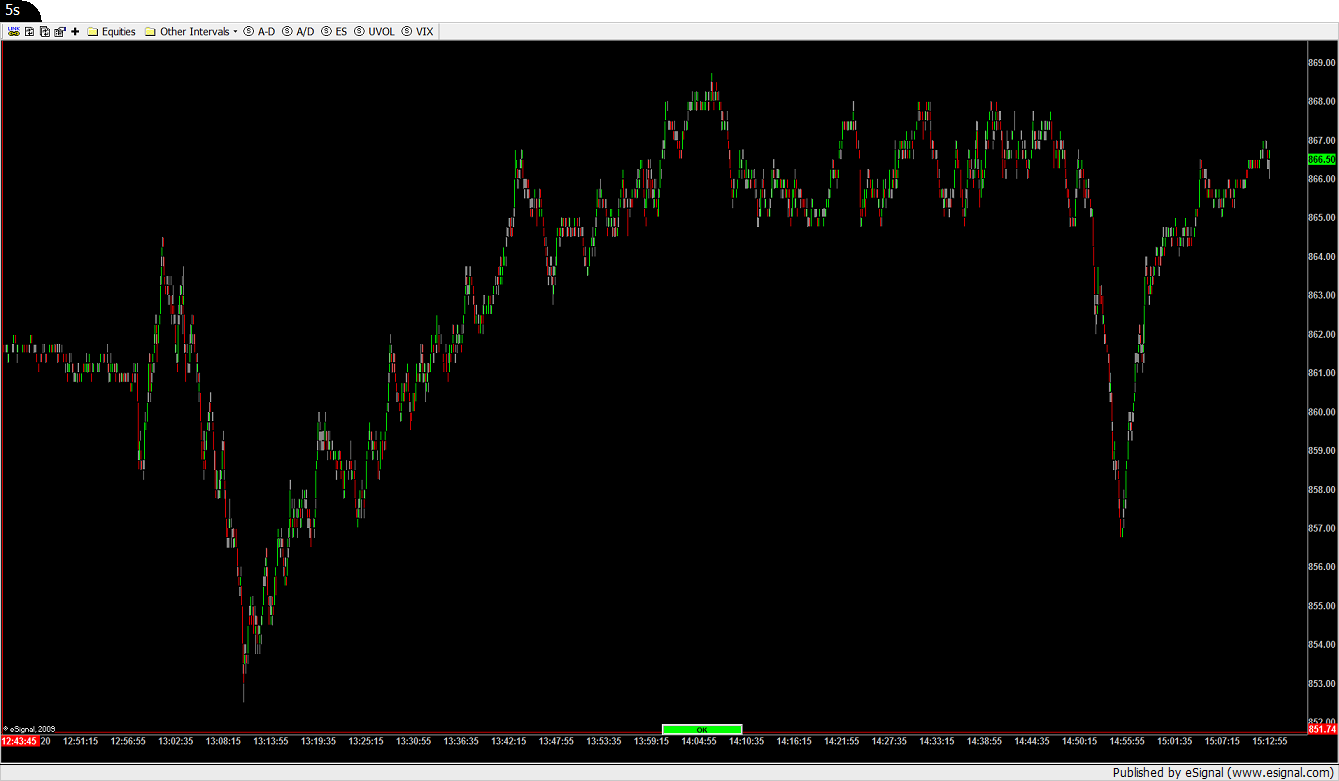
Here's the move broke down in a 5 second chart (it's an ending diagnal pattern):
Click image for original size
Good point SPQR;
I should make clear the above pattern is a 5min. signal used to capture quick moves
and not intended to give a longer term direction / move.
For those reading this thread please look for the time frame on the chart most in
this thread are short term.
I should make clear the above pattern is a 5min. signal used to capture quick moves
and not intended to give a longer term direction / move.
For those reading this thread please look for the time frame on the chart most in
this thread are short term.
Perhaps I should've read up on your thread. Apologies.
In the above chart the market is supported by a red hammer and if one sells the low of the red hammer you will still make money. Such bullish moves are "Castles in air"
quote:
Originally posted by SPQR
Perhaps I should've read up on your thread. Apologies.
No apologies needed sir
Here are some projections I ran off that dominate candle I posted 4/9. The mid point of this candle
acted as support @ the 833/834 area
From the low @ 826.50 + 1.618% = 839.75 + 2.618% = 848.00 + 3.618% = 856.50 + 4.618% = 864.75
+ 5.618% = 873.00 + 6.618% = 881.25 + 7.618% = 889.50......889.50 is todays r2/ the next to upside
897.75....when/if we move back down we may get a bounce A these areas...FWIW
Getting a move back up from that 64.00 projection that is also confirmed as a
support by the 4/29 daily candle. I posted a chart under the "5/1 topic" showing
the 4/29 candle
support by the 4/29 daily candle. I posted a chart under the "5/1 topic" showing
the 4/29 candle
I don't trade with MAs ... but recently I started looking at them .. I have set up a quad chart with different time frame of MAs .. Today at 11:30am et. all four MAs came together and in fact price hit them about the same time .. I just got started with this so I'll post what I see from time to time .. looks good so far .. My intent is to use them as a confirming tool not a primary ...
Emini Day Trading /
Daily Notes /
Forecast /
Economic Events /
Search /
Terms and Conditions /
Disclaimer /
Books /
Online Books /
Site Map /
Contact /
Privacy Policy /
Links /
About /
Day Trading Forum /
Investment Calculators /
Pivot Point Calculator /
Market Profile Generator /
Fibonacci Calculator /
Mailing List /
Advertise Here /
Articles /
Financial Terms /
Brokers /
Software /
Holidays /
Stock Split Calendar /
Mortgage Calculator /
Donate
Copyright © 2004-2023, MyPivots. All rights reserved.
Copyright © 2004-2023, MyPivots. All rights reserved.