Candle Pattern
Click image for original size
FWIW
BEXP is a fav. for my swing stock trading and a fav. pattern on the daily with a thrust breakout on 5/29 and a NR followed by another NR inside day. This ought to be a good trade either way above mondays high for long and below the low for a short.
BEXP is a fav. for my swing stock trading and a fav. pattern on the daily with a thrust breakout on 5/29 and a NR followed by another NR inside day. This ought to be a good trade either way above mondays high for long and below the low for a short.
When using trend lines I like when possible to snap the line from pattern to pattern
or to a single candle line ie. doji to doji; however if the pattern or candle line
is in the middle of the move it carries less weight
or to a single candle line ie. doji to doji; however if the pattern or candle line
is in the middle of the move it carries less weight
"Where a candle pattern or line appears within the market picture is often more important than the individual candle pattern"
Three areas a pattern carries less weight (1) middle of move (2) moments before news (3) moments before the open
A pattern that appears say 15/20 min. prior to news/open, the market is holding a price area until the event takes place. I didn't say they could not be traded but they are weak IMOH.
A pattern that appears say 15/20 min. prior to news/open, the market is holding a price area until the event takes place. I didn't say they could not be traded but they are weak IMOH.
anyone know how many times you need to post before it allows you to email another member? Thanks,.
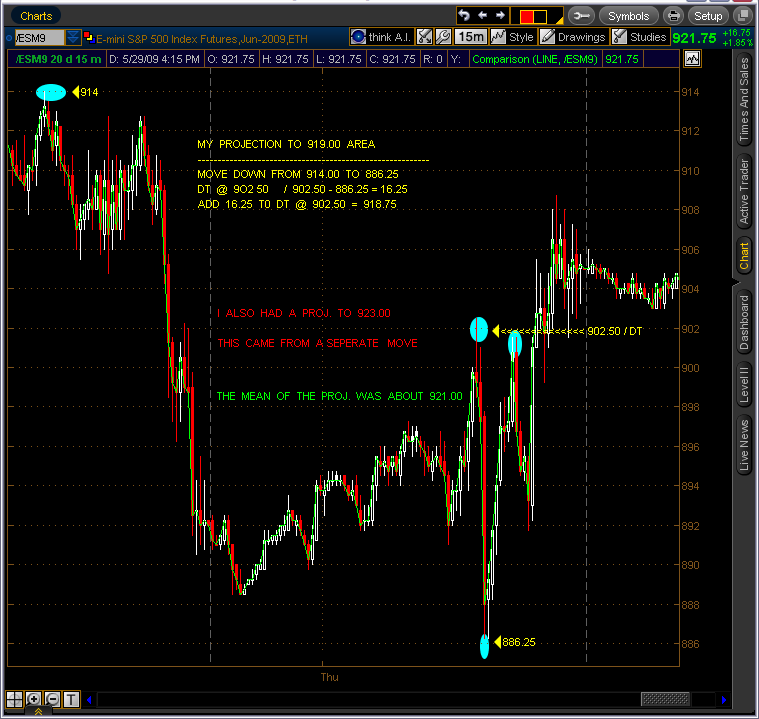
I had projections to downside today. One was to 889.75 the others 882.25
and 874.75 / I thought we would go down ahead of fomc just not this quick.
Just noticed fomc is Wed. I thought it was tomorrow...
and 874.75 / I thought we would go down ahead of fomc just not this quick.
Just noticed fomc is Wed. I thought it was tomorrow...
That 889.75 projection is now the daily pivot point...lol
key retrace # up here 906.75
I have a retrace to 926-928
I don't trade with MAs ... but recently I started looking at them .. I have set up a quad chart with different time frame of MAs .. Today at 11:30am et. all four MAs came together and in fact price hit them about the same time .. I just got started with this so I'll post what I see from time to time .. looks good so far .. My intent is to use them as a confirming tool not a primary ...
Emini Day Trading /
Daily Notes /
Forecast /
Economic Events /
Search /
Terms and Conditions /
Disclaimer /
Books /
Online Books /
Site Map /
Contact /
Privacy Policy /
Links /
About /
Day Trading Forum /
Investment Calculators /
Pivot Point Calculator /
Market Profile Generator /
Fibonacci Calculator /
Mailing List /
Advertise Here /
Articles /
Financial Terms /
Brokers /
Software /
Holidays /
Stock Split Calendar /
Mortgage Calculator /
Donate
Copyright © 2004-2023, MyPivots. All rights reserved.
Copyright © 2004-2023, MyPivots. All rights reserved.