Wednesday 01-02-08
starting longs at 1469..1474 is first target...will be watching hour break down if needed to add
support held... trading back up into the range as we head for the close of RTH...
no but probably should..lol....I just use my free IB data and I have a version of Investor R/T that I usually look at after the market closes.
A key point: Look how they defended the 1450...very cool...a trade below 1445 would negate the upside power in my world.....I find this idea more effective when these tests come in the real time session...what happens in the overnight doesn't seem to have as much effect on this concept...just another "distinction" in progress...
also they acheived a full objective of the Initial balance when they traded it to the 1450 which amazed me and obviously caught me on the wrong side of things...
quote:
Originally posted by gio5959
bruce - do you use esignal?
i created an efs that will spot the triples automatically on any 5min index
Gio, you should see what happens when you get three matching highs or lows on the one minute in the S&P..real time session.like today...they get traded through a very high percent of the time..must be consecutive though!!! good luck and let me know how it goes if you track it...
that key 30 minute close came in at 51.50...not very impressive..so looks like we have a key zone to target on any longs tomorrow up in the 1468 area...that's the only good thing when a market trends away from you...sometimes you get good targets to aim for...I'm hoping for a lower open.....to buy of course....the obvious pitfalls of having a market bias////comes with the territory
quote:
Originally posted by BruceM
Gio, you should see what happens when you get three matching highs or lows on the one minute in the S&P..real time session.like today...they get traded through a very high percent of the time..must be consecutive though!!! good luck and let me know how it goes if you track it...
Yes, I can track that - this is the 1min ES chart and that dark green dotted line is the only triple that 'wasnt' traded back today - you can see the approx price on the right margin
[file]ES.jpg,126,,0[/file]
Today's action in the ES. The second Single Print did a fantastic job of providing a place to short with the Developing Value Area High coming down just above it at the time that short would of been taken. Were there any other reasons that we could have shorted there? Any other broken support lines or subsequently developed resistance lines that would have created a cluster with those 2?
Click image for original size
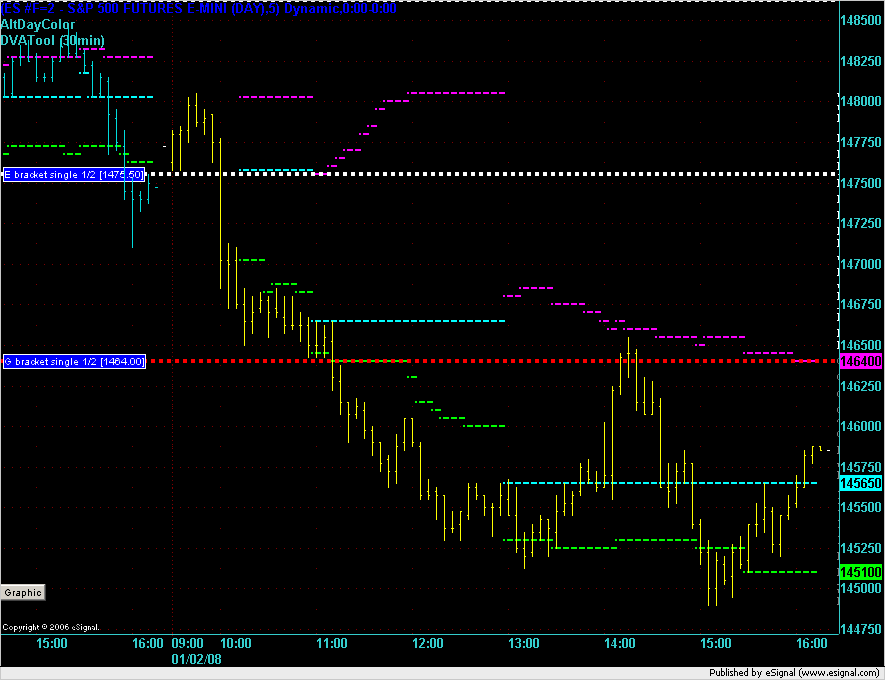
you had the hour low right there and we were at the 50% mark of the real time session range..Gio pointed out that there were triples that developed and were broken there earlier in the session....
quote:
Originally posted by day trading
Today's action in the ES. The second Single Print did a fantastic job of providing a place to short with the Developing Value Area High coming down just above it at the time that short would of been taken. Were there any other reasons that we could have shorted there? Any other broken support lines or subsequently developed resistance lines that would have created a cluster with those 2?
Thanks Bruce!
Emini Day Trading /
Daily Notes /
Forecast /
Economic Events /
Search /
Terms and Conditions /
Disclaimer /
Books /
Online Books /
Site Map /
Contact /
Privacy Policy /
Links /
About /
Day Trading Forum /
Investment Calculators /
Pivot Point Calculator /
Market Profile Generator /
Fibonacci Calculator /
Mailing List /
Advertise Here /
Articles /
Financial Terms /
Brokers /
Software /
Holidays /
Stock Split Calendar /
Mortgage Calculator /
Donate
Copyright © 2004-2023, MyPivots. All rights reserved.
Copyright © 2004-2023, MyPivots. All rights reserved.