RO
roofer
Rep: 3,689
Posts: 3,574
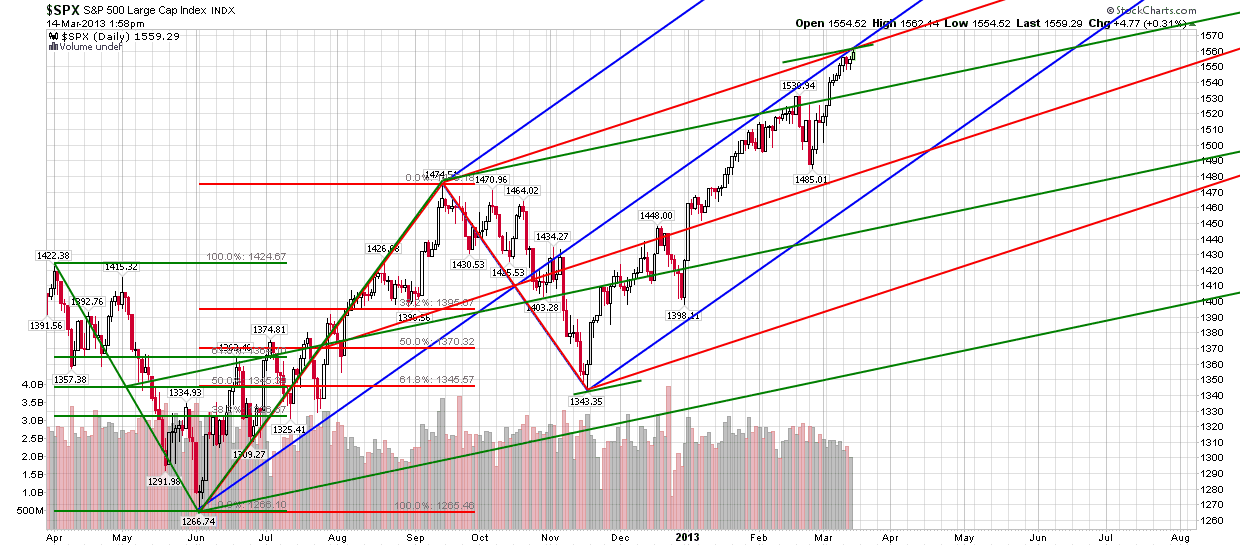
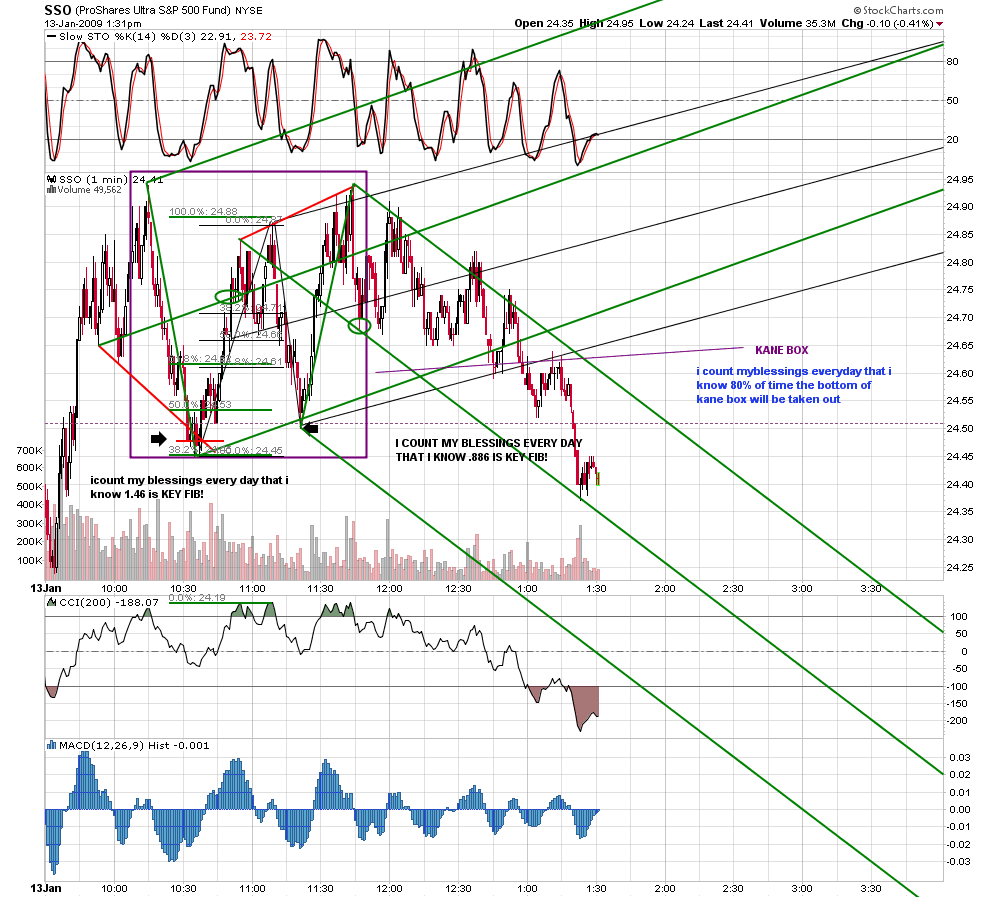
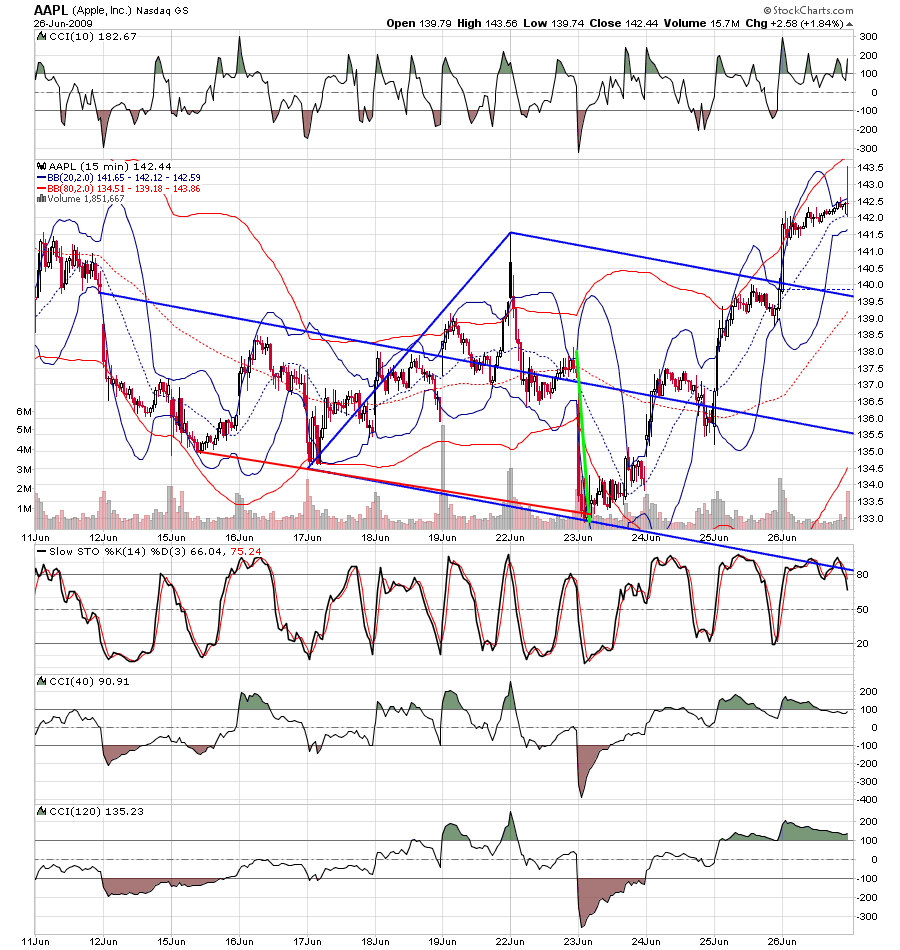
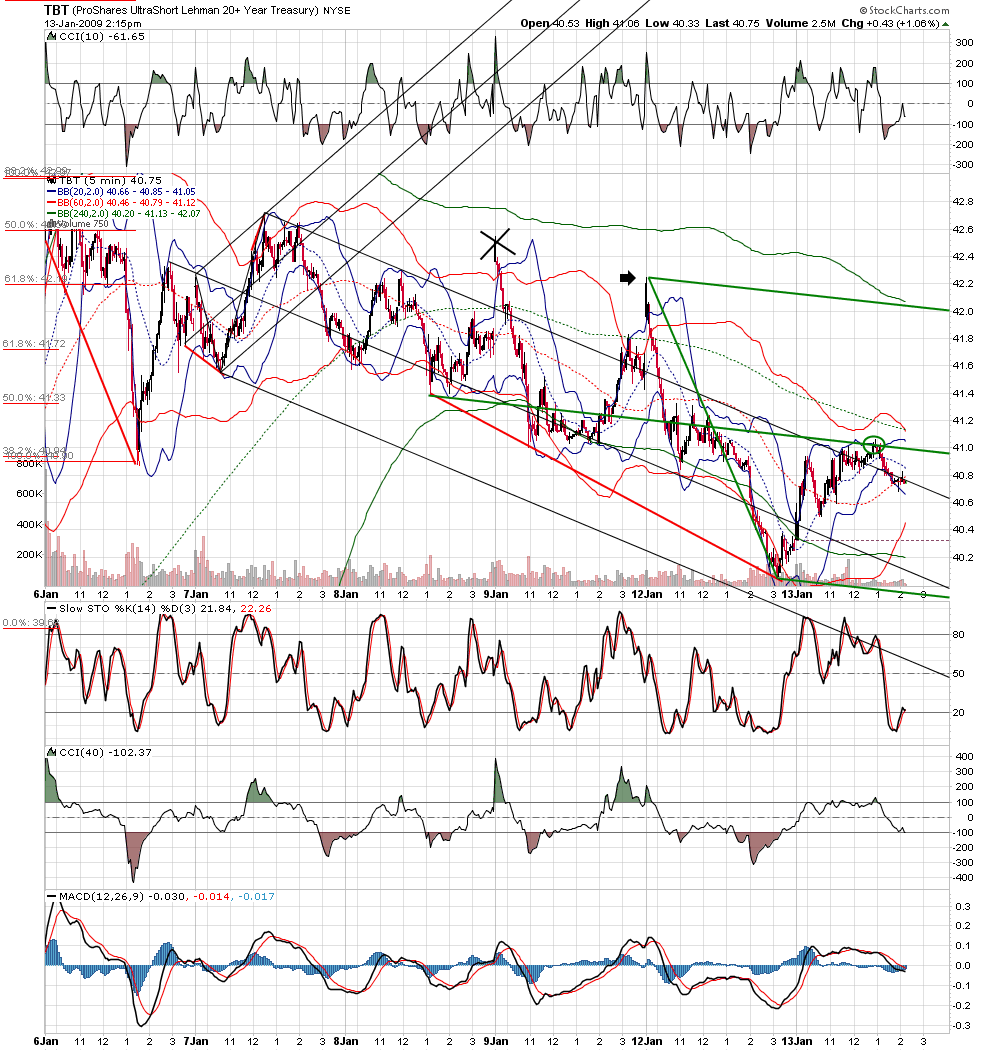
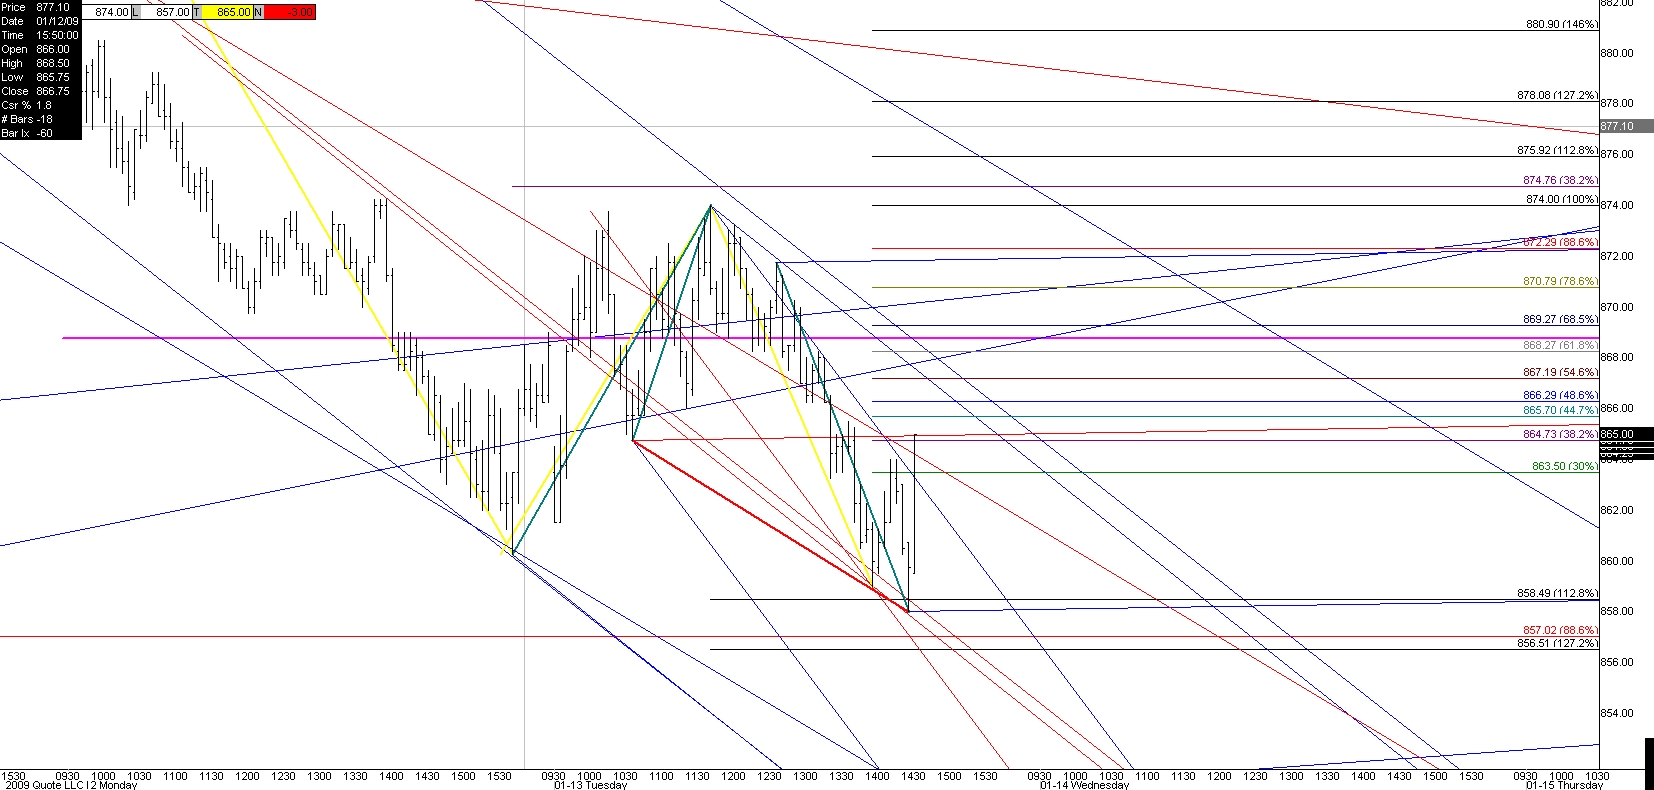
craft- i have been posting my best work here. i guess this is my cave! i am sure you noticed that all three charts showed what is now my highest probability setup.draw a simple line connecting 3 pivots that ends in fib box. anchor medianline set on that line. price will go to medianline 90% of time....
RO
roofer
Rep: 3,689
Posts: 3,574
common sense and counting my blessings.... note how trade triggered as kane pattern completed....no matter what, i am not going to trade against the box...
Click image for original size
JI
jimkane
Rep: 3,058
Posts: 33,089
Clear as crystal, roofer. I, too, evolved to seeing the flatter set as the better one for me as I played with this.
Another really cool part for me is that there are some things from my work that point to my 'first thrust' area, things I only show in mentoring, and I am finding the geometry of this approach is pointing to this same spot many times. What I mean is, not only is this technique a wonderful stand alone technique, it also can be used by me for confirming a first thrust area for my methodology, and geometrically it makes sense. I have been experimenting, and using, ML's for this very thing for years now, not anything I have shown anyone, but this approach seems to add a lot to that application, it seems to find that 'first thrust' frequency many times when things are set up a certain way, a way which is easy to spot once I saw it. Very cool.
Another really cool part for me is that there are some things from my work that point to my 'first thrust' area, things I only show in mentoring, and I am finding the geometry of this approach is pointing to this same spot many times. What I mean is, not only is this technique a wonderful stand alone technique, it also can be used by me for confirming a first thrust area for my methodology, and geometrically it makes sense. I have been experimenting, and using, ML's for this very thing for years now, not anything I have shown anyone, but this approach seems to add a lot to that application, it seems to find that 'first thrust' frequency many times when things are set up a certain way, a way which is easy to spot once I saw it. Very cool.
MR
mreiserer
Rep: 110
Posts: 2,220
yes very clear. I am intrigued by the lines that cut through price rather than take three consecutive highs or lows.
It appears that they are more effective when the second pivot tests from the same side as the third. Any thoughts on that?
It appears that they are more effective when the second pivot tests from the same side as the third. Any thoughts on that?
RO
roofer
Rep: 3,689
Posts: 3,574
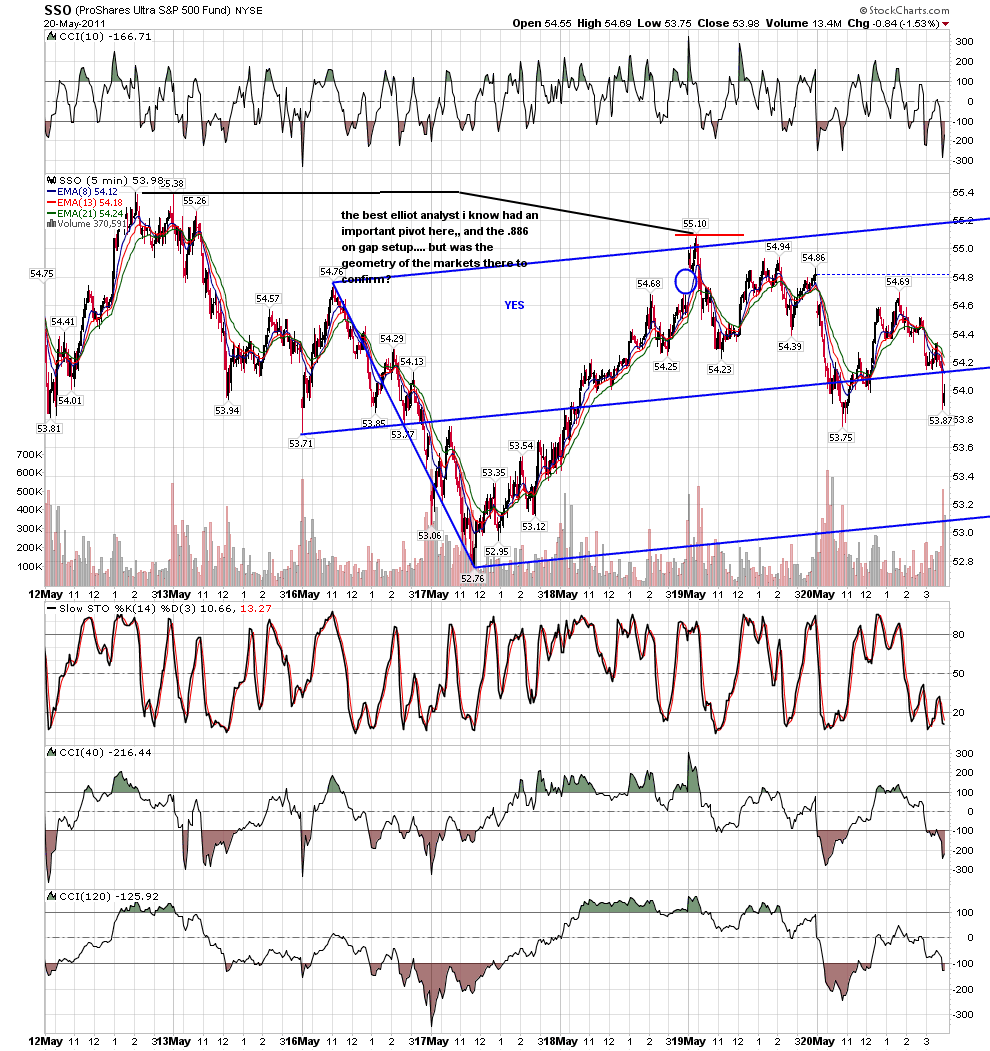
m- i think you got it!this is good.here is my slightly different thought process... i did not add1.128.
Click image for original size
MR
mreiserer
Rep: 110
Posts: 2,220
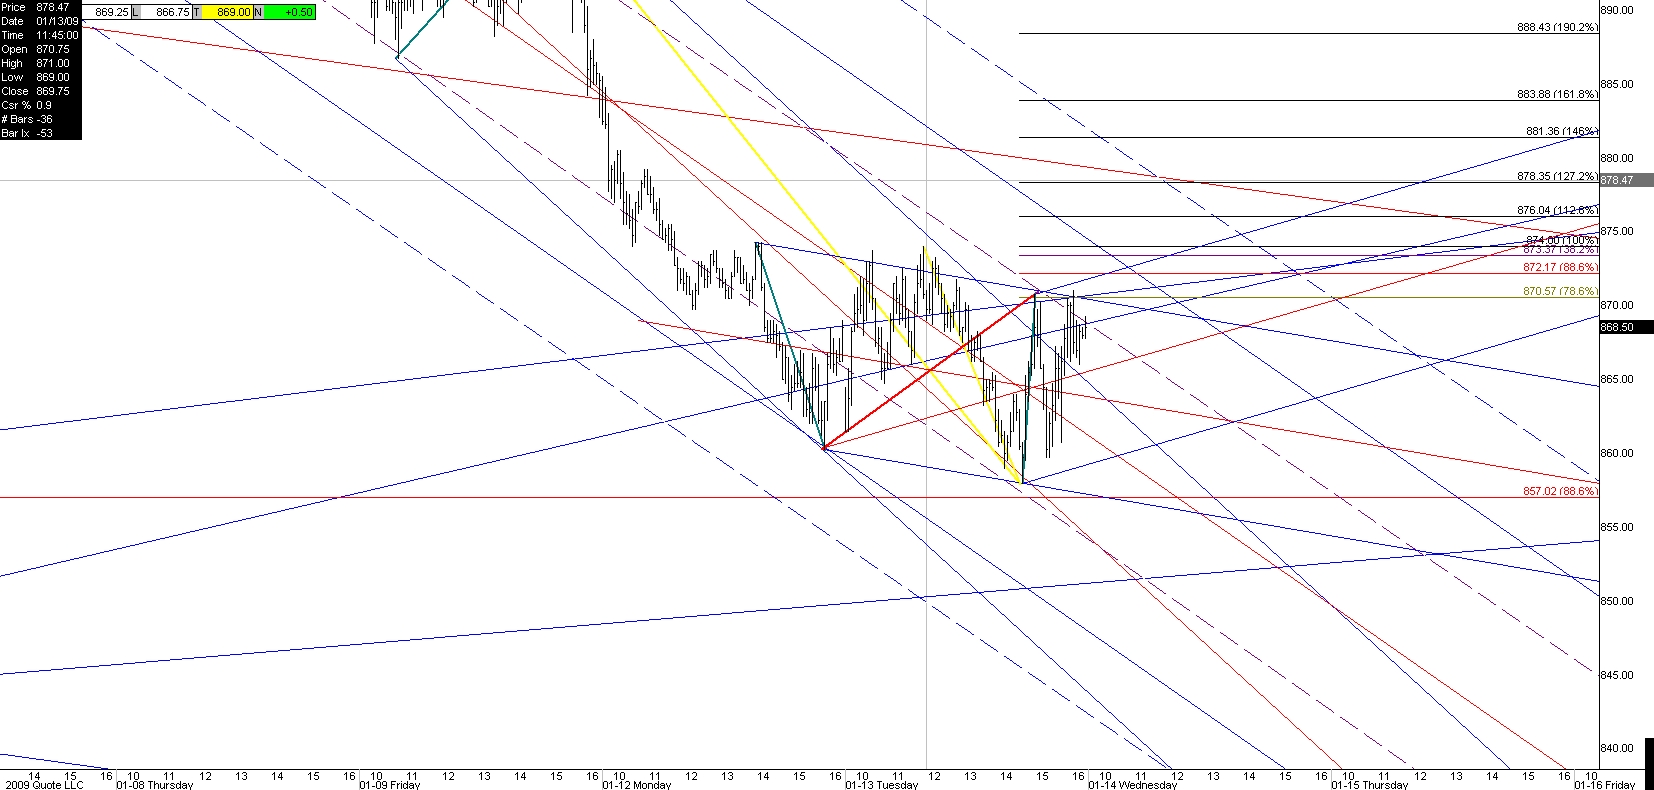
Here is the one that followed. Perfect KT ABCD.
Click image for original size
CR
craft
Rep: 100
Posts: 206
beautiful roofer. You have captured a repeatable moment in time with the correct stop placement and target. No easy task...My hats off to you and I truly thank you.
yes a pattern within a pattern. It hit me after I posted the Notes chart.
I too ask why does price pivot there instead of meeting the ML. A/R lines led me to be able to project every pivot on the board minor and major. They have the same probabilities Median Lines have if you choose the correct moment in time or whats qualitatively different. It can be clumsy but you have designed out the ambiguity with your setup.