RO
roofer
Rep: 3,689
Posts: 3,574
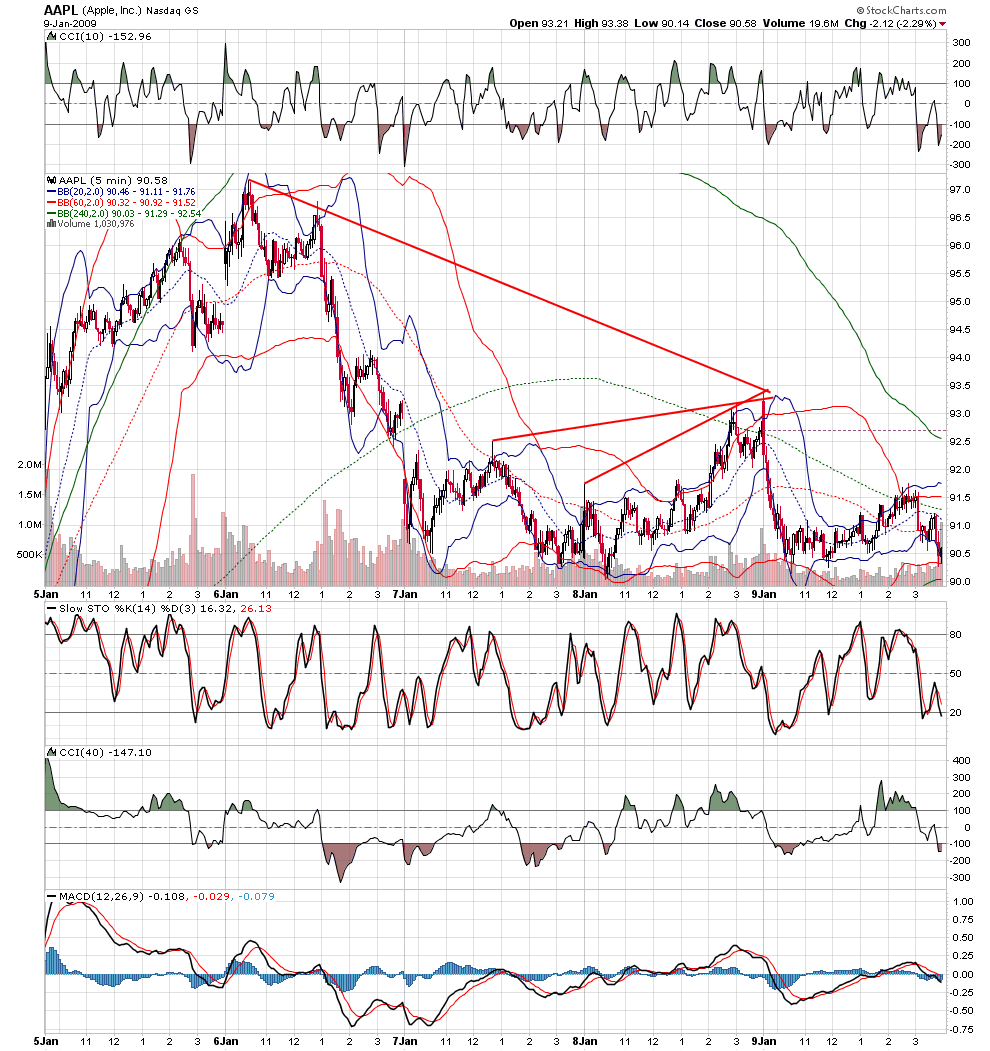
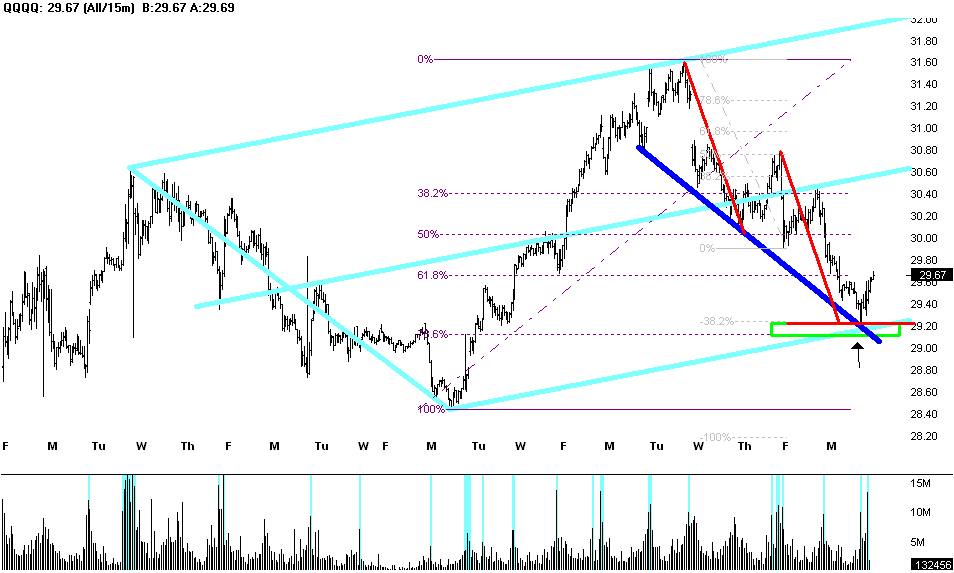
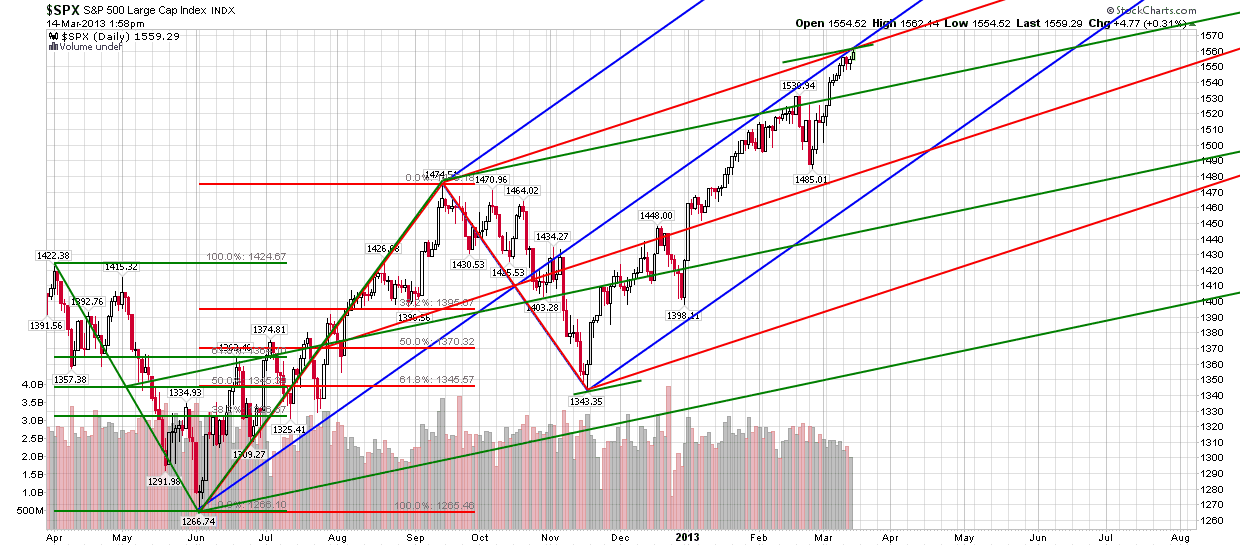
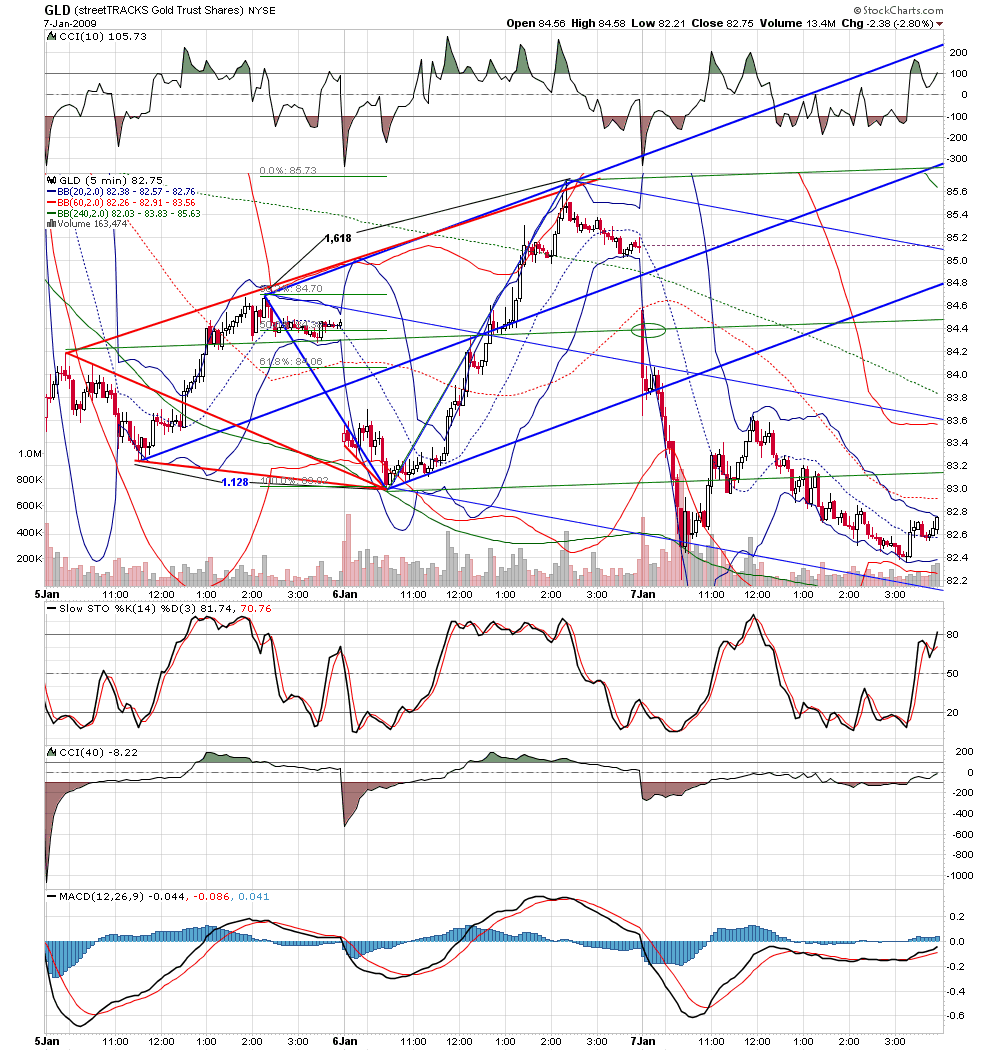
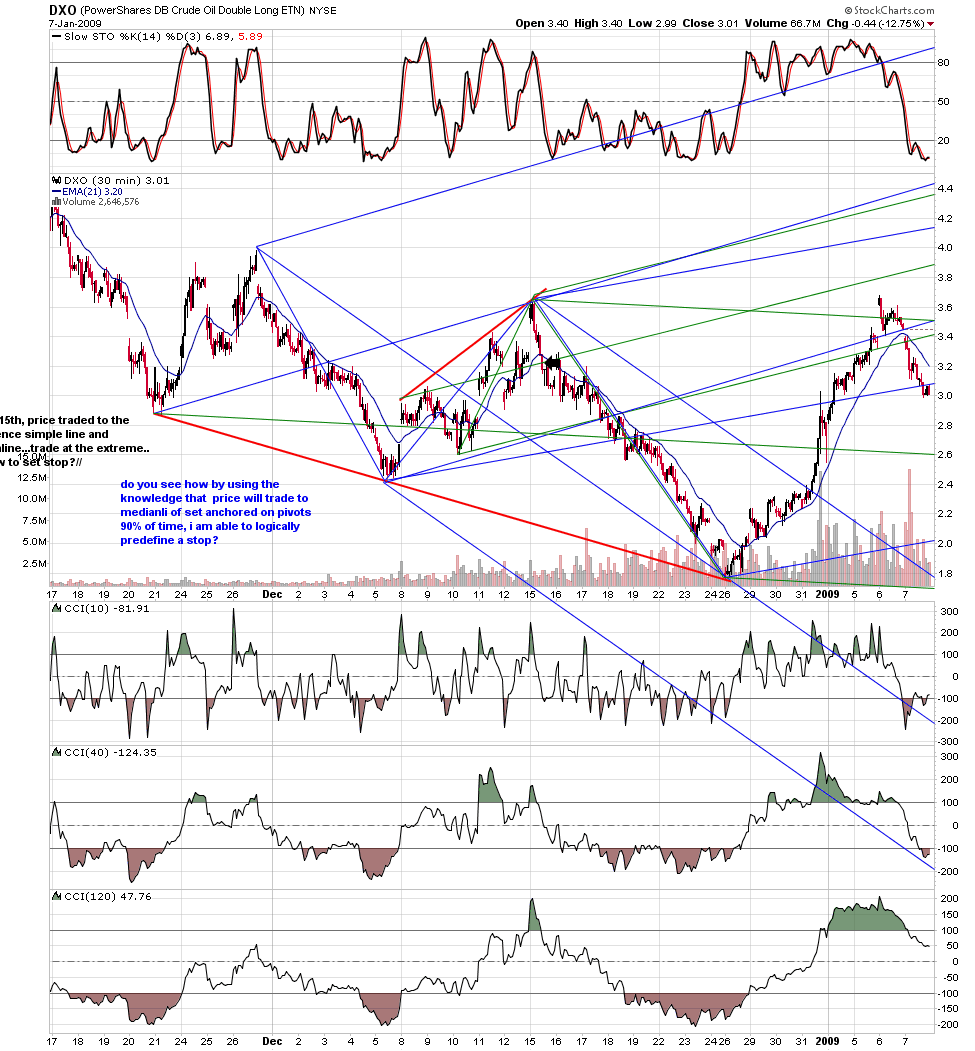
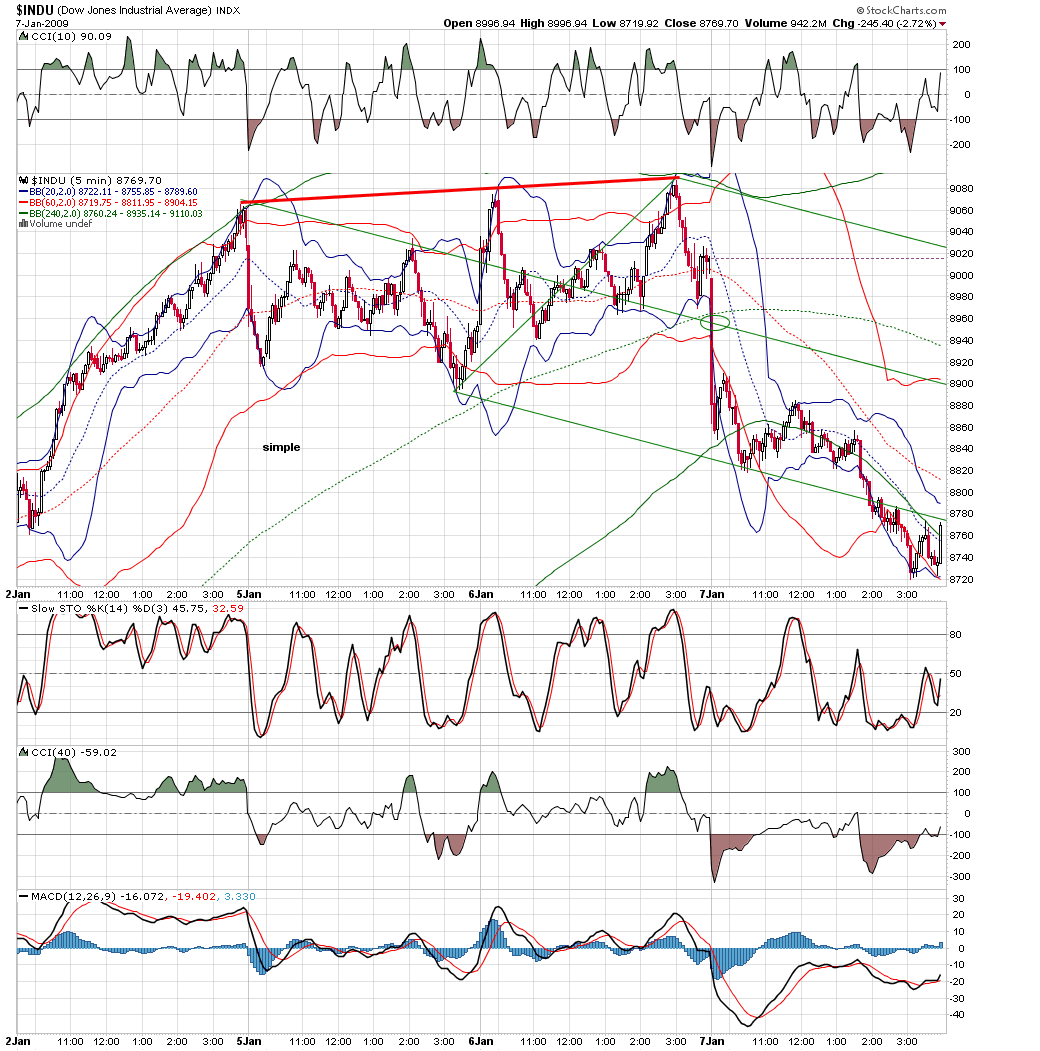
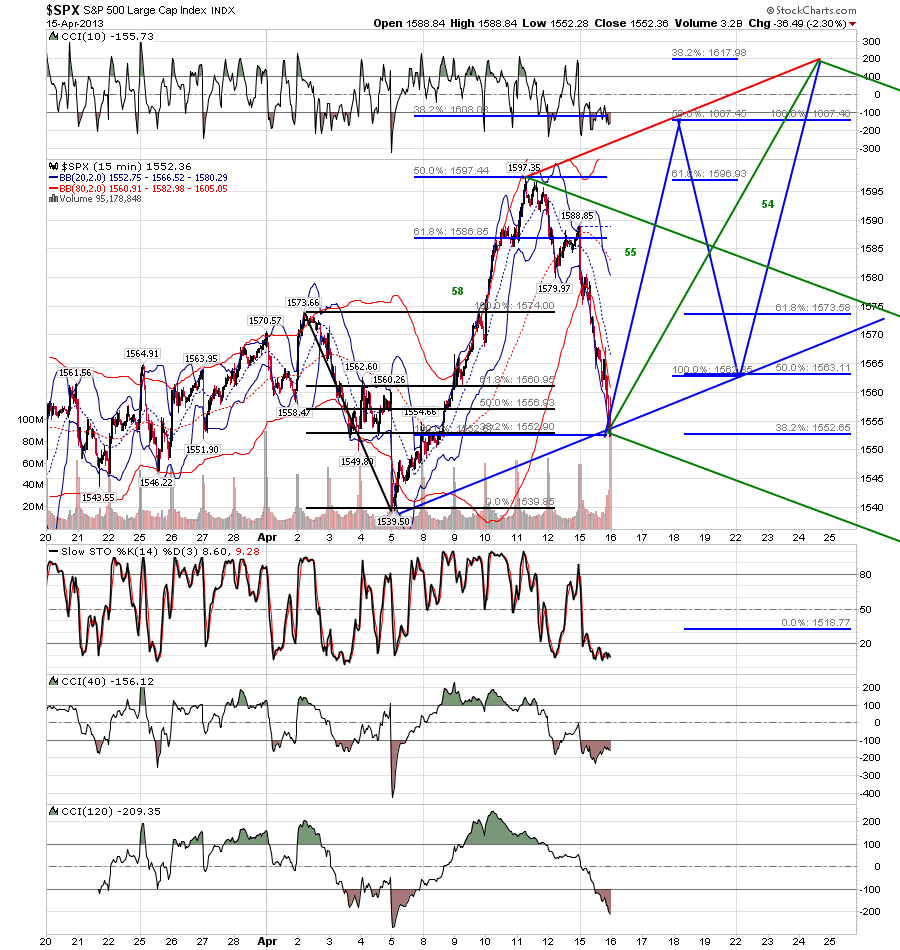
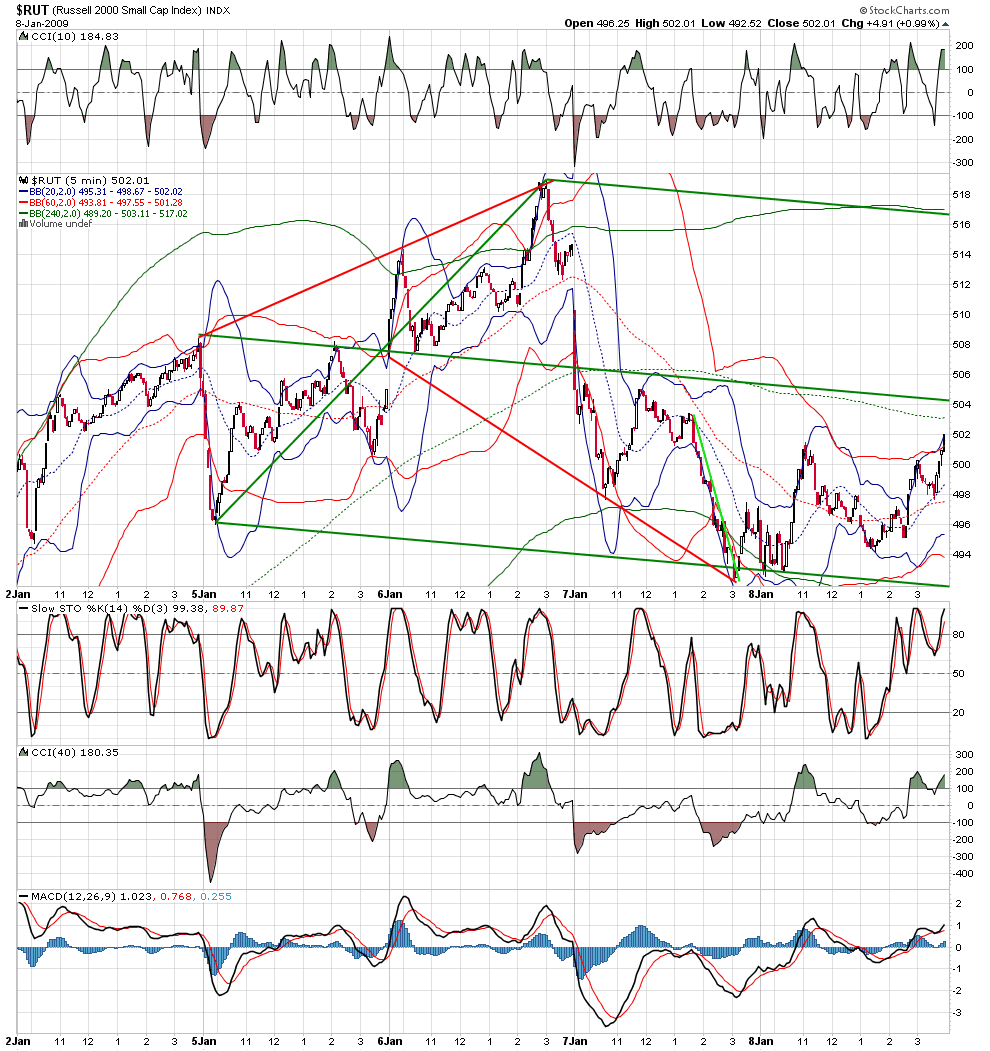
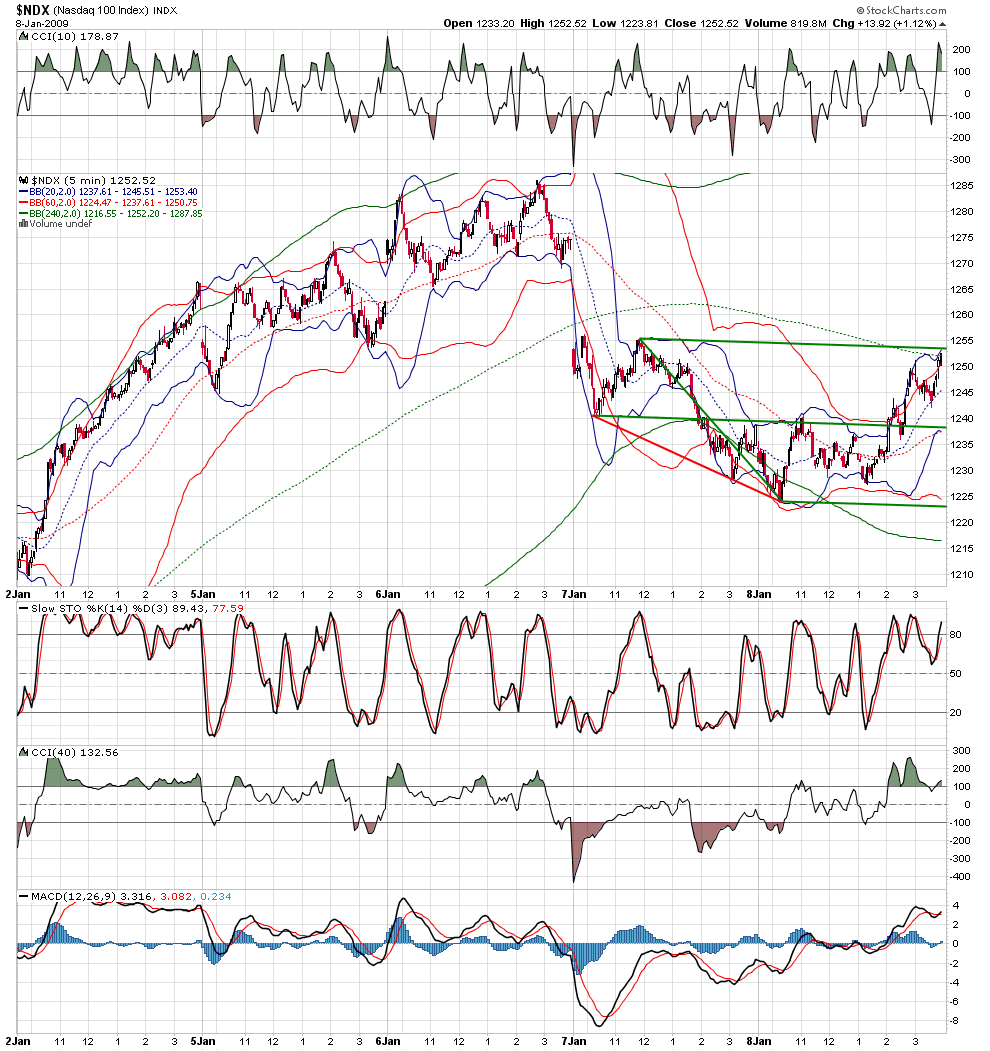
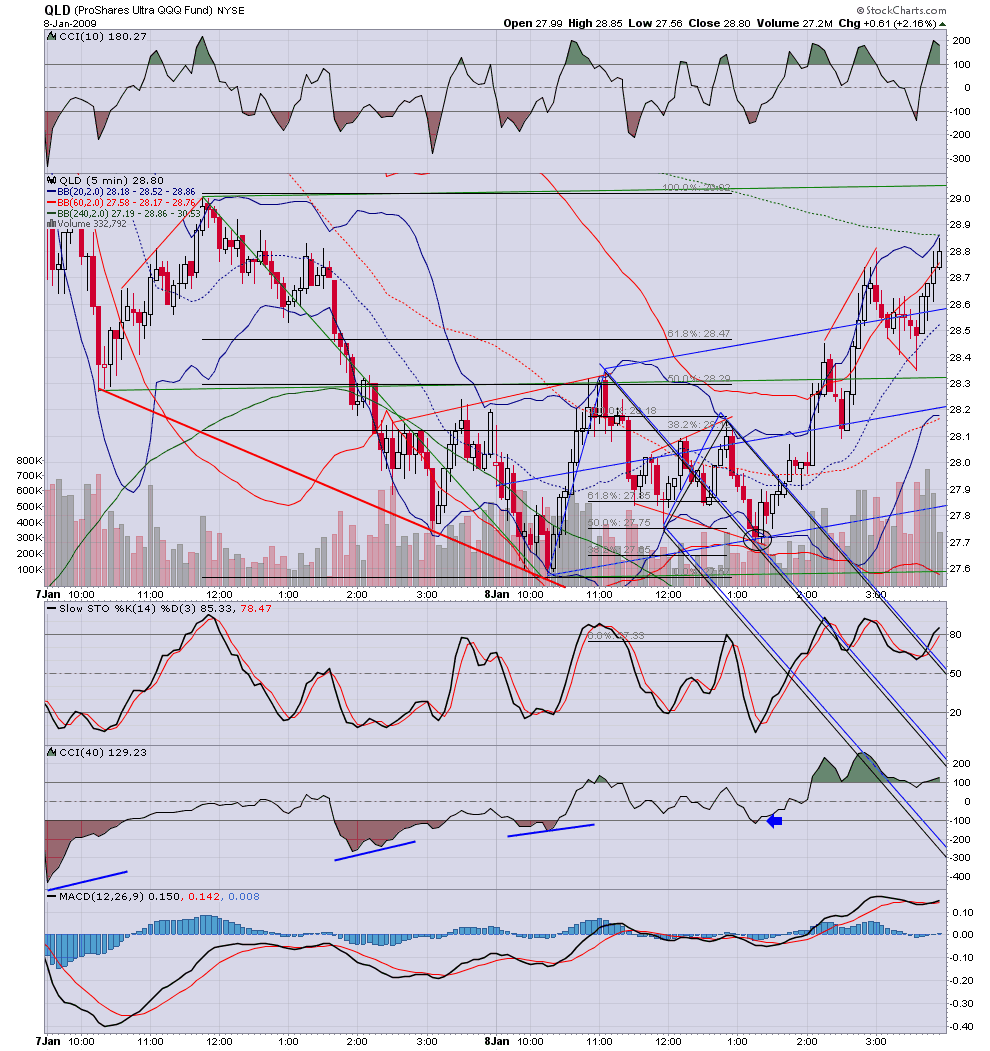
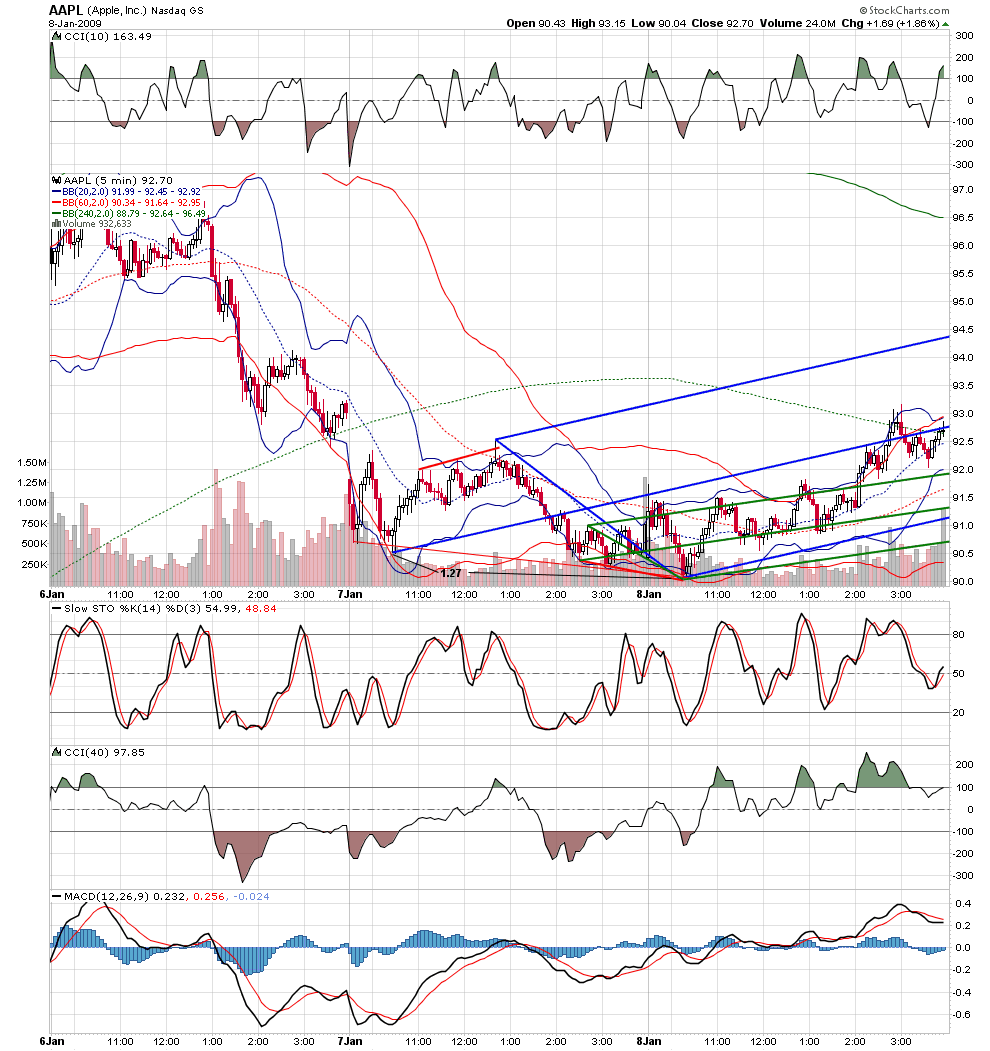
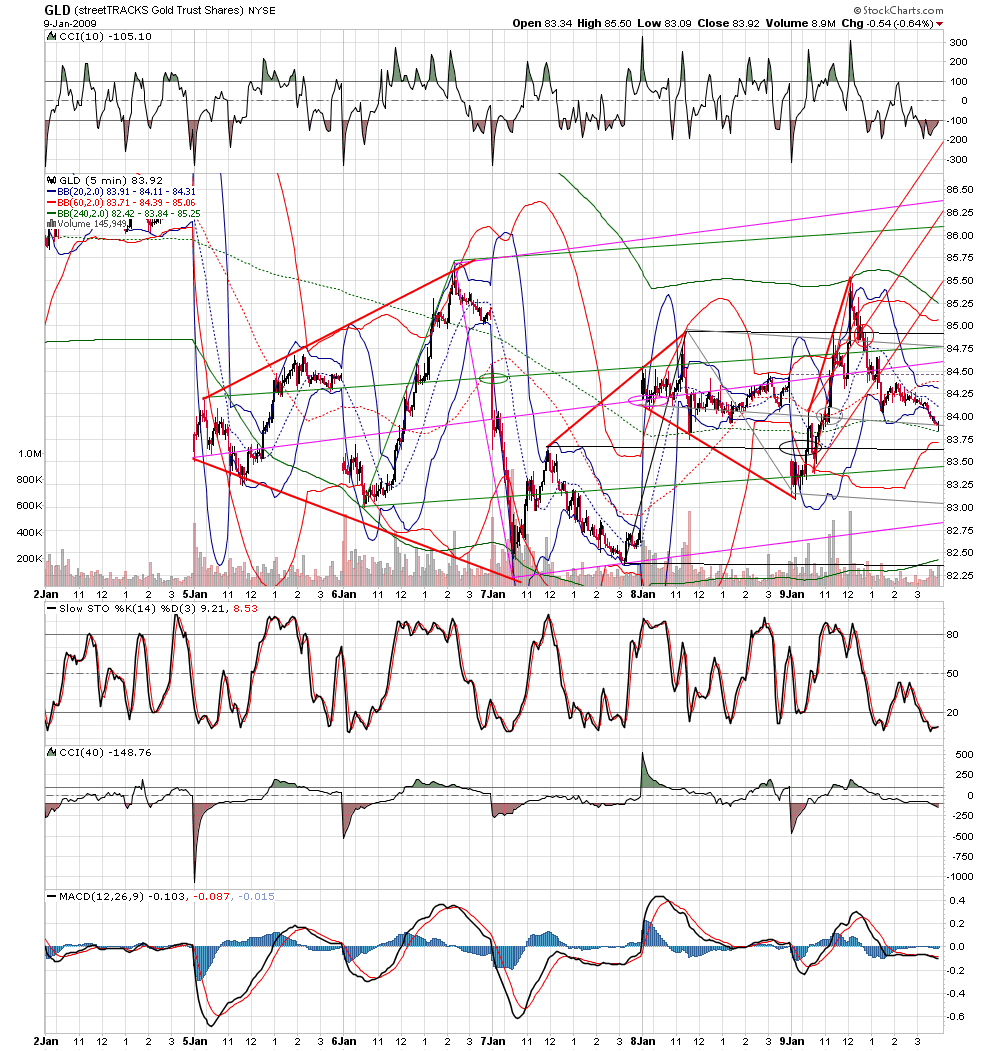
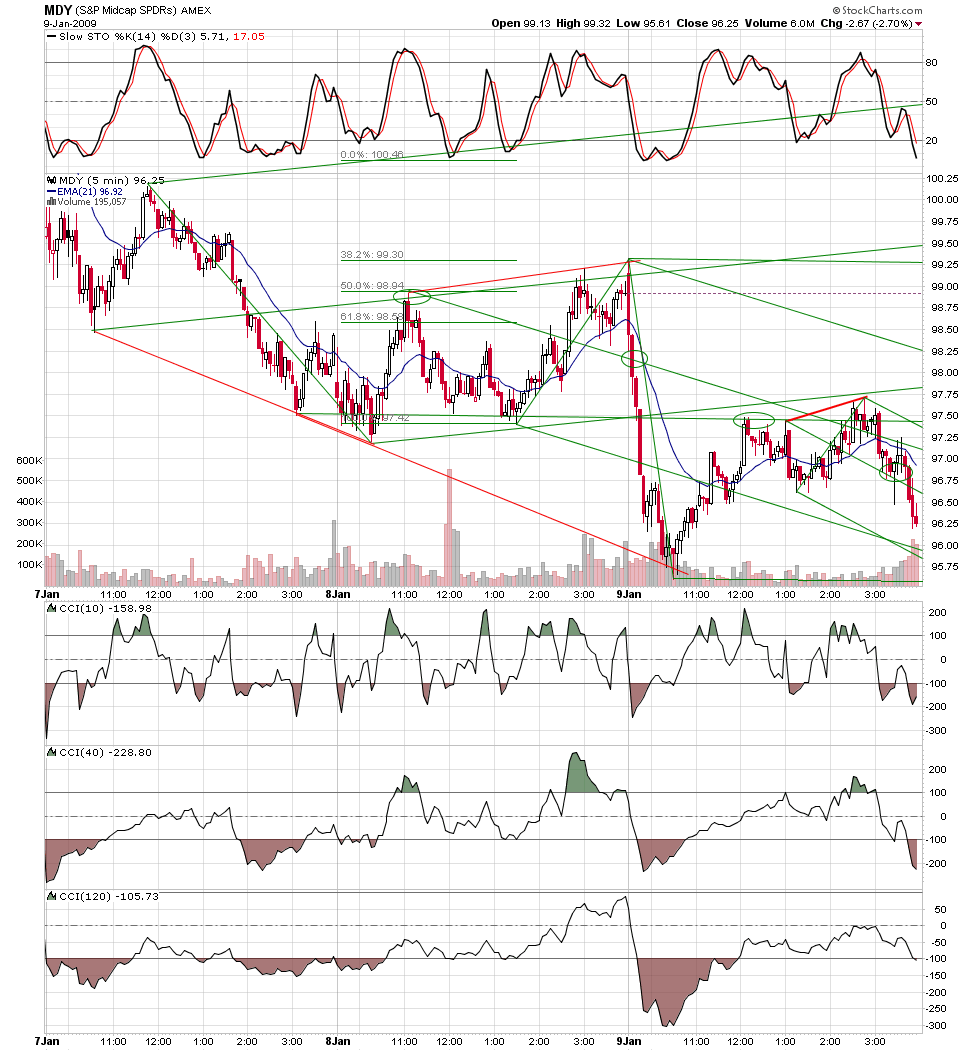
craft- i have been posting my best work here. i guess this is my cave! i am sure you noticed that all three charts showed what is now my highest probability setup.draw a simple line connecting 3 pivots that ends in fib box. anchor medianline set on that line. price will go to medianline 90% of time....
RO
roofer
Rep: 3,689
Posts: 3,574
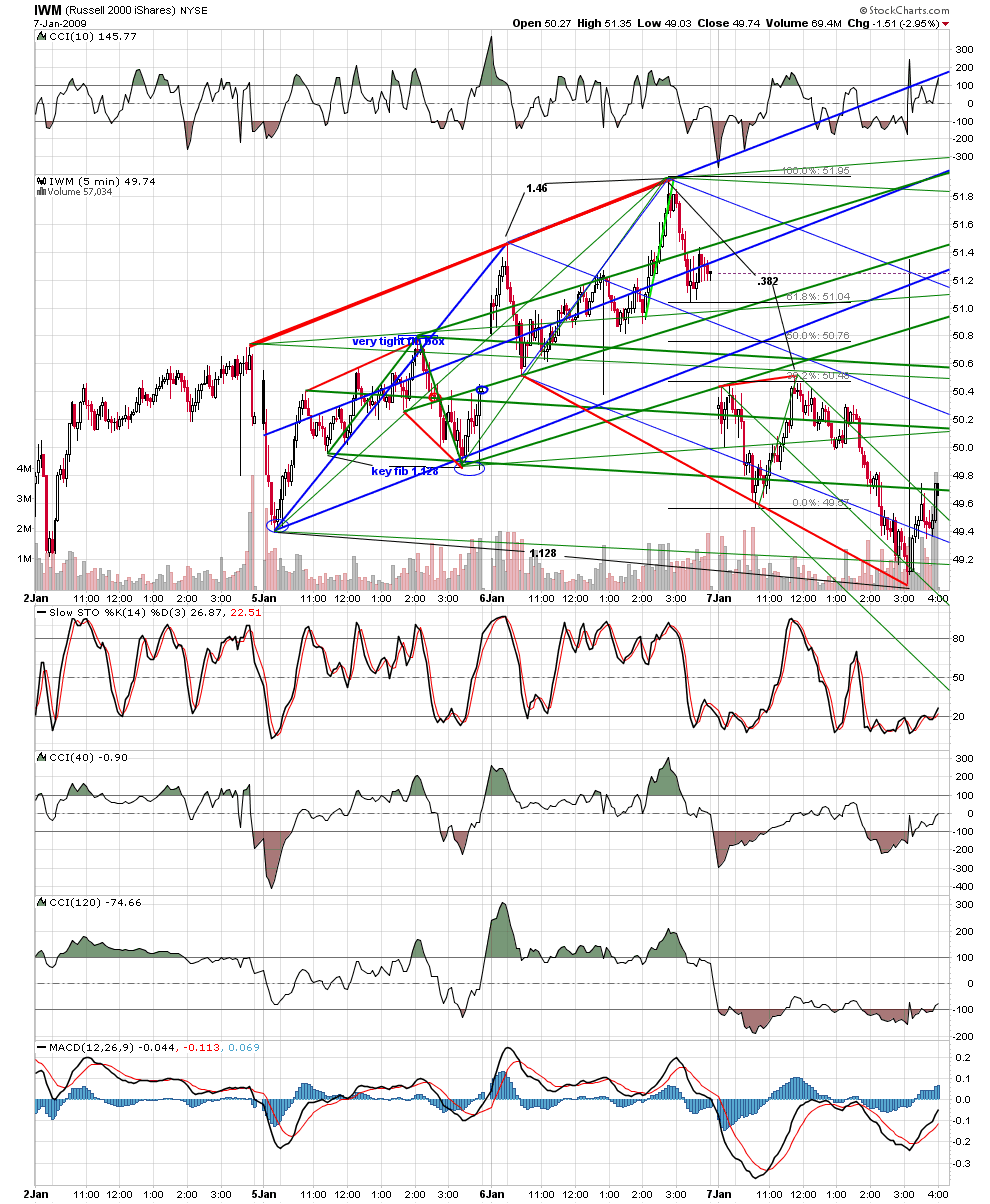
again.. at the very simplest i am using the simple line as a sorting tool... we here at kane trading have a huge advantage over all other traders... we know the fib!!!and now you all know that a simple line based on 3 points that ends at fib box or key fib is qualitatively different.again i have absolutely no problem with using any other medianline technique....but as a starting point, as a sorting tool the simple line is it.. thus i say'' i rarely take a trade anymore that does not start with the simple line.'' charts
Click image for original size
Click image for original size
CR
craft
Rep: 100
Posts: 206
apologies not necessary. I always new you were a generous fishing writer. The gift has never been the packaged what works set up.
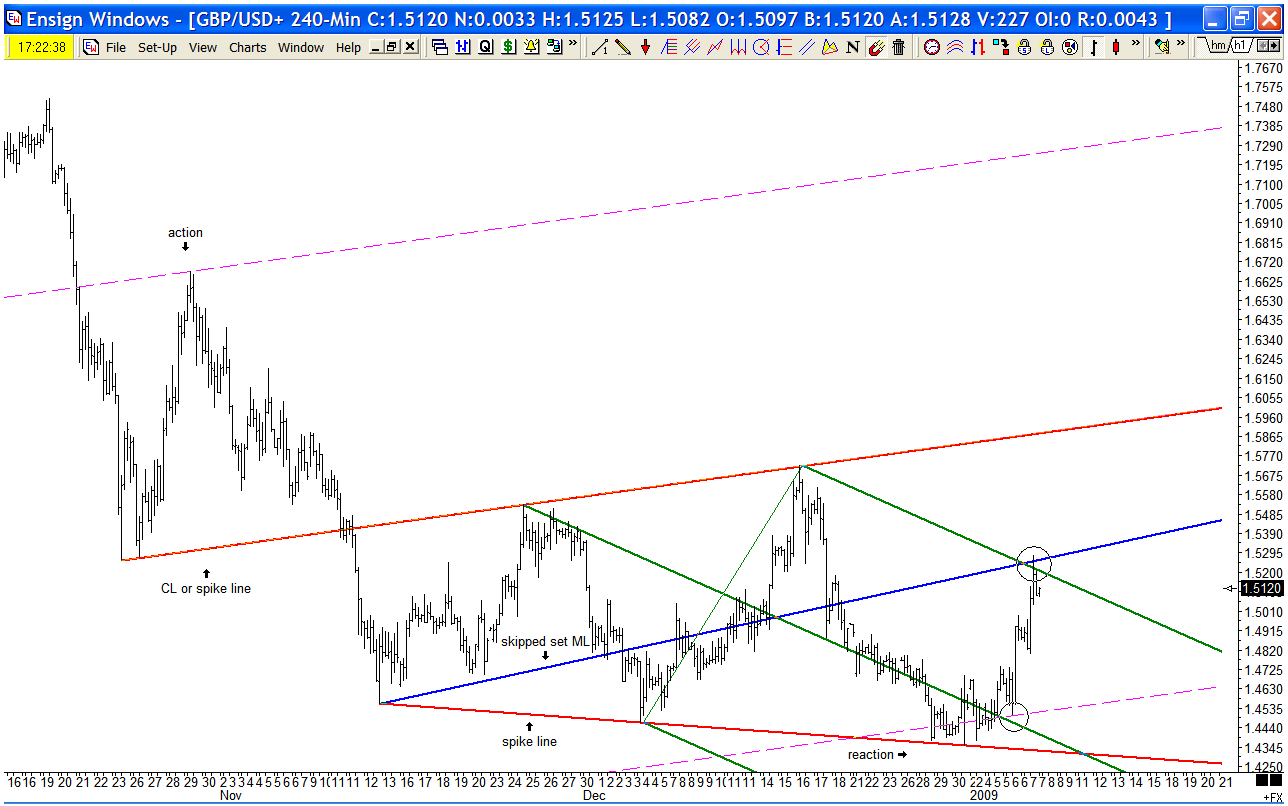
Its the discussion with someone thats speaks the same language(Being someone more experienced is a bonus for me). someone that works just as hard to discover the things I'm sure the originators were keenly aware of. Maybe they were holding back or maybe they just couldn't convey there language to a general public. Tim says Andrews created Median lines course he couldn't get people to grasp A/R lines.
I don't try to take away from your good work. Just try to find whats important for my own work. Our first discussions were about Multipivot Lines and much of my charts now grew from that.
I look at your spike line and see: This is qualitatively different. This captures the behavior of the current set of Buyers/Sellers for a certain period of time. I see: a centerline: I see: a multi pivot line. I ask: does this project somewhere? Was this projected from somewhere? What does it mean if it stops tracking? What repeatable behavior do I see that I can fashion a setup around?
In the end theory wont cut it and you have to come up with what works. I have a few but not to the point i could convey it easily. I cant even convey what I want to say here easily.
Click image for original size
RO
roofer
Rep: 3,689
Posts: 3,574
i thought i would show this updated... it is NOT IN ANY WAY MY INTENT to broaden the discussion to finepoints of theory and get sidetracked from relentless showing what i believe is the easiest way take money out of the market..but the frequency of the sl sets is often the primary frequency....
Click image for original size
RO
roofer
Rep: 3,689
Posts: 3,574
simple... if there is brilliance, it is in the simplicity.
Click image for original size
RO
roofer
Rep: 3,689
Posts: 3,574
and so it goes... will it make it once again?stay tuned....
Click image for original size
MR
mreiserer
Rep: 110
Posts: 2,220
Not just your charts but also my own comparably limited experience has left me with the conviction to only look for setups at a significant .382/.447,.886 or 1.128 and a line, ideally augmented by a Kane pattern. I'll be happy to let all the rest pass me by.Simplicity.
RO
roofer
Rep: 3,689
Posts: 3,574
sorting through the noise
Click image for original size
Click image for original size
Click image for original size
Click image for original size
RO
roofer
Rep: 3,689
Posts: 3,574
i hope everyone is grasping what i am driving at...instead of theory, instead of the agony of the uncertainty of whether you have chosen the correct set or the correct stop. i am offering one thing that i know for myself a simple line drawn connecting 3 pivots that ends at fib carries with it the frequency that a medianline set anchored on that line will have price go to the medianline 90% of time.the setup turnclassic medianline theory on its head. i have shifted from complexity and theory to simplicity and certainty...perhaps you should come along too.
Click image for original size
Click image for original size
Click image for original size