RO
roofer
Rep: 3,689
Posts: 3,574
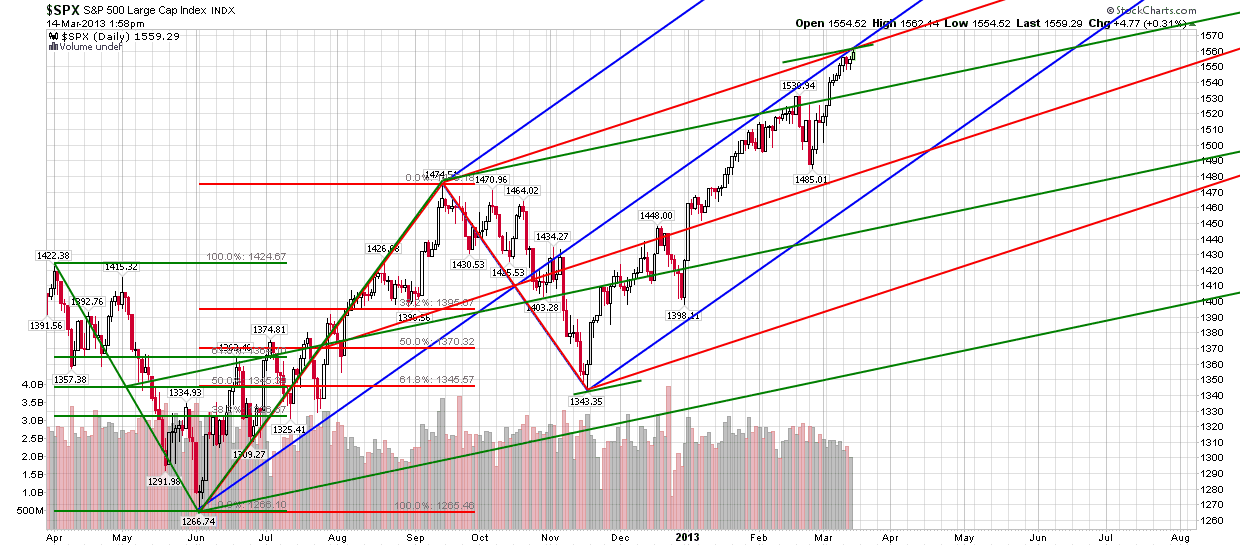
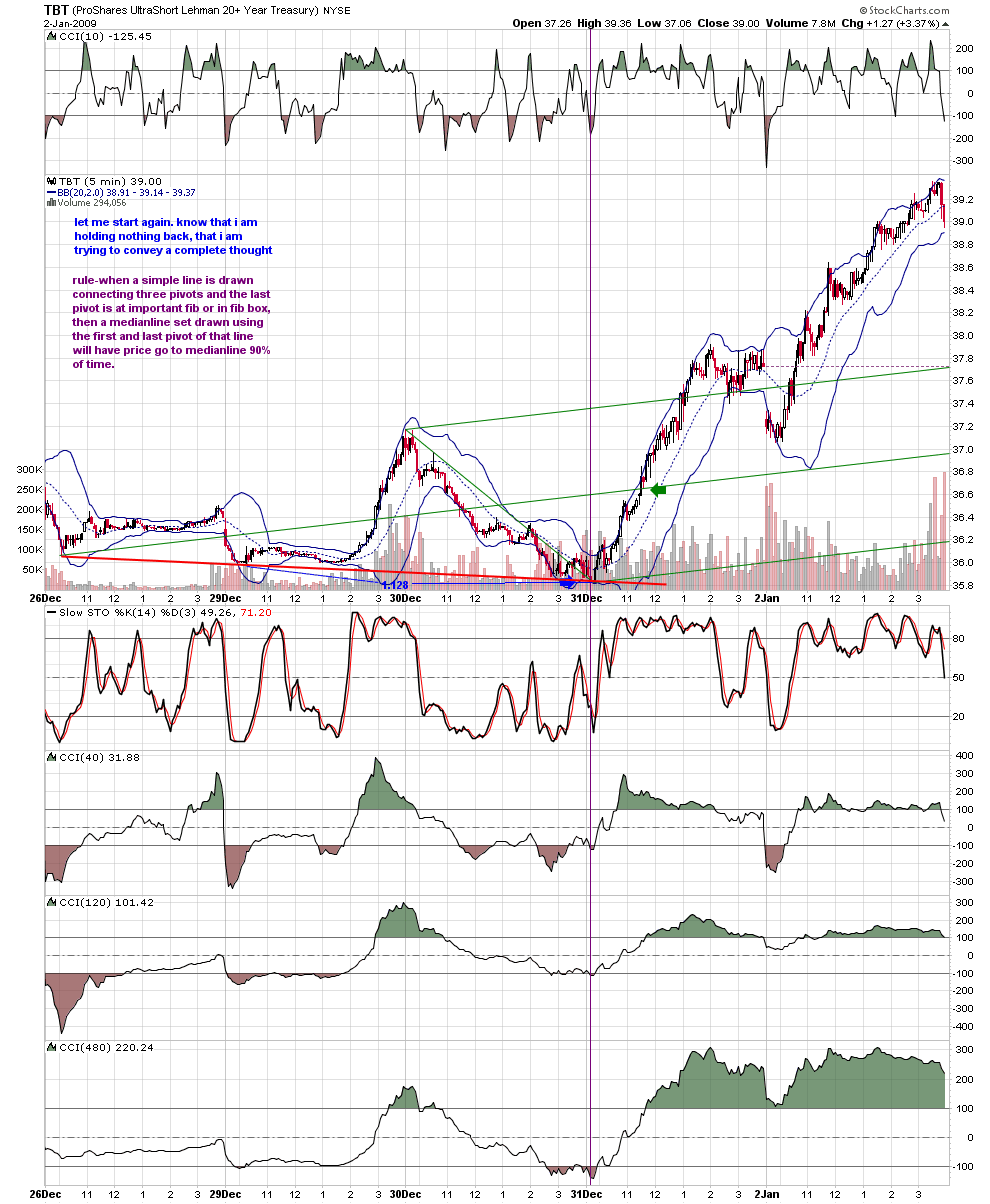
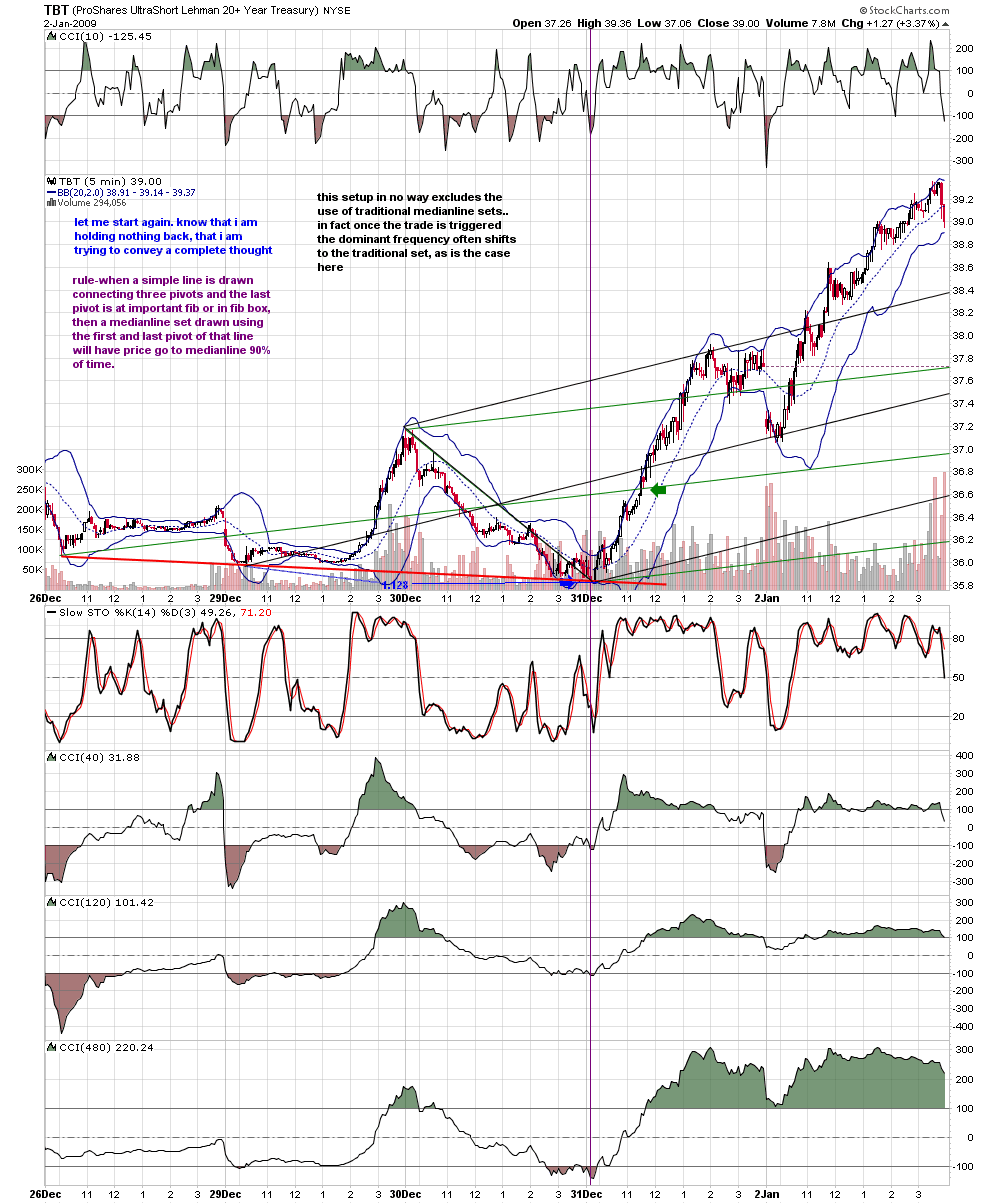
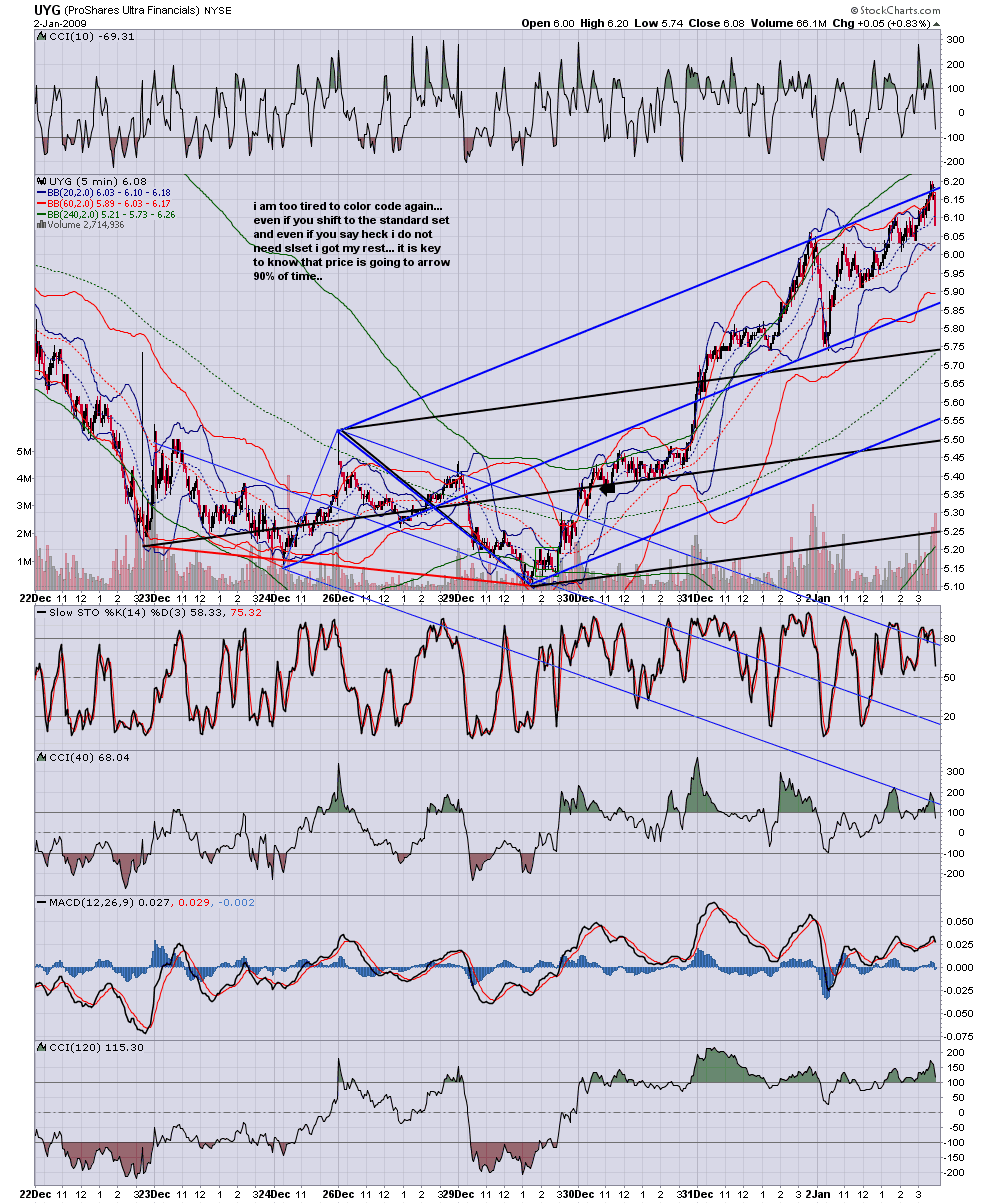
craft- i have been posting my best work here. i guess this is my cave! i am sure you noticed that all three charts showed what is now my highest probability setup.draw a simple line connecting 3 pivots that ends in fib box. anchor medianline set on that line. price will go to medianline 90% of time....
RO
roofer
Rep: 3,689
Posts: 3,574
charts-
Click image for original size
Click image for original size
Click image for original size
Click image for original size
RO
roofer
Rep: 3,689
Posts: 3,574
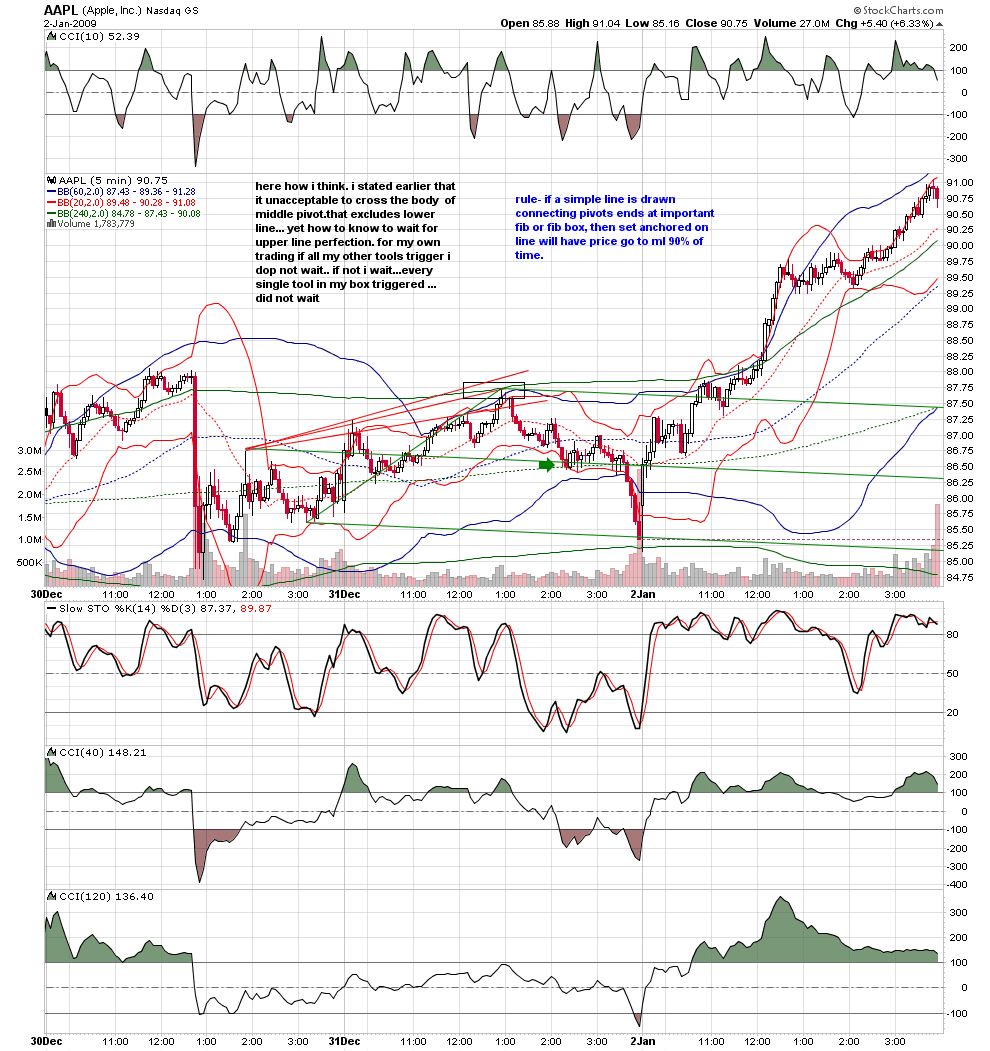
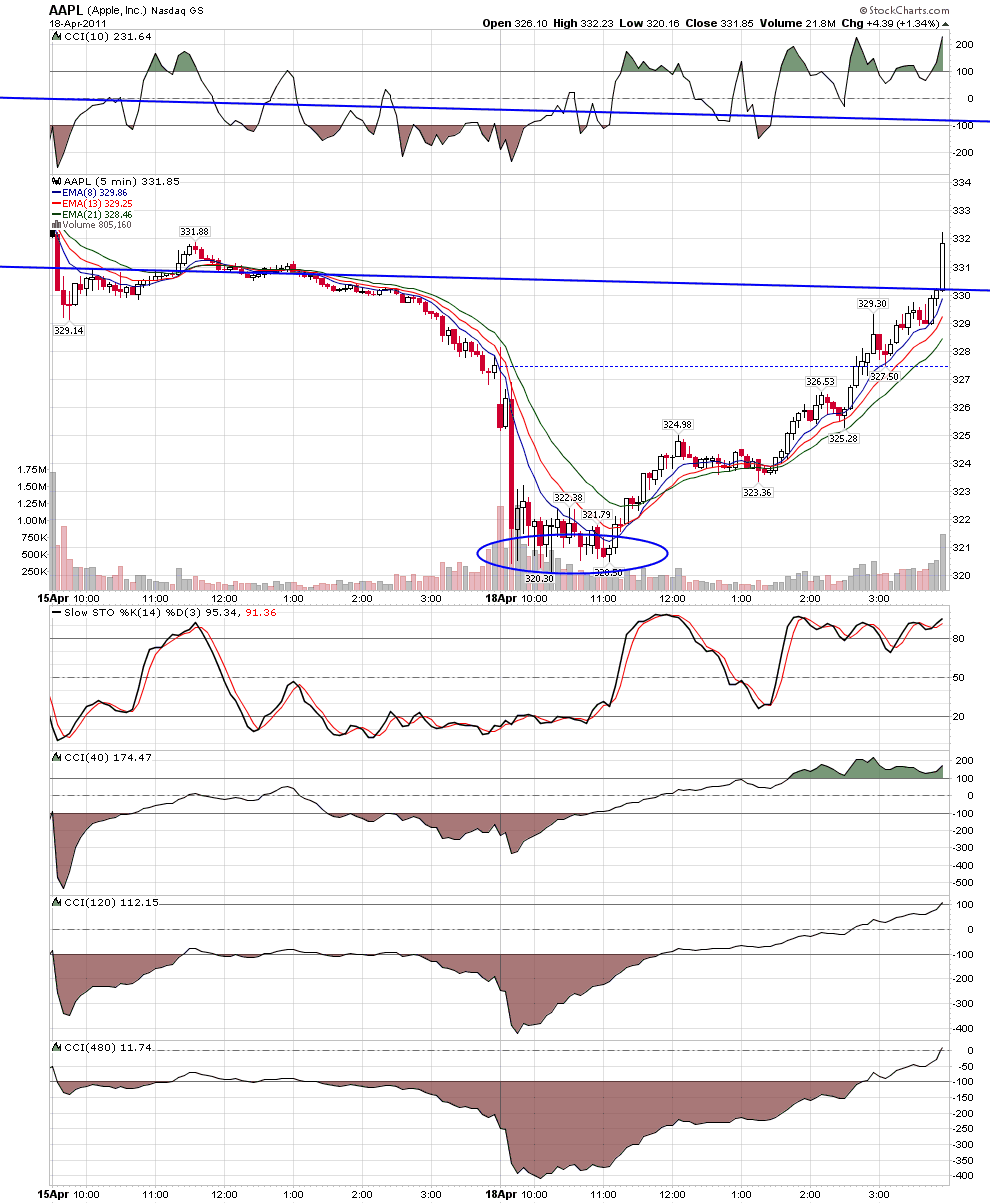
lets go back to the appl chart... but first a little background... my whole way of trading is driven by trying to discern when different groups of numbers traders are looking to act at THE SAME MOMENT IN TIME. i do not judge... nor do i mock and find fault with the choices made by other SKILLED traders. i simply want to know and have that knowing visually on my chart or written on my pad.so who can we SEE by just looking at our charts?the simple line traders, the medianline traders,the fib traders, the band traders, the divergence traders, the time traders via stochastics and the time and intent traders via the different cci's...so why did i say dont wait for perfection?the four pillars( simple line,frequency of ml set and two sqrt) were all present at the confluence of the uppers bands from all three timeframes with divergence, the favorite of band traders, with stoch above 80 and time and intent as i have shown before in place for sell.. there was simply not a single group of numbers traders looking to be long... each in their own way was looking to be short...note when i trade indexes i know where the pivot traders and market profile traders are looking to trade. it never ceases to amaze me how closed minded those groups are. most often their best trades are in conjunction with other traders tools.. yet they mock the validity of what i do... such is life...
Click image for original size
RO
roofer
Rep: 3,689
Posts: 3,574
jim's recent post of .886 on gap day is a good example... it just so happened that the vpoc of that day was EXACTLY at the confluence of .886and line from ml set...but the success of that trade was used by the market profile traders to say how great their tools are and how other tools are waste of time...more for meis all i have to say...
MR
mreiserer
Rep: 110
Posts: 2,220
Awesome insight, Roofer.
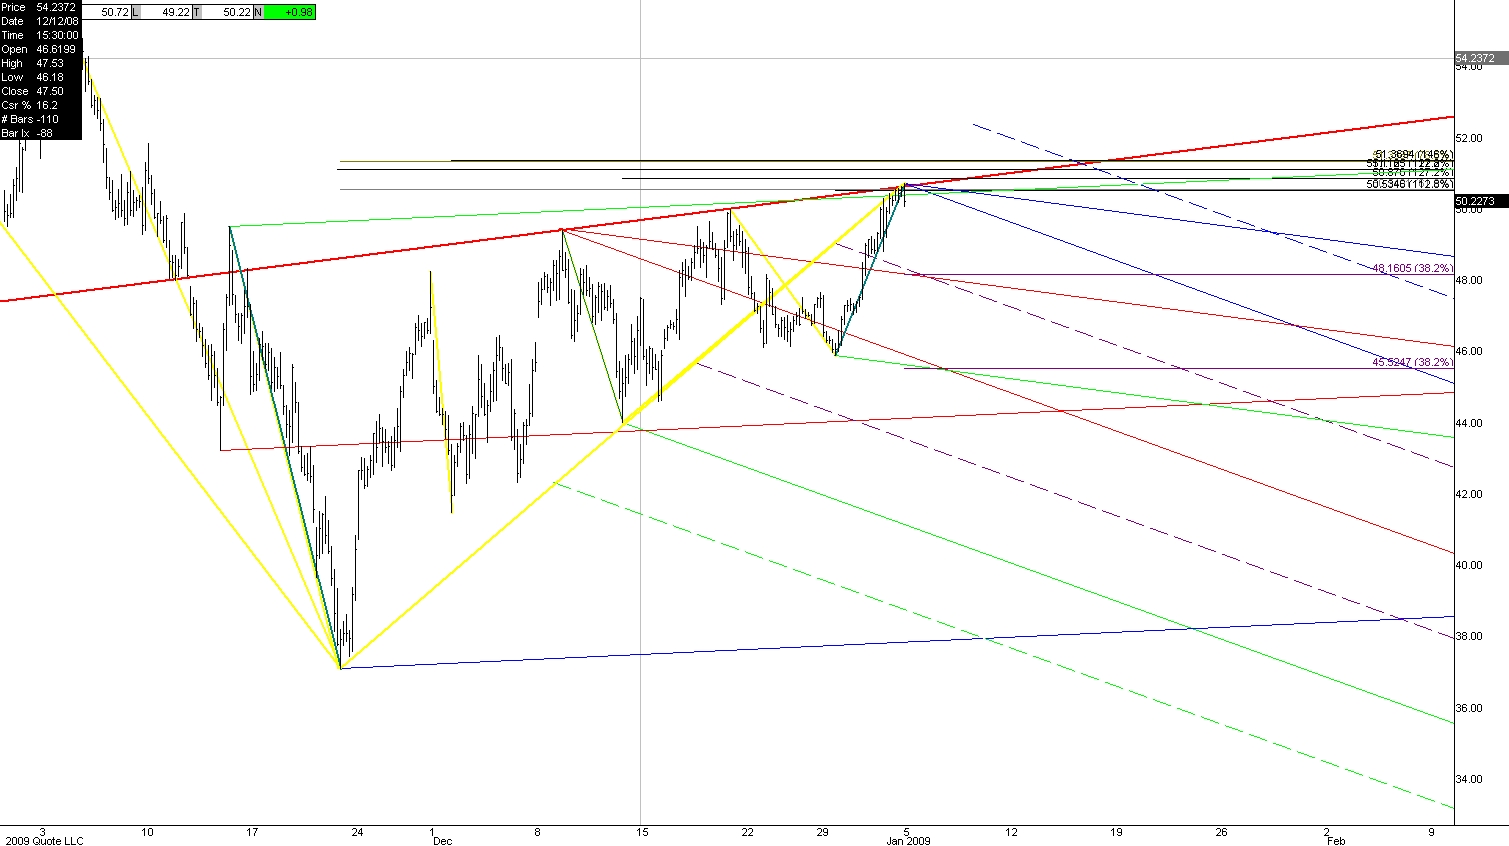
Using the technique as I understand it I have drawn up this scenario for IWM. There are two sets based on pivots 1 and 3.
If this were to play out and I used the ML of the larger set as
"target guidance" I would definetly have to play defense where the division line and the ML of the smaller set meet with a .382 (there is also a upsloping lower // that comes in right at that spot.
For a daytrade the smaller set would be the more realistic target imo.
Thoughts?
Click image for original size
CR
craft
Rep: 100
Posts: 206
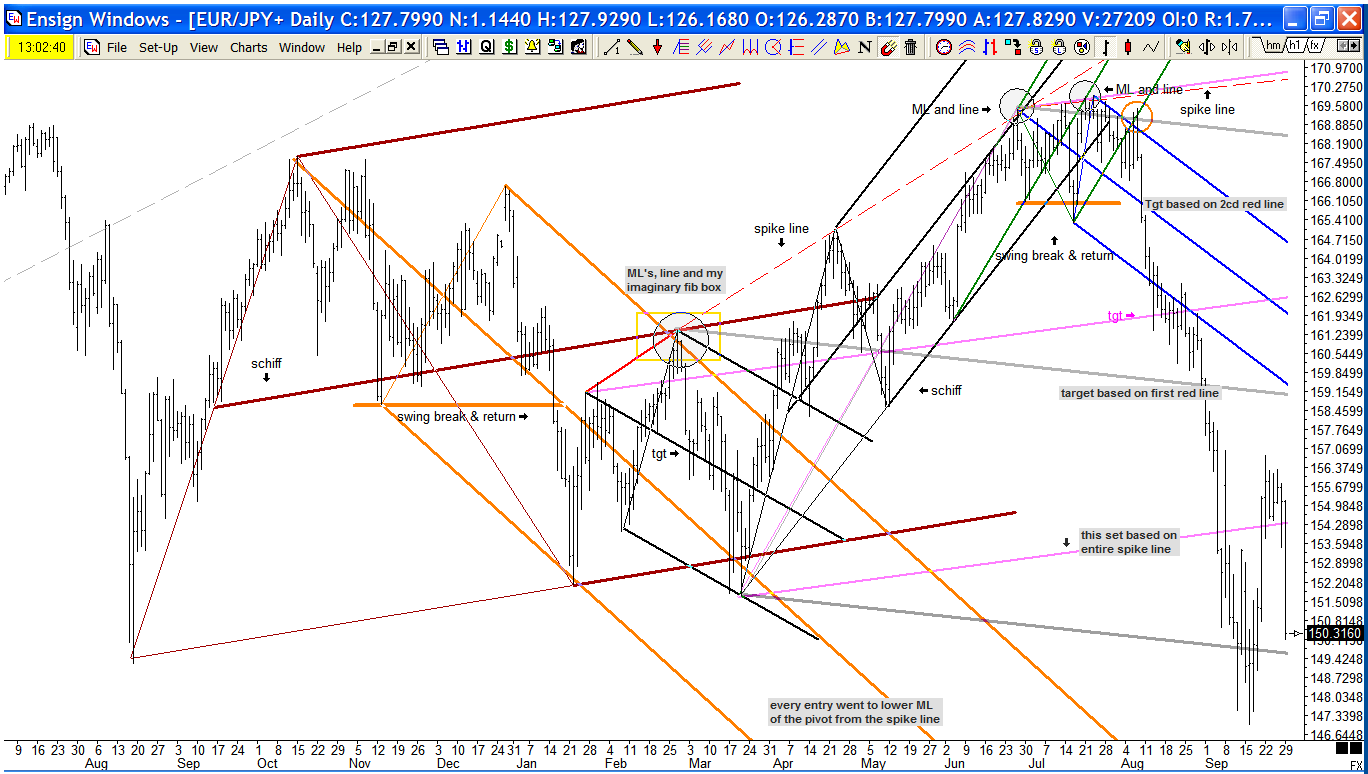
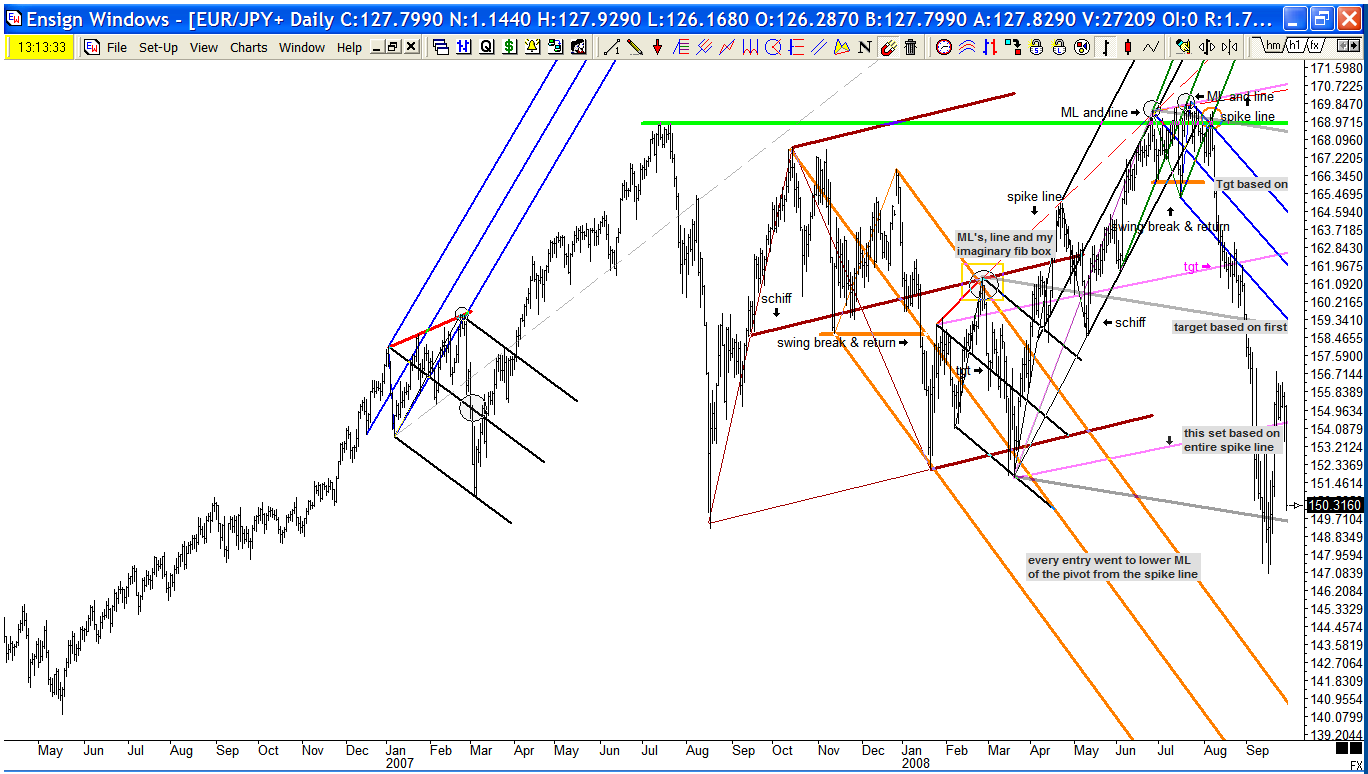
EUR/JPY: I always got the setup or at least the spirit of it... If I'm missing, tell me what i missed. I don't have a fib box but estimate it. I have 3 spike lines on this chart. The first one at the orange ML might be the only legit setup. Price pulling back to line, ML, and fib box.
The other ones have the same concepts but no fib box unless it would be a fib extension. I will start collecting my 1000 examples. Many times It fits with the setups im using after the swing break. Perhaps I can mange better entries or get in when I would normaly have to pass.
In all examples price stopped dead at the up sloping ML and line. The down sloping picked it up. the ML set based on spike line pivots met target every time.
Click image for original size
Click image for original size
RO
roofer
Rep: 3,689
Posts: 3,574
origins-just as the .886 on gap day had origins in simple search, a simple recording of when price turned at .886,the simple line set was pretty basic...if it is all just geometry than the simplest after a point is a line....if it is all just geometry then pivots form for a reason.... for a long time i had been playing with skip sets... sets which skipped a pivot... i found no edge... so the next step was to say what if i used only 3 pivots that aligned( a technique i was already using with the other 3 pillars of geometry.)then i simply recorded how often price went to medianline... i found it to be conservatively 90% over a broad sample.... better than that claimed for traditional ml's. i like it because it gives a very specific set of medianlines to focus on, high probability and tight stop.
RO
roofer
Rep: 3,689
Posts: 3,574
again- i invite traders to now go back and carefully look at the charts i posted under simplicity... i was showing the richness of the tools and the added clarity give by the sl sets.