RO
roofer
Rep: 3,689
Posts: 3,574
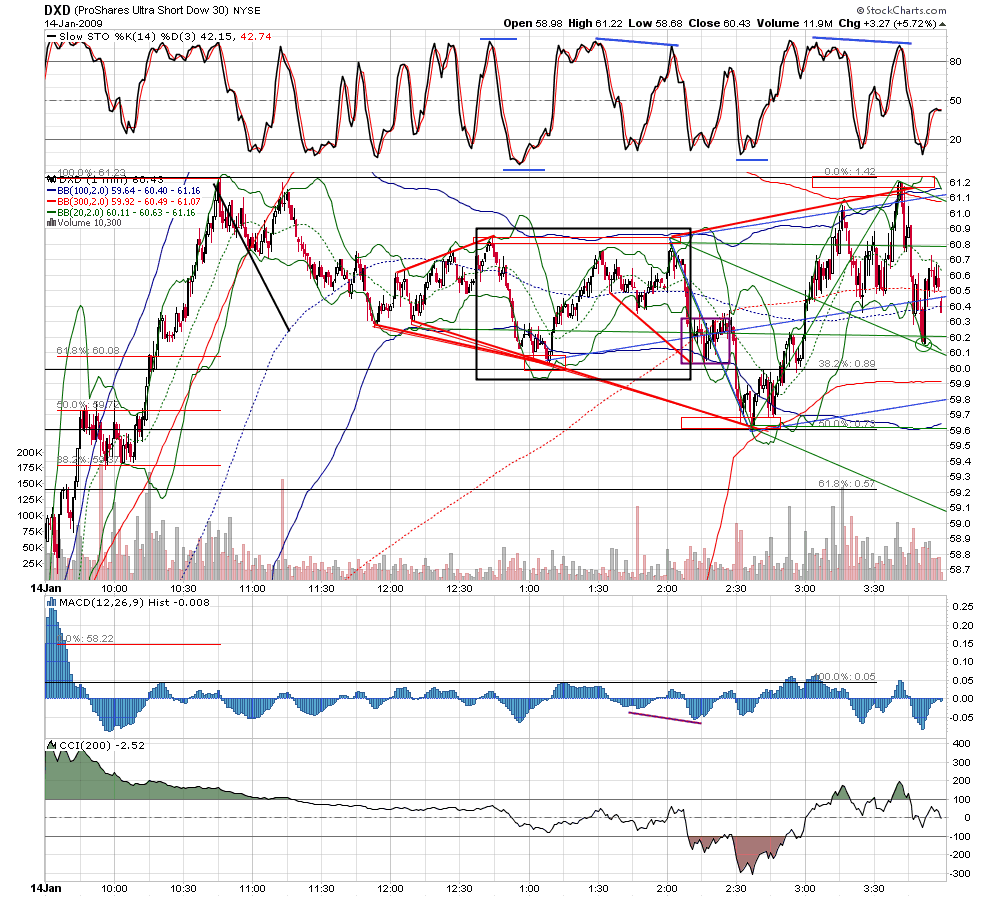
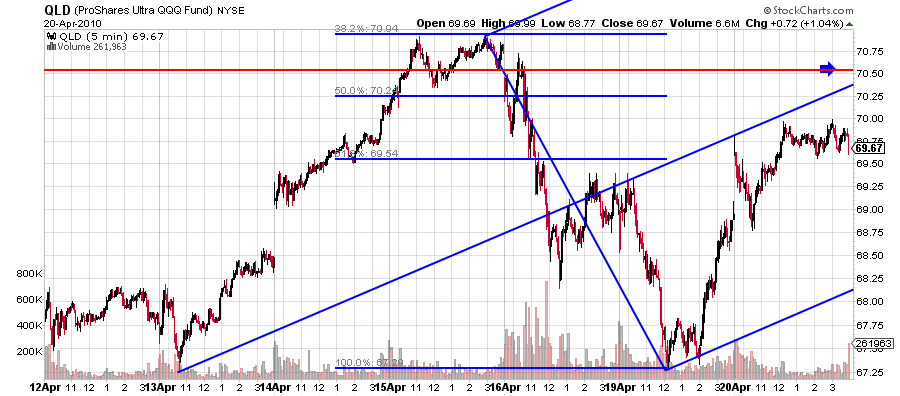
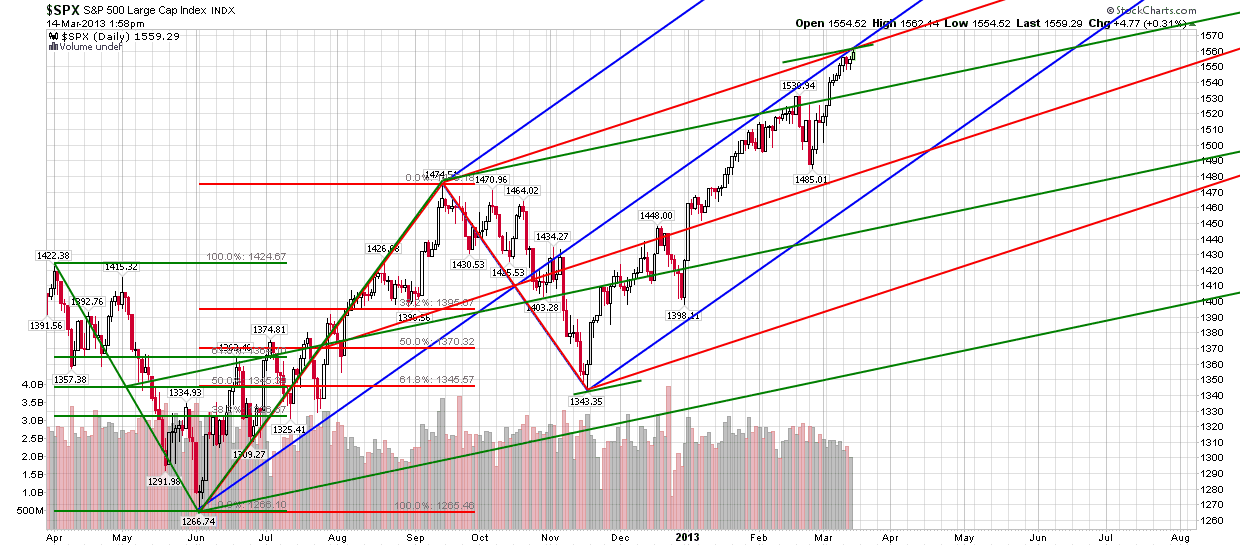
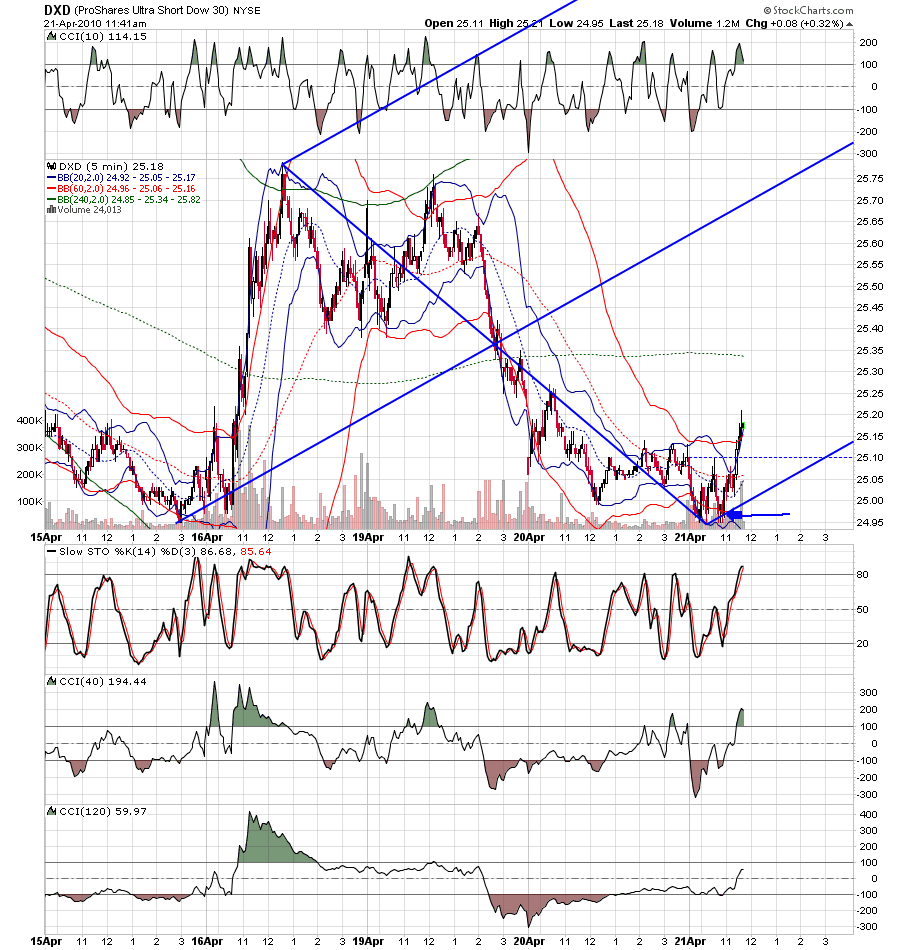
craft- i have been posting my best work here. i guess this is my cave! i am sure you noticed that all three charts showed what is now my highest probability setup.draw a simple line connecting 3 pivots that ends in fib box. anchor medianline set on that line. price will go to medianline 90% of time....
JA
jarek
Rep: 94
Posts: 3,474
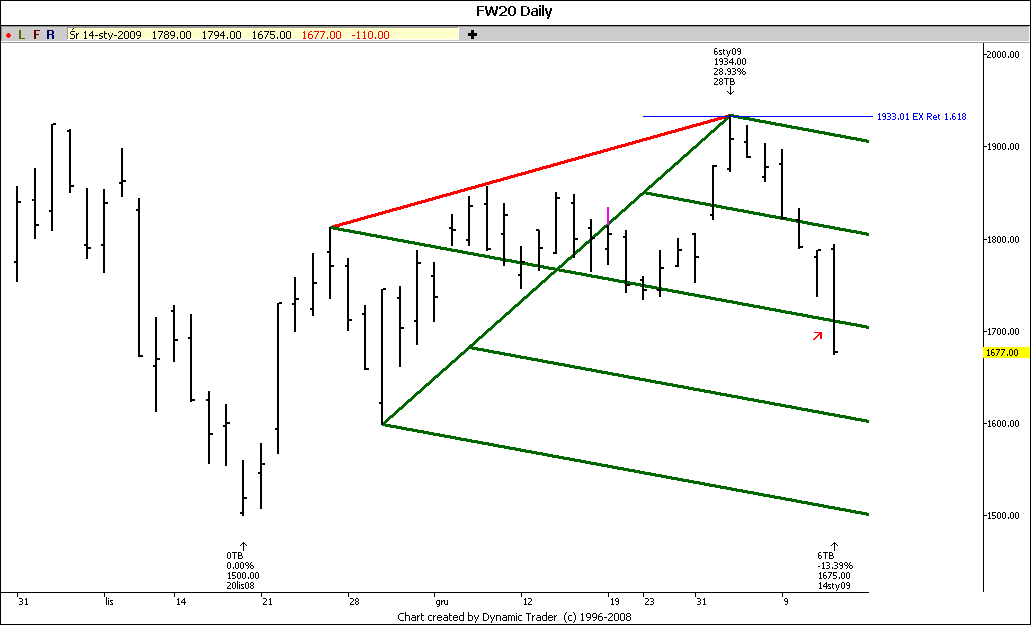
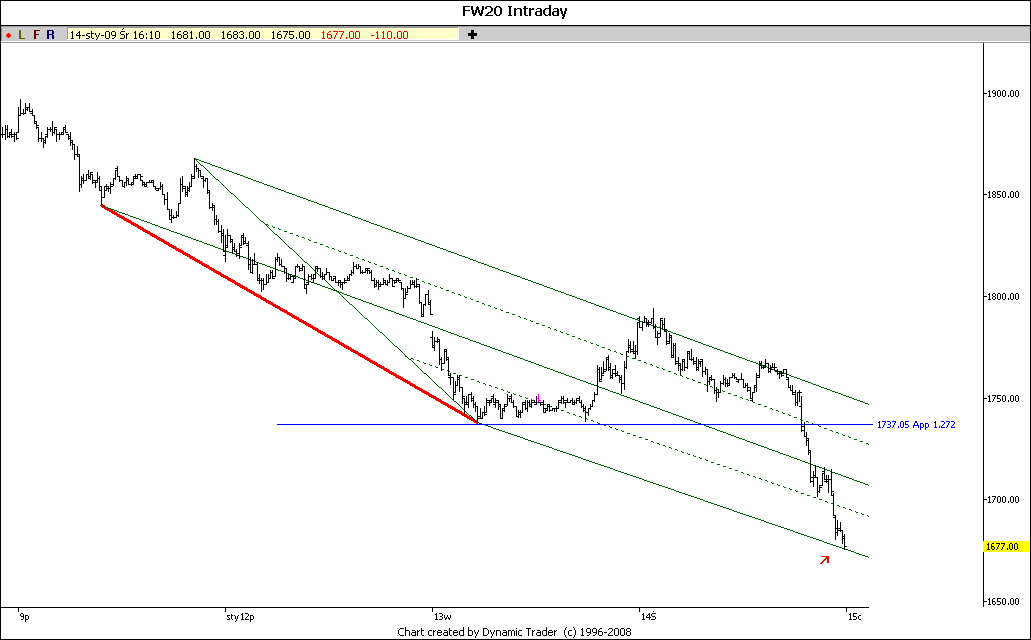
This is to confirm that the setup works well in different markets.
Here is a recent example from a local stock exchange in Warsaw, Poland:
Thank you for all your gifts Roofer.
Jarek
Here is a recent example from a local stock exchange in Warsaw, Poland:
Click image for original size
Thank you for all your gifts Roofer.
Jarek
JA
jarek
Rep: 94
Posts: 3,474
Based on another setup we can also say that Warsaw Stock Exchange should start higher tomorrow (we are already closed):
And since usually we simply follow the close of the US markets on the previous day it might point to your finish on a high note today :-)
Click image for original size
And since usually we simply follow the close of the US markets on the previous day it might point to your finish on a high note today :-)
RO
roofer
Rep: 3,689
Posts: 3,574
the game goes on.... i get enough of these that this is the only entry i take
Click image for original size
MR
mreiserer
Rep: 110
Posts: 2,220
you make it look so easy. I don't know how you flip through charts like this. I have a hard time concentrating on two issues at the same time...
RO
roofer
Rep: 3,689
Posts: 3,574
IT IS NOT EASY....i pretty much trade the same things over and over.stockcharts has a feature where you can scroll ten charts at a time.. that helps. now remember, i am most interested in trading the goemtry when time sets up... that is how i have trained my brain... and it is my ''job'' to capture the swings from brown to green...so in a glance i can see''time'' as i define it... then i see if geometry is there.. often the geometry jumps off the screen at me first... then i check for time... at night i pretty much know at what price i want to trade in morn...then as the open approaches i am ready..
IS
iso
Rep: 0
Posts: 81
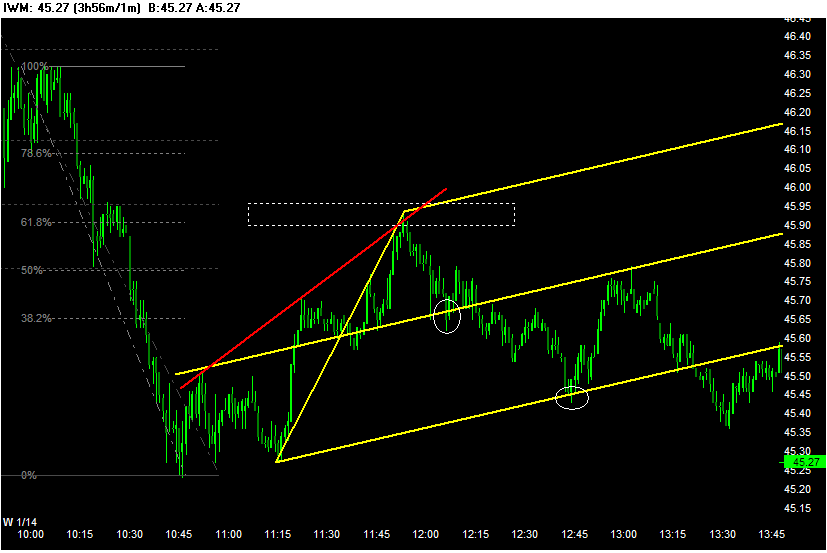
I am still trying to get this. Does this look correct?
Thanks
Thanks
Click image for original size
RO
roofer
Rep: 3,689
Posts: 3,574
iso i am running on empty... and i have been preparing this for m m i have trained my brain to see a chart and have the same questions race through my brain.....for a buy.. do i have price at lower band or confluence of bands with divergence with fib with stoch below 20 and time on cci... do i have the line for THE TRADE.. has the trade setup with or againt kane pattern or frequency of medianlines. i can see this all faster than i can type it...note the double top abcd,,,note the trade setup in small box... we know that 80% of time the bottom of pattern will be taken out.. since it had not been yet, the trade was not taken until abcd pattern completed..i look for the same trade and ask the same questions every time...chart
Click image for original size