Larry Pesavento's Insights on the Markets & Charts
Click image for original size
Click image for original size
The market is rising into the cycle date of Mar 27-30 th.It has been straight up since the low of Mar 6th.
Probability strongly suggests that a correction is overdue.The market has fulfilled our objective as one of the strongest rallies in market history --it ranks in top 4 I believe -
I do not know with certainty what will happen in the next few days but I have never done well buying
into strength after a 10 day rally!!!!
Some of the stocks in the option play did not make new highs today--this could be the first sign
that a correction is near --but a weak sign at best


Robin what was the date on that last chart- Also what would be the trigger for a sell signal
Stock market
Stocks continued their three-week rally making it one of the largest percentage gains in 60 years. Keep in mind that is much easier to make a large percentage gain when you're starting with a smaller number. Since the low on March 6 the market has basically rallied with very few corrections along the way. The next two weeks will tell us if this was in fact a major bottom or just a small rally in a bear market. Many subscribers have asked about the triple conjunction that occurs from March 27 to March 30. Although it is a powerful and accurate Astro harmonic it has a tendency to be short-lived. What I mean by that is that the effects usually only last 3 to 5 days and the next cycle will come in and cause the next low or high.
The most bullish action would be for a sharp down move into Monday or Tuesday followed by an explosive move to the upside where the market in the S&P 500 goes above 850. Should this occur it would probably validate the March 6 low has potentially the low for the next six months which would correspond to the Bradley market model. However, if we make new lows below 666 in the S&P 500 it could mean another leg down to near the 500 level. Personally, I don't think that is going to happen.
Treasury bonds
This market is symmetry in action! There is a huge pennant being completed with the 618 on the upside and 618 on the downside. Should we get a 61% rally as shown on the chart I would view that as an early Christmas gift to get short. The risk reward ratio on this trade would be above 7 to 1 and it would also give us a chance to reinstate our trade of the year which was to be short treasury bonds. Those of you new to the markets will not remember this but T. bonds once sold at 57 and they are now near 130. Potentially this has the chance of being another speculative bubble. Chinese buying treasury bonds is in the news constantly. Now the Federal Reserve Board is buying 500 billion worth of bonds in order to prop up the market. The question I ask is who is going to buy them if only the Federal Reserve is interested. It is hard to understand strength in bonds when we print money to pay for so many bailout programs and failed corporations. Somewhere along the line someone is going to holler uncle and then all hell will break loose! Fortunately the patterns that we are seeing make it beneficial to use our patience and discipline and wait for pattern completion.
US dollar
The US dollar has a potential for a major double top off of the recent highs. The sharp downdraft of the past several weeks stopped just shy of the 61% retracement. The next rally in the US dollar will give us more information as to whether the double top is in fact a valid pattern. Given that swiftness was quite dramatic on the downside we would expect more selling to come into the US dollar. The euro has strong support in the 1.27 level than any move below 1.25 would signify a big move to the downside with price objectives near 92. Likewise the British pound has the same type of pattern and it also has strong resistance in the 1.47 level. Mysteriously, the Japanese yen has yet to make me 82.00 levelThis target has been outstanding for many weeks and months now. Eventually, the end will reestablish a trend or go down to complete the butterfly at the 82 level. It is a coin toss at this point.
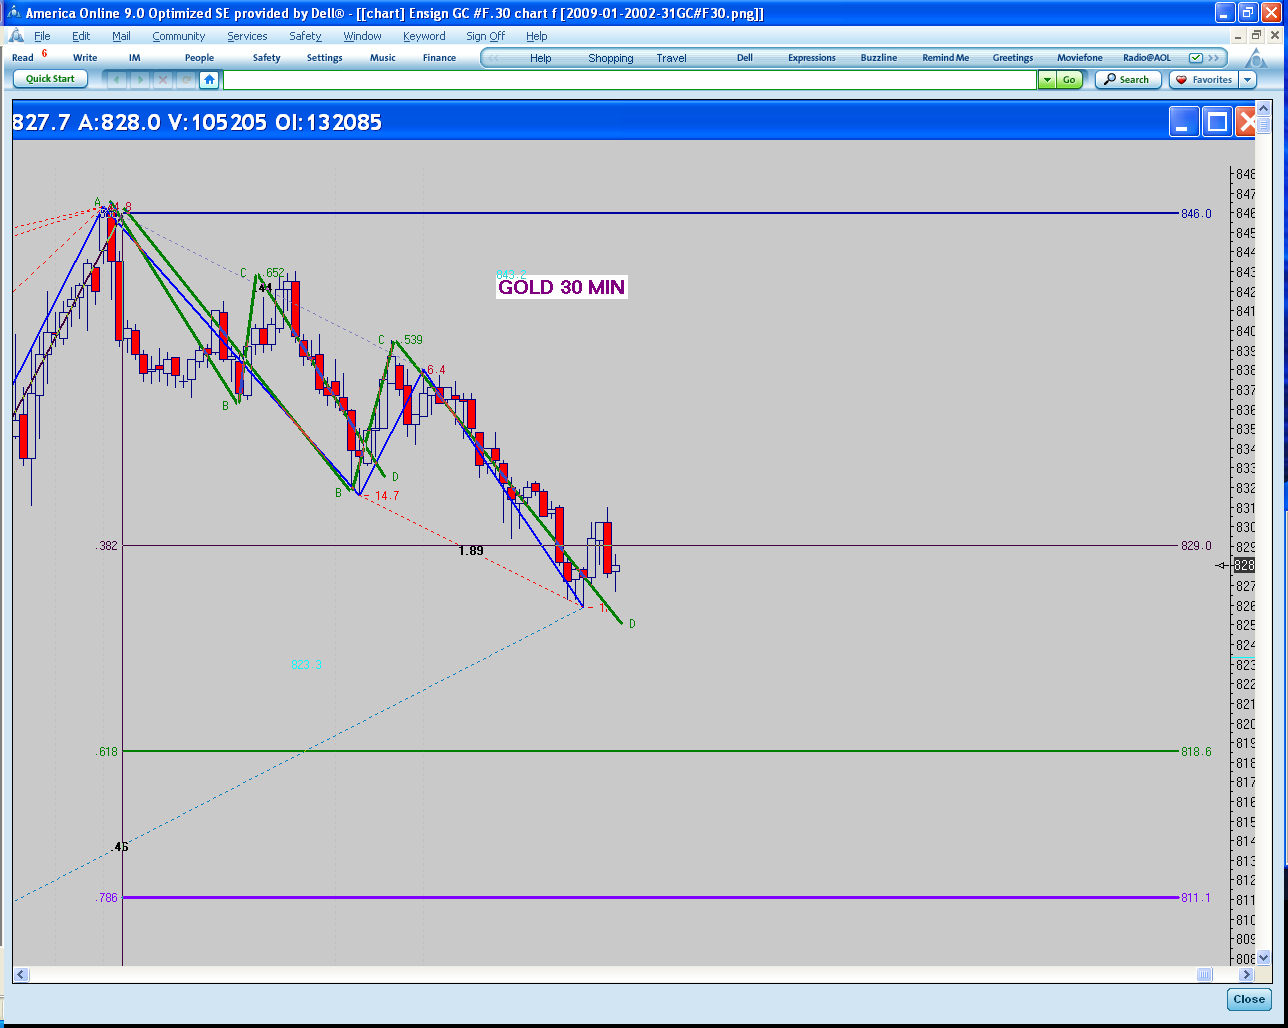
Gold
$903/oz is the 786 retracement of the last swing and sets up a pennant or flag that could break out in either direction. Odds favor a move to below 850 per ounce because each of the highs have been lower and we have a potential double top in gold at the $1000 per ounce level. Realize that we've had the most bearish financial markets in the last 70 years and one would've expected that gold would be trading far above $1000 per ounce at this time. We remain bullish on gold but would like to buy it if we've got a nice correction into the $850 per ounce level. Should Gold move above $970 per ounce then it would be the first indication of a close above the old high of $1030 per ounce. Advertisements constantly hit television talking about $2500 and ounce gold. It reminds me when gold was trading at $800 per ounce in 1980 and everyone was talking about $2000 per ounce gold at that time because interest rates were double digit. I can remember buying AAA muni bonds tax-free with an interest rate of 14%. These bonds were called away very quickly once interest rates started to drop dramatically.
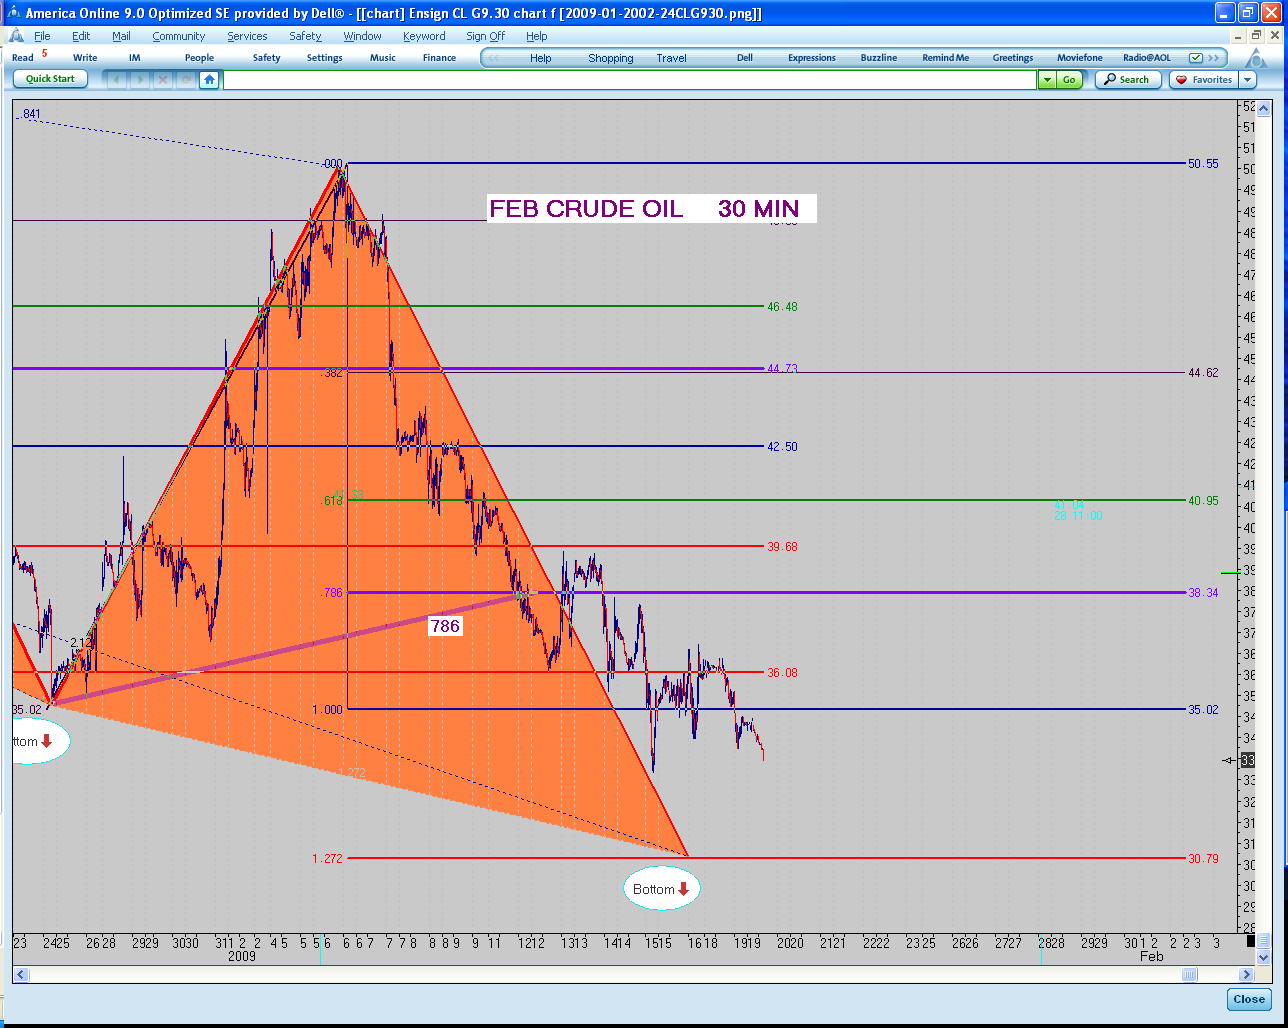
Crude oil
The the move from $34 a barrel to $55 a barrel did not take as long as some analysts had thought. Oil is currently overbought and would be a very interesting long play should it get into the area of $42 per barrel over the next few weeks. This represents a 618 Fibonacci retracement of the current rally. Ideally, a nice Gartley buy pattern would form in the area of $42 per barrel. We will be watching this one closely because it has great potential as markets that dropped from 143 per barrel to 33 per barrel have a great probability of rallying much farther than most people can think or even imagine.
Grains and oilseeds
Corn has continued to be the strongest in this sector. Soybeans have had some rallies but each of them have been pushed away at the 618 level. Wheat on the other hand has been very weak and appears to be forming a major butterfly at the $4.50 per bushel level. This price level marks the beginning of where we began his big bull move to over $16 per bushel a few years ago. Even a modest rally back would be a considerable bull market. It remains to be seen if we can break below the recent lows and head for the 1.27 expansion and butterfly completion. Should this occur it would setup a potential option play by buying wheat calls with very low risk.
Stocks continued their three-week rally making it one of the largest percentage gains in 60 years. Keep in mind that is much easier to make a large percentage gain when you're starting with a smaller number. Since the low on March 6 the market has basically rallied with very few corrections along the way. The next two weeks will tell us if this was in fact a major bottom or just a small rally in a bear market. Many subscribers have asked about the triple conjunction that occurs from March 27 to March 30. Although it is a powerful and accurate Astro harmonic it has a tendency to be short-lived. What I mean by that is that the effects usually only last 3 to 5 days and the next cycle will come in and cause the next low or high.
The most bullish action would be for a sharp down move into Monday or Tuesday followed by an explosive move to the upside where the market in the S&P 500 goes above 850. Should this occur it would probably validate the March 6 low has potentially the low for the next six months which would correspond to the Bradley market model. However, if we make new lows below 666 in the S&P 500 it could mean another leg down to near the 500 level. Personally, I don't think that is going to happen.
Treasury bonds
This market is symmetry in action! There is a huge pennant being completed with the 618 on the upside and 618 on the downside. Should we get a 61% rally as shown on the chart I would view that as an early Christmas gift to get short. The risk reward ratio on this trade would be above 7 to 1 and it would also give us a chance to reinstate our trade of the year which was to be short treasury bonds. Those of you new to the markets will not remember this but T. bonds once sold at 57 and they are now near 130. Potentially this has the chance of being another speculative bubble. Chinese buying treasury bonds is in the news constantly. Now the Federal Reserve Board is buying 500 billion worth of bonds in order to prop up the market. The question I ask is who is going to buy them if only the Federal Reserve is interested. It is hard to understand strength in bonds when we print money to pay for so many bailout programs and failed corporations. Somewhere along the line someone is going to holler uncle and then all hell will break loose! Fortunately the patterns that we are seeing make it beneficial to use our patience and discipline and wait for pattern completion.
US dollar
The US dollar has a potential for a major double top off of the recent highs. The sharp downdraft of the past several weeks stopped just shy of the 61% retracement. The next rally in the US dollar will give us more information as to whether the double top is in fact a valid pattern. Given that swiftness was quite dramatic on the downside we would expect more selling to come into the US dollar. The euro has strong support in the 1.27 level than any move below 1.25 would signify a big move to the downside with price objectives near 92. Likewise the British pound has the same type of pattern and it also has strong resistance in the 1.47 level. Mysteriously, the Japanese yen has yet to make me 82.00 levelThis target has been outstanding for many weeks and months now. Eventually, the end will reestablish a trend or go down to complete the butterfly at the 82 level. It is a coin toss at this point.
Gold
$903/oz is the 786 retracement of the last swing and sets up a pennant or flag that could break out in either direction. Odds favor a move to below 850 per ounce because each of the highs have been lower and we have a potential double top in gold at the $1000 per ounce level. Realize that we've had the most bearish financial markets in the last 70 years and one would've expected that gold would be trading far above $1000 per ounce at this time. We remain bullish on gold but would like to buy it if we've got a nice correction into the $850 per ounce level. Should Gold move above $970 per ounce then it would be the first indication of a close above the old high of $1030 per ounce. Advertisements constantly hit television talking about $2500 and ounce gold. It reminds me when gold was trading at $800 per ounce in 1980 and everyone was talking about $2000 per ounce gold at that time because interest rates were double digit. I can remember buying AAA muni bonds tax-free with an interest rate of 14%. These bonds were called away very quickly once interest rates started to drop dramatically.
Crude oil
The the move from $34 a barrel to $55 a barrel did not take as long as some analysts had thought. Oil is currently overbought and would be a very interesting long play should it get into the area of $42 per barrel over the next few weeks. This represents a 618 Fibonacci retracement of the current rally. Ideally, a nice Gartley buy pattern would form in the area of $42 per barrel. We will be watching this one closely because it has great potential as markets that dropped from 143 per barrel to 33 per barrel have a great probability of rallying much farther than most people can think or even imagine.
Grains and oilseeds
Corn has continued to be the strongest in this sector. Soybeans have had some rallies but each of them have been pushed away at the 618 level. Wheat on the other hand has been very weak and appears to be forming a major butterfly at the $4.50 per bushel level. This price level marks the beginning of where we began his big bull move to over $16 per bushel a few years ago. Even a modest rally back would be a considerable bull market. It remains to be seen if we can break below the recent lows and head for the 1.27 expansion and butterfly completion. Should this occur it would setup a potential option play by buying wheat calls with very low risk.
http://screencast.com/t/zfyBvbHq
http://screencast.com/t/q8Xygp05eY
http://screencast.com/t/f0bPe0YP30
http://screencast.com/t/TTRHRsm0F24
http://screencast.com/t/qtepiD2g
http://screencast.com/t/gGsTNFP1
http://screencast.com/t/FmmqhqZ0na9
http://screencast.com/t/q8Xygp05eY
http://screencast.com/t/f0bPe0YP30
http://screencast.com/t/TTRHRsm0F24
http://screencast.com/t/qtepiD2g
http://screencast.com/t/gGsTNFP1
http://screencast.com/t/FmmqhqZ0na9
Larry is at his home in Hong Kong for the next month...
Markets around the world rallied again this week making it one of the largest rallies in recent history .The markets are in an overbought condition .A top could come as early Monday based on the astro harmonics shown on the 30 min S&P 500 !However once 855/860 is exceded it would suggest higher prices are in order in this long term bear market not due to bottom for several years .As fate would have it the ratios and patterns work well in these willd swinging markets.Buy and hold strategies will be hard pressed to work in this situation
US DOLLAR
The dollar looks more like a double top in the 90.00 level than a new bull market!.Notice the interesting harmonic ratios between rally 1 and 2 -rally 2 is exactly 1.618 of rally 1 in the same 11 months time span -This is highly suggestive of another leg down in the dollar !
Treasury bonds
If there is a market looking for an excuse to go down this is the one! Even the fed buying 300 billion of T bonds failed to make the market go higher leaving us the unanswered question WHO IS GOING TO BUY THE REST OF THE BONDS?? THE CHINESE ?? HMMMM interesting
Gold
Should gold reach the $825/oz level it deserves our attention for a long position.! In 1930's gold was illlegal to own but gold stocks rose as it was the only legal way to own the yellow metal! It seems unlikely that gold will drop below $800 given the bullish chart pattern of rising bottoms but the $1000/oz could still be a potential double top especially if gold drops below $800/0z
Crude oil
Oil continued its rally above $50/bbl much to the surprise of most analysts.
It is over bought presently and we would welcome a drop to the 618 level @ $42/bbl ! It would be an early Christmas present should it happen .A nice Gartey pattern would be a perfect setup
Grains and oilseeds
A bottom has been formed in the grains as expected -Whether the new bull market has raised its head is yet to be proven.Option strategies are not cheap so it is best to wait patiently for a symmetrical AB=CD pattern.Should such a pattern arise we will try to let you know via a SPECIAL alert
HONG KONG -
Business in Asia is slow but appears moving ! Restaurants are not as busy and the airports are a lot less crowded -The Porsches and Ferrari still race the streets in early morning hours -I don't see them -I hear them
The stock market attempted to make new highs again today. In fact, the
NASDAQ was able to make new highs. This presents a potential problem for the
Bears, or a great opportunity. Divergence between similar contracts can be
highly indicative of a major trend change. As you can see from the enclosed
chart, the NASDAQ easily exceeded last week's highs, while at the same time
the S&P 500 (i.e. Dow Jones also) were unable to do so! The bearish case is
still up for grabs. Any move in the S&P 500 above 875 would mean that we are
going higher. The figure for the Dow Jones is 8112. This week will be
critical to what happens going into May 18th which is our next Astro
harmonic date( combust ).
This weekend we will present a comprehensive pattern analysis on all the
major markets as we are approaching some completion of very significant
patterns.
Emini Day Trading /
Daily Notes /
Forecast /
Economic Events /
Search /
Terms and Conditions /
Disclaimer /
Books /
Online Books /
Site Map /
Contact /
Privacy Policy /
Links /
About /
Day Trading Forum /
Investment Calculators /
Pivot Point Calculator /
Market Profile Generator /
Fibonacci Calculator /
Mailing List /
Advertise Here /
Articles /
Financial Terms /
Brokers /
Software /
Holidays /
Stock Split Calendar /
Mortgage Calculator /
Donate
Copyright © 2004-2023, MyPivots. All rights reserved.
Copyright © 2004-2023, MyPivots. All rights reserved.